2021false0001592000FYhttp://fasb.org/us-gaap/2021-01-31#AccountingStandardsUpdate201602MemberP10Y11111P1Yhttp://fasb.org/us-gaap/2021-01-31#OtherAssetsNoncurrenthttp://fasb.org/us-gaap/2021-01-31#OtherAssetsNoncurrenthttp://fasb.org/us-gaap/2021-01-31#AccruedLiabilitiesCurrenthttp://fasb.org/us-gaap/2021-01-31#AccruedLiabilitiesCurrenthttp://fasb.org/us-gaap/2021-01-31#OtherLiabilitiesNoncurrenthttp://fasb.org/us-gaap/2021-01-31#OtherLiabilitiesNoncurrentP2D00015920002021-01-012021-12-3100015920002021-06-30iso4217:USD00015920002022-02-09xbrli:shares00015920002021-12-3100015920002020-12-310001592000us-gaap:ProductMember2021-01-012021-12-310001592000us-gaap:ProductMember2020-01-012020-12-310001592000us-gaap:ProductMember2019-01-012019-12-310001592000us-gaap:ServiceMember2021-01-012021-12-310001592000us-gaap:ServiceMember2020-01-012020-12-310001592000us-gaap:ServiceMember2019-01-012019-12-3100015920002020-01-012020-12-3100015920002019-01-012019-12-31iso4217:USDxbrli:shares0001592000enlc:CommonUnitsMember2018-12-310001592000us-gaap:AociIncludingPortionAttributableToNoncontrollingInterestMember2018-12-310001592000us-gaap:NoncontrollingInterestMember2018-12-3100015920002018-12-310001592000enlc:RedeemableNoncontrollingInterestMember2018-12-3100015920002018-01-012018-12-310001592000enlc:CommonUnitsMembersrt:CumulativeEffectPeriodOfAdoptionAdjustmentMember2018-12-310001592000srt:CumulativeEffectPeriodOfAdoptionAdjustmentMember2018-12-310001592000enlc:CommonUnitsMembersrt:CumulativeEffectPeriodOfAdoptionAdjustedBalanceMember2018-12-310001592000srt:CumulativeEffectPeriodOfAdoptionAdjustedBalanceMemberus-gaap:AociIncludingPortionAttributableToNoncontrollingInterestMember2018-12-310001592000srt:CumulativeEffectPeriodOfAdoptionAdjustedBalanceMemberus-gaap:NoncontrollingInterestMember2018-12-310001592000srt:CumulativeEffectPeriodOfAdoptionAdjustedBalanceMember2018-12-310001592000srt:CumulativeEffectPeriodOfAdoptionAdjustedBalanceMemberenlc:RedeemableNoncontrollingInterestMember2018-12-310001592000enlc:CommonUnitsMember2019-01-012019-12-310001592000us-gaap:NoncontrollingInterestMember2019-01-012019-12-310001592000enlc:RedeemableNoncontrollingInterestMember2019-01-012019-12-310001592000us-gaap:AociIncludingPortionAttributableToNoncontrollingInterestMember2019-01-012019-12-310001592000enlc:CommonUnitsMember2019-12-310001592000us-gaap:AociIncludingPortionAttributableToNoncontrollingInterestMember2019-12-310001592000us-gaap:NoncontrollingInterestMember2019-12-3100015920002019-12-310001592000enlc:RedeemableNoncontrollingInterestMember2019-12-310001592000enlc:CommonUnitsMember2020-01-012020-12-310001592000us-gaap:NoncontrollingInterestMember2020-01-012020-12-310001592000enlc:RedeemableNoncontrollingInterestMember2020-01-012020-12-310001592000us-gaap:AociIncludingPortionAttributableToNoncontrollingInterestMember2020-01-012020-12-310001592000enlc:CommonUnitsMember2020-12-310001592000us-gaap:AociIncludingPortionAttributableToNoncontrollingInterestMember2020-12-310001592000us-gaap:NoncontrollingInterestMember2020-12-310001592000enlc:RedeemableNoncontrollingInterestMember2020-12-310001592000enlc:CommonUnitsMember2021-01-012021-12-310001592000us-gaap:NoncontrollingInterestMember2021-01-012021-12-310001592000enlc:RedeemableNoncontrollingInterestMember2021-01-012021-12-310001592000us-gaap:AociIncludingPortionAttributableToNoncontrollingInterestMember2021-01-012021-12-310001592000enlc:CommonUnitsMember2021-12-310001592000us-gaap:AociIncludingPortionAttributableToNoncontrollingInterestMember2021-12-310001592000us-gaap:NoncontrollingInterestMember2021-12-310001592000enlc:RedeemableNoncontrollingInterestMember2021-12-310001592000enlc:EnLinkMidstreamPartnersGPLLCMemberenlc:GIPStetsonIMember2018-07-182018-07-18xbrli:pure0001592000enlc:GIPStetsonIMemberenlc:EnLinkMidstreamPartnersLPMember2018-07-182018-07-180001592000enlc:ENLCMemberenlc:GIPStetsonIIMember2018-07-182018-07-180001592000enlc:EnLinkMidstreamPartnersLPMember2019-01-252019-01-250001592000enlc:MergerMember2019-01-252019-01-2500015920002019-01-252019-01-25utr:mienlc:processingPlantutr:Bcfutr:Denlc:fractionatorutr:bbl00015920002022-01-012021-12-3100015920002023-01-012021-12-3100015920002024-01-012021-12-3100015920002025-01-012021-12-3100015920002026-01-012021-12-3100015920002027-01-012021-12-310001592000enlc:AmarilloRattlerLLCMember2021-04-302021-04-300001592000enlc:AmarilloRattlerLLCMember2021-04-3000015920002019-05-310001592000enlc:WhiteStarMember2019-01-012019-12-310001592000enlc:EnLinkMidstreamPartnersLPMember2021-12-310001592000enlc:EnLinkMidstreamPartnersLPMember2020-12-310001592000enlc:TransmissionAssetsMember2021-12-310001592000enlc:TransmissionAssetsMember2020-12-310001592000enlc:GatheringAssetsMember2021-12-310001592000enlc:GatheringAssetsMember2020-12-310001592000enlc:GasProcessingPlantsMember2021-12-310001592000enlc:GasProcessingPlantsMember2020-12-310001592000enlc:OtherPropertyAndEquipmentMember2021-12-310001592000enlc:OtherPropertyAndEquipmentMember2020-12-310001592000us-gaap:ConstructionInProgressMember2021-12-310001592000us-gaap:ConstructionInProgressMember2020-12-310001592000enlc:TransmissionAssetsMembersrt:MinimumMember2021-01-012021-12-310001592000srt:MaximumMemberenlc:TransmissionAssetsMember2021-01-012021-12-310001592000enlc:GatheringAssetsMembersrt:MinimumMember2021-01-012021-12-310001592000srt:MaximumMemberenlc:GatheringAssetsMember2021-01-012021-12-310001592000srt:MinimumMemberenlc:GasProcessingPlantsMember2021-01-012021-12-310001592000srt:MaximumMemberenlc:GasProcessingPlantsMember2021-01-012021-12-310001592000enlc:OtherPropertyAndEquipmentMembersrt:MinimumMember2021-01-012021-12-310001592000enlc:OtherPropertyAndEquipmentMembersrt:MaximumMember2021-01-012021-12-310001592000enlc:LouisianaOperatingSegmentMember2021-01-012021-12-310001592000enlc:LouisianaOperatingSegmentMember2020-01-012020-12-310001592000enlc:CertainCancelledProjectsMember2020-01-012020-12-310001592000enlc:CedarCoveMidstreamLLCMember2019-01-012019-12-310001592000enlc:DelawareBasinJVMemberenlc:NPGMember2021-12-310001592000enlc:AscensionJVMemberenlc:MarathonPetroleumCorporationMember2021-12-310001592000srt:MinimumMember2021-01-012021-12-310001592000srt:MaximumMember2021-01-012021-12-3100015920002019-04-300001592000enlc:TerminationIncrementFourMember2021-12-310001592000enlc:TerminationIncrementThreeMember2021-12-310001592000enlc:TerminationIncrementTwoMember2021-12-310001592000enlc:TerminationIncrementOneMember2021-12-310001592000us-gaap:CustomerConcentrationRiskMemberenlc:DevonEnergyCorporationMemberus-gaap:SalesRevenueNetMember2021-01-012021-12-310001592000us-gaap:CustomerConcentrationRiskMemberenlc:DevonEnergyCorporationMemberus-gaap:SalesRevenueNetMember2020-01-012020-12-310001592000us-gaap:CustomerConcentrationRiskMemberenlc:DevonEnergyCorporationMemberus-gaap:SalesRevenueNetMember2019-01-012019-12-310001592000us-gaap:CustomerConcentrationRiskMemberenlc:DowHydrocarbonsAndResourcesLLCMemberus-gaap:SalesRevenueNetMember2021-01-012021-12-310001592000us-gaap:CustomerConcentrationRiskMemberenlc:DowHydrocarbonsAndResourcesLLCMemberus-gaap:SalesRevenueNetMember2020-01-012020-12-310001592000us-gaap:CustomerConcentrationRiskMemberenlc:DowHydrocarbonsAndResourcesLLCMemberus-gaap:SalesRevenueNetMember2019-01-012019-12-310001592000us-gaap:CustomerConcentrationRiskMemberenlc:MarathonPetroleumCorporationMemberus-gaap:SalesRevenueNetMember2021-01-012021-12-310001592000us-gaap:CustomerConcentrationRiskMemberenlc:MarathonPetroleumCorporationMemberus-gaap:SalesRevenueNetMember2020-01-012020-12-310001592000us-gaap:CustomerConcentrationRiskMemberenlc:MarathonPetroleumCorporationMemberus-gaap:SalesRevenueNetMember2019-01-012019-12-310001592000enlc:RedeemableNoncontrollingInterestMember2020-01-012020-12-310001592000enlc:EnLinkMidstreamPartnersLPMemberenlc:PermianOperatingSegmentMemberus-gaap:OperatingSegmentsMember2020-01-012020-12-310001592000enlc:LouisianaOperatingSegmentMemberus-gaap:CorporateNonSegmentMemberenlc:EnLinkMidstreamPartnersLPMember2019-01-012019-03-310001592000enlc:EnLinkMidstreamPartnersLPMemberenlc:NorthTexasOperatingSegmentMemberus-gaap:OperatingSegmentsMember2019-01-012019-12-310001592000enlc:EnLinkMidstreamPartnersLPMemberenlc:OklahomaOperatingSegmentMemberus-gaap:OperatingSegmentsMember2019-01-012019-12-310001592000srt:WeightedAverageMember2021-01-012021-12-310001592000enlc:EnLinkMidstreamPartnersLPMemberus-gaap:CustomerRelationshipsMember2020-12-310001592000enlc:EnLinkMidstreamPartnersLPMemberus-gaap:CustomerRelationshipsMember2020-01-012020-12-310001592000enlc:EnLinkMidstreamPartnersLPMemberus-gaap:CustomerRelationshipsMember2021-01-012021-12-310001592000enlc:EnLinkMidstreamPartnersLPMemberus-gaap:CustomerRelationshipsMember2021-12-310001592000enlc:EnLinkMidstreamPartnersLPMemberus-gaap:CustomerRelationshipsMember2019-12-310001592000enlc:EnLinkMidstreamPartnersLPMemberus-gaap:CustomerRelationshipsMember2018-12-310001592000enlc:EnLinkMidstreamPartnersLPMemberus-gaap:CustomerRelationshipsMember2019-01-012019-12-310001592000enlc:CedarCoveJointVentureMember2021-01-012021-12-310001592000enlc:CedarCoveJointVentureMember2020-01-012020-12-310001592000enlc:CedarCoveJointVentureMember2019-01-012019-12-310001592000enlc:CedarCoveJointVentureMember2021-12-310001592000enlc:CedarCoveJointVentureMember2020-12-310001592000enlc:GIPMember2021-01-012021-12-310001592000enlc:GIPMember2020-01-012020-12-310001592000enlc:GIPMember2019-01-012019-12-310001592000enlc:OfficeLeaseMember2021-12-310001592000enlc:OfficeLeaseMember2020-12-310001592000srt:MinimumMemberenlc:CompressionandOtherFieldEquipmentMember2021-12-310001592000srt:MaximumMemberenlc:CompressionandOtherFieldEquipmentMember2021-12-310001592000enlc:CompressionandOtherFieldEquipmentMember2021-12-310001592000enlc:CompressionandOtherFieldEquipmentMember2020-12-310001592000us-gaap:LandMember2021-12-310001592000us-gaap:LandMember2020-12-310001592000us-gaap:OfficeEquipmentMember2021-12-310001592000us-gaap:OfficeEquipmentMember2020-12-310001592000enlc:TermLoanDue2021Member2021-12-310001592000enlc:TermLoanDue2021Member2020-12-310001592000enlc:CreditFacilityDue2024Member2021-12-310001592000enlc:CreditFacilityDue2024Member2020-12-310001592000enlc:ARFacilityDue2024Member2021-12-310001592000enlc:ARFacilityDue2024Member2020-12-310001592000enlc:A4.4SeniorNotesdue2024Member2021-12-310001592000enlc:A4.4SeniorNotesdue2024Member2020-12-310001592000enlc:A4.15SeniorNotesdue2025Member2021-12-310001592000enlc:A4.15SeniorNotesdue2025Member2020-12-310001592000enlc:A4.85SeniorUnsecuredNotesDue2026Member2021-12-310001592000enlc:A4.85SeniorUnsecuredNotesDue2026Member2020-12-310001592000enlc:A5625SeniorUnsecuredNotesDue2028Member2021-12-310001592000enlc:A5625SeniorUnsecuredNotesDue2028Member2020-12-310001592000enlc:A5.375Seniorunsecurednotesdue2029Member2021-12-310001592000enlc:A5.375Seniorunsecurednotesdue2029Member2020-12-310001592000enlc:A5.6SeniorNotesdue2044Member2021-12-310001592000enlc:A5.6SeniorNotesdue2044Member2020-12-310001592000enlc:A5.05SeniorNotesdue2045Member2021-12-310001592000enlc:A5.05SeniorNotesdue2045Member2020-12-310001592000enlc:SeniorUnsecuredNotes5.45Due2047Member2021-12-310001592000enlc:SeniorUnsecuredNotes5.45Due2047Member2020-12-310001592000us-gaap:UnsecuredDebtMemberenlc:TermLoanDue2021Member2020-12-012020-12-310001592000us-gaap:UnsecuredDebtMemberenlc:TermLoanDue2021Member2021-05-012021-05-310001592000us-gaap:UnsecuredDebtMemberenlc:TermLoanDue2021Member2021-09-012021-09-300001592000us-gaap:UnsecuredDebtMemberenlc:TermLoanDue2021Member2021-12-102021-12-100001592000enlc:RevolviingCreditFacilityUnsecuredMember2018-12-112018-12-110001592000enlc:RevolviingCreditFacilityUnsecuredMemberus-gaap:LetterOfCreditMember2018-12-110001592000enlc:RevolviingCreditFacilityUnsecuredMemberus-gaap:LetterOfCreditMember2021-12-310001592000enlc:RevolvingCreditFacilityUnsecuredMember2021-12-310001592000us-gaap:LetterOfCreditMemberenlc:RevolvingCreditFacilityUnsecuredMemberenlc:ENLCMember2021-12-310001592000us-gaap:UnsecuredDebtMemberenlc:RevolviingCreditFacilityUnsecuredMember2018-12-110001592000us-gaap:UnsecuredDebtMemberenlc:RevolvingCreditFacilityUnsecuredMembersrt:MinimumMember2021-01-012021-12-310001592000us-gaap:UnsecuredDebtMembersrt:MaximumMemberenlc:RevolvingCreditFacilityUnsecuredMember2021-12-310001592000us-gaap:UnsecuredDebtMemberenlc:RevolvingCreditFacilityUnsecuredMember2021-04-300001592000us-gaap:LondonInterbankOfferedRateLIBORMemberenlc:EnLinkMidstreamPartnersLPMemberenlc:RevolvingCreditFacilityUnsecuredMembersrt:MinimumMember2021-01-012021-12-310001592000us-gaap:LondonInterbankOfferedRateLIBORMembersrt:MaximumMemberenlc:EnLinkMidstreamPartnersLPMemberenlc:RevolvingCreditFacilityUnsecuredMember2021-01-012021-12-310001592000us-gaap:UnsecuredDebtMemberenlc:RevolviingCreditFacilityUnsecuredMemberus-gaap:FederalFundsEffectiveSwapRateMember2018-12-112018-12-110001592000us-gaap:UnsecuredDebtMemberenlc:RevolvingCreditFacilityUnsecuredMemberus-gaap:EurodollarMember2021-01-012021-12-310001592000us-gaap:UnsecuredDebtMemberenlc:RevolviingCreditFacilityUnsecuredMembersrt:MinimumMemberus-gaap:EurodollarMember2018-12-112018-12-110001592000us-gaap:UnsecuredDebtMemberenlc:RevolviingCreditFacilityUnsecuredMemberus-gaap:EurodollarMember2018-12-112018-12-110001592000us-gaap:AssetBackedSecuritiesMemberus-gaap:LineOfCreditMember2020-10-210001592000us-gaap:AssetBackedSecuritiesMemberus-gaap:LineOfCreditMember2021-02-262021-02-260001592000us-gaap:AssetBackedSecuritiesMemberus-gaap:LineOfCreditMember2021-02-260001592000us-gaap:LondonInterbankOfferedRateLIBORMemberus-gaap:AssetBackedSecuritiesMemberus-gaap:LineOfCreditMembersrt:MinimumMember2021-02-262021-02-260001592000us-gaap:LondonInterbankOfferedRateLIBORMemberus-gaap:AssetBackedSecuritiesMemberus-gaap:LineOfCreditMembersrt:MinimumMember2020-10-212020-10-210001592000us-gaap:AssetBackedSecuritiesMemberus-gaap:LineOfCreditMember2020-10-212020-10-210001592000us-gaap:AssetBackedSecuritiesMemberus-gaap:LineOfCreditMember2021-09-242021-09-240001592000us-gaap:AssetBackedSecuritiesMemberus-gaap:LineOfCreditMember2021-09-240001592000us-gaap:AssetBackedSecuritiesMemberus-gaap:LineOfCreditMember2021-12-310001592000us-gaap:LondonInterbankOfferedRateLIBORMemberus-gaap:AssetBackedSecuritiesMemberus-gaap:LineOfCreditMembersrt:MinimumMember2021-01-012021-12-310001592000us-gaap:UnsecuredDebtMemberenlc:A5625SeniorUnsecuredNotesDue2028Member2020-12-1400015920002020-12-142020-12-140001592000us-gaap:UnsecuredDebtMember2020-12-140001592000enlc:EnLinkMidstreamPartnersLPMemberenlc:TreasuryRateMemberenlc:A4.4SeniorNotesdue2024Member2021-01-012021-12-310001592000enlc:EnLinkMidstreamPartnersLPMemberenlc:TreasuryRateMemberenlc:A4.15SeniorNotesdue2025Member2021-01-012021-12-310001592000enlc:EnLinkMidstreamPartnersLPMemberenlc:A4.85SeniorUnsecuredNotesDue2026Memberenlc:TreasuryRateMember2021-01-012021-12-310001592000enlc:EnLinkMidstreamPartnersLPMemberenlc:A5625SeniorUnsecuredNotesDue2028Memberenlc:TreasuryRateMember2021-01-012021-12-310001592000enlc:A5.375Seniorunsecurednotesdue2029Memberenlc:EnLinkMidstreamPartnersLPMemberenlc:TreasuryRateMember2021-01-012021-12-310001592000enlc:EnLinkMidstreamPartnersLPMemberenlc:A5.6SeniorNotesdue2044Memberenlc:TreasuryRateMember2021-01-012021-12-310001592000enlc:EnLinkMidstreamPartnersLPMemberenlc:A5.05SeniorNotesdue2045Memberenlc:TreasuryRateMember2021-01-012021-12-310001592000enlc:EnLinkMidstreamPartnersLPMemberenlc:TreasuryRateMemberenlc:SeniorUnsecuredNotes5.45Due2047Member2021-01-012021-12-310001592000enlc:OklahomaOperatingSegmentMember2021-01-012021-12-310001592000us-gaap:DomesticCountryMember2021-12-310001592000us-gaap:StateAndLocalJurisdictionMember2021-12-310001592000us-gaap:SeriesBPreferredStockMemberenlc:EnLinkMidstreamPartnersLPMember2016-01-012016-01-310001592000us-gaap:SeriesBPreferredStockMemberenlc:EnLinkMidstreamPartnersLPMember2016-01-310001592000us-gaap:SeriesBPreferredStockMember2021-01-012021-12-310001592000us-gaap:SeriesBPreferredStockMemberus-gaap:LimitedPartnerMember2021-01-012021-12-310001592000us-gaap:SeriesBPreferredStockMemberenlc:EnLinkMidstreamPartnersLPMember2021-01-012021-12-310001592000us-gaap:SeriesBPreferredStockMemberenlc:EnLinkMidstreamPartnersLPMember2018-07-012018-09-300001592000us-gaap:SeriesBPreferredStockMemberus-gaap:LimitedPartnerMember2021-01-012021-03-310001592000us-gaap:SeriesBPreferredStockMemberus-gaap:LimitedPartnerMember2021-04-012021-06-300001592000us-gaap:SeriesBPreferredStockMemberus-gaap:LimitedPartnerMember2021-07-012021-09-300001592000us-gaap:SeriesBPreferredStockMemberus-gaap:LimitedPartnerMember2021-10-012021-12-310001592000us-gaap:SeriesBPreferredStockMemberus-gaap:LimitedPartnerMember2020-01-012020-03-310001592000us-gaap:SeriesBPreferredStockMemberus-gaap:LimitedPartnerMember2020-04-012020-06-300001592000us-gaap:SeriesBPreferredStockMemberus-gaap:LimitedPartnerMember2020-07-012020-09-300001592000us-gaap:SeriesBPreferredStockMemberus-gaap:LimitedPartnerMember2020-10-012020-12-310001592000us-gaap:SeriesBPreferredStockMemberus-gaap:LimitedPartnerMember2019-01-012019-03-310001592000us-gaap:SeriesBPreferredStockMemberus-gaap:LimitedPartnerMember2019-04-012019-06-300001592000us-gaap:SeriesBPreferredStockMemberus-gaap:LimitedPartnerMember2019-07-012019-09-300001592000us-gaap:SeriesBPreferredStockMemberus-gaap:LimitedPartnerMember2019-10-012019-12-310001592000us-gaap:SeriesBPreferredStockMemberus-gaap:LimitedPartnerMember2021-12-012021-12-310001592000us-gaap:SeriesBPreferredStockMemberus-gaap:LimitedPartnerMemberus-gaap:SubsequentEventMember2022-01-012022-01-310001592000us-gaap:SeriesBPreferredStockMemberus-gaap:LimitedPartnerMemberus-gaap:SubsequentEventMember2022-02-112022-02-110001592000enlc:EnLinkMidstreamPartnersLPMemberus-gaap:SeriesCPreferredStockMember2017-09-012017-09-300001592000enlc:EnLinkMidstreamPartnersLPMemberus-gaap:SeriesCPreferredStockMember2018-09-300001592000us-gaap:LondonInterbankOfferedRateLIBORMemberenlc:EnLinkMidstreamPartnersLPMemberus-gaap:SeriesCPreferredStockMember2017-09-012017-09-300001592000enlc:EnLinkMidstreamPartnersLPMemberus-gaap:SeriesCPreferredStockMember2020-01-012020-12-310001592000enlc:EnLinkMidstreamPartnersLPMemberus-gaap:SeriesCPreferredStockMember2019-01-012019-12-310001592000enlc:EnLinkMidstreamPartnersLPMemberus-gaap:SeriesCPreferredStockMember2021-01-012021-12-3100015920002020-11-3000015920002019-02-222019-02-220001592000enlc:CommonUnitMember2021-01-012021-12-310001592000enlc:CommonUnitMember2020-01-012020-12-310001592000enlc:CommonUnitMember2019-01-012019-12-310001592000us-gaap:RestrictedStockUnitsRSUMember2021-01-012021-12-310001592000us-gaap:RestrictedStockUnitsRSUMember2020-01-012020-12-310001592000us-gaap:RestrictedStockUnitsRSUMember2019-01-012019-12-3100015920002021-01-012021-03-3100015920002021-04-012021-06-3000015920002021-07-012021-09-3000015920002021-10-012021-12-3100015920002020-01-012020-03-3100015920002020-04-012020-06-3000015920002020-07-012020-09-3000015920002020-10-012020-12-3100015920002019-01-012019-03-3100015920002019-04-012019-06-3000015920002019-07-012019-09-3000015920002019-10-012019-12-310001592000enlc:GulfCoastFractionatorsMember2021-12-310001592000enlc:CedarCoveMidstreamLLCMember2021-12-310001592000enlc:GulfCoastFractionatorsMember2021-01-012021-12-310001592000enlc:GulfCoastFractionatorsMember2020-01-012020-12-310001592000enlc:GulfCoastFractionatorsMember2019-01-012019-12-310001592000enlc:CedarCoveMidstreamLLCMember2021-01-012021-12-310001592000enlc:CedarCoveMidstreamLLCMember2020-01-012020-12-310001592000enlc:CedarCoveMidstreamLLCMember2019-01-012019-12-310001592000enlc:CedarCoveMidstreamLLCMember2021-01-012021-12-310001592000enlc:EnLinkMidstreamPartnersLPMemberenlc:GulfCoastFractionatorsMember2021-12-310001592000enlc:EnLinkMidstreamPartnersLPMemberenlc:GulfCoastFractionatorsMember2020-12-310001592000enlc:CedarCoveMidstreamLLCMemberenlc:EnLinkMidstreamPartnersLPMember2021-12-310001592000enlc:CedarCoveMidstreamLLCMemberenlc:EnLinkMidstreamPartnersLPMember2020-12-310001592000us-gaap:OperatingExpenseMember2021-01-012021-12-310001592000us-gaap:OperatingExpenseMember2020-01-012020-12-310001592000us-gaap:OperatingExpenseMember2019-01-012019-12-310001592000us-gaap:GeneralAndAdministrativeExpenseMember2021-01-012021-12-310001592000us-gaap:GeneralAndAdministrativeExpenseMember2020-01-012020-12-310001592000us-gaap:GeneralAndAdministrativeExpenseMember2019-01-012019-12-310001592000us-gaap:RestrictedStockUnitsRSUMemberenlc:ENLCMember2020-12-310001592000us-gaap:RestrictedStockUnitsRSUMemberenlc:ENLCMember2021-01-012021-12-310001592000us-gaap:RestrictedStockUnitsRSUMemberenlc:ENLCMember2021-12-310001592000us-gaap:RestrictedStockUnitsRSUMemberenlc:ENLCMember2020-01-012020-12-310001592000us-gaap:RestrictedStockUnitsRSUMemberenlc:ENLCMember2019-01-012019-12-310001592000us-gaap:RestrictedStockUnitsRSUMember2021-12-310001592000us-gaap:PerformanceSharesMemberenlc:ENLCMembersrt:MinimumMember2021-01-012021-12-310001592000srt:MaximumMemberus-gaap:PerformanceSharesMemberenlc:ENLCMember2021-01-012021-12-310001592000enlc:TSRPerformanceUnitMemberenlc:BelowThresholdMember2021-12-310001592000enlc:TSRPerformanceUnitMemberenlc:ThresholdMember2021-12-310001592000enlc:TSRPerformanceUnitMemberenlc:TargetMember2021-12-310001592000enlc:TSRPerformanceUnitMemberenlc:MaximumPerformanceLevelMember2021-12-310001592000enlc:CashFlowPerformanceUnitMemberenlc:BelowThresholdMember2021-12-310001592000enlc:CashFlowPerformanceUnitMemberenlc:ThresholdMember2021-12-310001592000enlc:CashFlowPerformanceUnitMemberenlc:TargetMember2021-12-310001592000enlc:CashFlowPerformanceUnitMemberenlc:MaximumPerformanceLevelMember2021-12-310001592000enlc:CashFlowPerformanceUnitMemberenlc:BelowThresholdMember2020-01-012020-12-310001592000enlc:CashFlowPerformanceUnitMemberenlc:BelowThresholdMember2020-12-310001592000enlc:CashFlowPerformanceUnitMemberenlc:ThresholdMember2020-01-012020-12-310001592000enlc:CashFlowPerformanceUnitMemberenlc:ThresholdMember2020-12-310001592000enlc:CashFlowPerformanceUnitMemberenlc:TargetMember2020-01-012020-12-310001592000enlc:CashFlowPerformanceUnitMemberenlc:TargetMember2020-12-310001592000enlc:CashFlowPerformanceUnitMemberenlc:MaximumPerformanceLevelMember2020-01-012020-12-310001592000enlc:CashFlowPerformanceUnitMemberenlc:MaximumPerformanceLevelMember2020-12-310001592000enlc:CashFlowPerformanceUnitMemberenlc:BelowThresholdMember2019-01-012019-12-310001592000enlc:CashFlowPerformanceUnitMemberenlc:BelowThresholdMember2019-12-310001592000enlc:CashFlowPerformanceUnitMemberenlc:ThresholdMember2019-01-012019-12-310001592000enlc:CashFlowPerformanceUnitMemberenlc:ThresholdMember2019-12-310001592000enlc:CashFlowPerformanceUnitMemberenlc:TargetMember2019-01-012019-12-310001592000enlc:CashFlowPerformanceUnitMemberenlc:TargetMember2019-12-310001592000enlc:CashFlowPerformanceUnitMemberenlc:MaximumPerformanceLevelMember2019-01-012019-12-310001592000enlc:CashFlowPerformanceUnitMemberenlc:MaximumPerformanceLevelMember2019-12-310001592000us-gaap:PerformanceSharesMember2021-01-012021-12-310001592000us-gaap:PerformanceSharesMemberenlc:ENLCMember2021-01-310001592000us-gaap:PerformanceSharesMemberenlc:ENLCMember2021-07-310001592000us-gaap:PerformanceSharesMemberenlc:ENLCMember2020-03-310001592000us-gaap:PerformanceSharesMemberenlc:ENLCMember2020-01-310001592000us-gaap:PerformanceSharesMemberenlc:ENLCMember2019-10-310001592000us-gaap:PerformanceSharesMemberenlc:ENLCMember2019-06-300001592000us-gaap:PerformanceSharesMemberenlc:ENLCMember2019-03-310001592000us-gaap:PerformanceSharesMemberenlc:ENLCMember2021-01-012021-01-310001592000us-gaap:PerformanceSharesMemberenlc:ENLCMember2020-07-012020-07-310001592000us-gaap:PerformanceSharesMemberenlc:ENLCMember2020-03-012020-03-310001592000us-gaap:PerformanceSharesMemberenlc:ENLCMember2020-01-012020-01-310001592000us-gaap:PerformanceSharesMemberenlc:ENLCMember2019-10-012019-10-310001592000us-gaap:PerformanceSharesMemberenlc:ENLCMember2019-06-012019-06-300001592000us-gaap:PerformanceSharesMemberenlc:ENLCMember2019-03-012019-03-310001592000us-gaap:PerformanceSharesMember2020-12-310001592000us-gaap:PerformanceSharesMember2021-12-310001592000us-gaap:PerformanceSharesMemberenlc:ENLCMember2021-01-012021-12-310001592000us-gaap:PerformanceSharesMember2020-01-012020-12-310001592000us-gaap:PerformanceSharesMember2019-01-012019-12-310001592000enlc:EnLinkMidstreamPartnersLPMember2021-01-012021-12-310001592000enlc:EnLinkMidstreamPartnersLPMember2020-01-012020-12-310001592000enlc:EnLinkMidstreamPartnersLPMember2019-01-012019-12-310001592000us-gaap:InterestRateSwapMember2021-01-012021-12-310001592000us-gaap:InterestRateSwapMember2020-01-012020-12-310001592000us-gaap:InterestRateSwapMember2019-01-012019-12-310001592000us-gaap:InterestRateSwapMember2021-12-310001592000us-gaap:InterestRateSwapMember2020-12-310001592000enlc:EnLinkMidstreamPartnersLPMemberenlc:CommoditySwapMember2021-01-012021-12-310001592000enlc:EnLinkMidstreamPartnersLPMemberenlc:CommoditySwapMember2020-01-012020-12-310001592000enlc:EnLinkMidstreamPartnersLPMemberenlc:CommoditySwapMember2019-01-012019-12-310001592000enlc:EnLinkMidstreamPartnersLPMemberenlc:CommoditySwapMember2021-12-310001592000enlc:EnLinkMidstreamPartnersLPMemberenlc:CommoditySwapMember2020-12-310001592000enlc:EnLinkMidstreamPartnersLPMemberus-gaap:ShortMemberenlc:CommoditySwapMemberenlc:LiquidsMember2021-01-012021-12-31utr:gal0001592000enlc:EnLinkMidstreamPartnersLPMemberus-gaap:ShortMemberenlc:CommoditySwapMemberenlc:LiquidsMember2021-12-310001592000enlc:EnLinkMidstreamPartnersLPMemberus-gaap:LongMemberenlc:CommoditySwapMemberenlc:LiquidsMember2021-01-012021-12-310001592000enlc:EnLinkMidstreamPartnersLPMemberus-gaap:LongMemberenlc:CommoditySwapMemberenlc:LiquidsMember2021-12-310001592000enlc:EnLinkMidstreamPartnersLPMemberenlc:GasMemberus-gaap:ShortMemberenlc:CommoditySwapMember2021-01-012021-12-31utr:MMBTU0001592000enlc:EnLinkMidstreamPartnersLPMemberenlc:GasMemberus-gaap:ShortMemberenlc:CommoditySwapMember2021-12-310001592000enlc:EnLinkMidstreamPartnersLPMemberenlc:GasMemberus-gaap:LongMemberenlc:CommoditySwapMember2021-01-012021-12-310001592000enlc:EnLinkMidstreamPartnersLPMemberenlc:GasMemberus-gaap:LongMemberenlc:CommoditySwapMember2021-12-310001592000enlc:EnLinkMidstreamPartnersLPMemberenlc:CondensateMemberus-gaap:ShortMemberenlc:CommoditySwapMember2021-01-012021-12-310001592000enlc:EnLinkMidstreamPartnersLPMemberenlc:CondensateMemberus-gaap:ShortMemberenlc:CommoditySwapMember2021-12-310001592000enlc:EnLinkMidstreamPartnersLPMemberus-gaap:LongMemberenlc:CommoditySwapMemberenlc:CrudeandCondensateMember2021-01-012021-12-310001592000enlc:EnLinkMidstreamPartnersLPMemberus-gaap:LongMemberenlc:CommoditySwapMemberenlc:CrudeandCondensateMember2021-12-310001592000enlc:CommoditySwapMember2021-12-310001592000us-gaap:FairValueInputsLevel2Memberus-gaap:InterestRateSwapMemberus-gaap:FairValueMeasurementsRecurringMember2021-12-310001592000us-gaap:FairValueInputsLevel2Memberus-gaap:InterestRateSwapMemberus-gaap:FairValueMeasurementsRecurringMember2020-12-310001592000us-gaap:FairValueInputsLevel2Memberenlc:CommoditySwapMemberus-gaap:FairValueMeasurementsRecurringMember2021-12-310001592000us-gaap:FairValueInputsLevel2Memberenlc:CommoditySwapMemberus-gaap:FairValueMeasurementsRecurringMember2020-12-310001592000us-gaap:CarryingReportedAmountFairValueDisclosureMember2021-12-310001592000us-gaap:EstimateOfFairValueFairValueDisclosureMember2021-12-310001592000us-gaap:CarryingReportedAmountFairValueDisclosureMember2020-12-310001592000us-gaap:EstimateOfFairValueFairValueDisclosureMember2020-12-310001592000enlc:AmarilloRattlerLLCMember2021-12-310001592000enlc:KochMemberenlc:EnLinkGasMarketingLPMember2021-01-012021-12-310001592000enlc:PermianOperatingSegmentMemberenlc:NaturalGasMember2021-01-012021-12-310001592000enlc:LouisianaOperatingSegmentMemberenlc:NaturalGasMember2021-01-012021-12-310001592000enlc:NaturalGasMemberenlc:OklahomaOperatingSegmentMember2021-01-012021-12-310001592000enlc:NorthTexasOperatingSegmentMemberenlc:NaturalGasMember2021-01-012021-12-310001592000us-gaap:CorporateMemberenlc:NaturalGasMember2021-01-012021-12-310001592000enlc:NaturalGasMember2021-01-012021-12-310001592000enlc:NaturalGasLiquidsMemberenlc:PermianOperatingSegmentMember2021-01-012021-12-310001592000enlc:LouisianaOperatingSegmentMemberenlc:NaturalGasLiquidsMember2021-01-012021-12-310001592000enlc:NaturalGasLiquidsMemberenlc:OklahomaOperatingSegmentMember2021-01-012021-12-310001592000enlc:NaturalGasLiquidsMemberenlc:NorthTexasOperatingSegmentMember2021-01-012021-12-310001592000enlc:NaturalGasLiquidsMemberus-gaap:CorporateMember2021-01-012021-12-310001592000enlc:NaturalGasLiquidsMember2021-01-012021-12-310001592000enlc:PermianOperatingSegmentMemberenlc:CrudeOilAndCondensateMember2021-01-012021-12-310001592000enlc:LouisianaOperatingSegmentMemberenlc:CrudeOilAndCondensateMember2021-01-012021-12-310001592000enlc:OklahomaOperatingSegmentMemberenlc:CrudeOilAndCondensateMember2021-01-012021-12-310001592000enlc:NorthTexasOperatingSegmentMemberenlc:CrudeOilAndCondensateMember2021-01-012021-12-310001592000us-gaap:CorporateMemberenlc:CrudeOilAndCondensateMember2021-01-012021-12-310001592000enlc:CrudeOilAndCondensateMember2021-01-012021-12-310001592000us-gaap:ProductMemberenlc:PermianOperatingSegmentMember2021-01-012021-12-310001592000us-gaap:ProductMemberenlc:LouisianaOperatingSegmentMember2021-01-012021-12-310001592000us-gaap:ProductMemberenlc:OklahomaOperatingSegmentMember2021-01-012021-12-310001592000us-gaap:ProductMemberenlc:NorthTexasOperatingSegmentMember2021-01-012021-12-310001592000us-gaap:ProductMemberus-gaap:CorporateMember2021-01-012021-12-310001592000enlc:PermianOperatingSegmentMemberenlc:NaturalGasLiquidsRelatedPartyMember2021-01-012021-12-310001592000enlc:LouisianaOperatingSegmentMemberenlc:NaturalGasLiquidsRelatedPartyMember2021-01-012021-12-310001592000enlc:OklahomaOperatingSegmentMemberenlc:NaturalGasLiquidsRelatedPartyMember2021-01-012021-12-310001592000enlc:NorthTexasOperatingSegmentMemberenlc:NaturalGasLiquidsRelatedPartyMember2021-01-012021-12-310001592000us-gaap:CorporateMemberenlc:NaturalGasLiquidsRelatedPartyMember2021-01-012021-12-310001592000enlc:NaturalGasLiquidsRelatedPartyMember2021-01-012021-12-310001592000enlc:CrudeOilAndCondensateRelatedPartyMemberenlc:PermianOperatingSegmentMember2021-01-012021-12-310001592000enlc:LouisianaOperatingSegmentMemberenlc:CrudeOilAndCondensateRelatedPartyMember2021-01-012021-12-310001592000enlc:CrudeOilAndCondensateRelatedPartyMemberenlc:OklahomaOperatingSegmentMember2021-01-012021-12-310001592000enlc:CrudeOilAndCondensateRelatedPartyMemberenlc:NorthTexasOperatingSegmentMember2021-01-012021-12-310001592000enlc:CrudeOilAndCondensateRelatedPartyMemberus-gaap:CorporateMember2021-01-012021-12-310001592000enlc:CrudeOilAndCondensateRelatedPartyMember2021-01-012021-12-310001592000enlc:RelatedPartyMemberenlc:PermianOperatingSegmentMember2021-01-012021-12-310001592000enlc:LouisianaOperatingSegmentMemberenlc:RelatedPartyMember2021-01-012021-12-310001592000enlc:RelatedPartyMemberenlc:OklahomaOperatingSegmentMember2021-01-012021-12-310001592000enlc:RelatedPartyMemberenlc:NorthTexasOperatingSegmentMember2021-01-012021-12-310001592000enlc:RelatedPartyMemberus-gaap:CorporateMember2021-01-012021-12-310001592000enlc:RelatedPartyMember2021-01-012021-12-310001592000enlc:PermianOperatingSegmentMemberenlc:MidstreamServicesGatheringandTransportationMember2021-01-012021-12-310001592000enlc:LouisianaOperatingSegmentMemberenlc:MidstreamServicesGatheringandTransportationMember2021-01-012021-12-310001592000enlc:MidstreamServicesGatheringandTransportationMemberenlc:OklahomaOperatingSegmentMember2021-01-012021-12-310001592000enlc:NorthTexasOperatingSegmentMemberenlc:MidstreamServicesGatheringandTransportationMember2021-01-012021-12-310001592000enlc:MidstreamServicesGatheringandTransportationMemberus-gaap:CorporateMember2021-01-012021-12-310001592000enlc:MidstreamServicesGatheringandTransportationMember2021-01-012021-12-310001592000enlc:MidstreamServicesProcessingMemberenlc:PermianOperatingSegmentMember2021-01-012021-12-310001592000enlc:LouisianaOperatingSegmentMemberenlc:MidstreamServicesProcessingMember2021-01-012021-12-310001592000enlc:MidstreamServicesProcessingMemberenlc:OklahomaOperatingSegmentMember2021-01-012021-12-310001592000enlc:MidstreamServicesProcessingMemberenlc:NorthTexasOperatingSegmentMember2021-01-012021-12-310001592000enlc:MidstreamServicesProcessingMemberus-gaap:CorporateMember2021-01-012021-12-310001592000enlc:MidstreamServicesProcessingMember2021-01-012021-12-310001592000enlc:PermianOperatingSegmentMemberenlc:MidstreamServicesNGLServicesMember2021-01-012021-12-310001592000enlc:LouisianaOperatingSegmentMemberenlc:MidstreamServicesNGLServicesMember2021-01-012021-12-310001592000enlc:OklahomaOperatingSegmentMemberenlc:MidstreamServicesNGLServicesMember2021-01-012021-12-310001592000enlc:NorthTexasOperatingSegmentMemberenlc:MidstreamServicesNGLServicesMember2021-01-012021-12-310001592000us-gaap:CorporateMemberenlc:MidstreamServicesNGLServicesMember2021-01-012021-12-310001592000enlc:MidstreamServicesNGLServicesMember2021-01-012021-12-310001592000enlc:PermianOperatingSegmentMemberenlc:MidstreamServicesCrudeServicesMember2021-01-012021-12-310001592000enlc:LouisianaOperatingSegmentMemberenlc:MidstreamServicesCrudeServicesMember2021-01-012021-12-310001592000enlc:MidstreamServicesCrudeServicesMemberenlc:OklahomaOperatingSegmentMember2021-01-012021-12-310001592000enlc:NorthTexasOperatingSegmentMemberenlc:MidstreamServicesCrudeServicesMember2021-01-012021-12-310001592000us-gaap:CorporateMemberenlc:MidstreamServicesCrudeServicesMember2021-01-012021-12-310001592000enlc:MidstreamServicesCrudeServicesMember2021-01-012021-12-310001592000enlc:PermianOperatingSegmentMemberenlc:MidstreamServicesOtherServicesMember2021-01-012021-12-310001592000enlc:LouisianaOperatingSegmentMemberenlc:MidstreamServicesOtherServicesMember2021-01-012021-12-310001592000enlc:MidstreamServicesOtherServicesMemberenlc:OklahomaOperatingSegmentMember2021-01-012021-12-310001592000enlc:NorthTexasOperatingSegmentMemberenlc:MidstreamServicesOtherServicesMember2021-01-012021-12-310001592000us-gaap:CorporateMemberenlc:MidstreamServicesOtherServicesMember2021-01-012021-12-310001592000enlc:MidstreamServicesOtherServicesMember2021-01-012021-12-310001592000enlc:PermianOperatingSegmentMemberenlc:MidstreamServicesMember2021-01-012021-12-310001592000enlc:LouisianaOperatingSegmentMemberenlc:MidstreamServicesMember2021-01-012021-12-310001592000enlc:MidstreamServicesMemberenlc:OklahomaOperatingSegmentMember2021-01-012021-12-310001592000enlc:MidstreamServicesMemberenlc:NorthTexasOperatingSegmentMember2021-01-012021-12-310001592000enlc:MidstreamServicesMemberus-gaap:CorporateMember2021-01-012021-12-310001592000enlc:MidstreamServicesMember2021-01-012021-12-310001592000enlc:PermianOperatingSegmentMemberenlc:MidstreamServicesCrudeServicesRelatedPartyMember2021-01-012021-12-310001592000enlc:LouisianaOperatingSegmentMemberenlc:MidstreamServicesCrudeServicesRelatedPartyMember2021-01-012021-12-310001592000enlc:OklahomaOperatingSegmentMemberenlc:MidstreamServicesCrudeServicesRelatedPartyMember2021-01-012021-12-310001592000enlc:NorthTexasOperatingSegmentMemberenlc:MidstreamServicesCrudeServicesRelatedPartyMember2021-01-012021-12-310001592000us-gaap:CorporateMemberenlc:MidstreamServicesCrudeServicesRelatedPartyMember2021-01-012021-12-310001592000enlc:MidstreamServicesCrudeServicesRelatedPartyMember2021-01-012021-12-310001592000enlc:PermianOperatingSegmentMemberenlc:MidstreamServicesOtherServicesRelatedPartyMember2021-01-012021-12-310001592000enlc:LouisianaOperatingSegmentMemberenlc:MidstreamServicesOtherServicesRelatedPartyMember2021-01-012021-12-310001592000enlc:MidstreamServicesOtherServicesRelatedPartyMemberenlc:OklahomaOperatingSegmentMember2021-01-012021-12-310001592000enlc:NorthTexasOperatingSegmentMemberenlc:MidstreamServicesOtherServicesRelatedPartyMember2021-01-012021-12-310001592000us-gaap:CorporateMemberenlc:MidstreamServicesOtherServicesRelatedPartyMember2021-01-012021-12-310001592000enlc:MidstreamServicesOtherServicesRelatedPartyMember2021-01-012021-12-310001592000enlc:MidstreamServicesRelatedPartyMemberenlc:PermianOperatingSegmentMember2021-01-012021-12-310001592000enlc:LouisianaOperatingSegmentMemberenlc:MidstreamServicesRelatedPartyMember2021-01-012021-12-310001592000enlc:MidstreamServicesRelatedPartyMemberenlc:OklahomaOperatingSegmentMember2021-01-012021-12-310001592000enlc:MidstreamServicesRelatedPartyMemberenlc:NorthTexasOperatingSegmentMember2021-01-012021-12-310001592000enlc:MidstreamServicesRelatedPartyMemberus-gaap:CorporateMember2021-01-012021-12-310001592000enlc:MidstreamServicesRelatedPartyMember2021-01-012021-12-310001592000enlc:PermianOperatingSegmentMember2021-01-012021-12-310001592000enlc:NorthTexasOperatingSegmentMember2021-01-012021-12-310001592000us-gaap:CorporateMember2021-01-012021-12-310001592000enlc:PermianOperatingSegmentMemberenlc:NaturalGasMember2020-01-012020-12-310001592000enlc:LouisianaOperatingSegmentMemberenlc:NaturalGasMember2020-01-012020-12-310001592000enlc:NaturalGasMemberenlc:OklahomaOperatingSegmentMember2020-01-012020-12-310001592000enlc:NorthTexasOperatingSegmentMemberenlc:NaturalGasMember2020-01-012020-12-310001592000us-gaap:CorporateMemberenlc:NaturalGasMember2020-01-012020-12-310001592000enlc:NaturalGasMember2020-01-012020-12-310001592000enlc:NaturalGasLiquidsMemberenlc:PermianOperatingSegmentMember2020-01-012020-12-310001592000enlc:LouisianaOperatingSegmentMemberenlc:NaturalGasLiquidsMember2020-01-012020-12-310001592000enlc:NaturalGasLiquidsMemberenlc:OklahomaOperatingSegmentMember2020-01-012020-12-310001592000enlc:NaturalGasLiquidsMemberenlc:NorthTexasOperatingSegmentMember2020-01-012020-12-310001592000enlc:NaturalGasLiquidsMemberus-gaap:CorporateMember2020-01-012020-12-310001592000enlc:NaturalGasLiquidsMember2020-01-012020-12-310001592000enlc:PermianOperatingSegmentMemberenlc:CrudeOilAndCondensateMember2020-01-012020-12-310001592000enlc:LouisianaOperatingSegmentMemberenlc:CrudeOilAndCondensateMember2020-01-012020-12-310001592000enlc:OklahomaOperatingSegmentMemberenlc:CrudeOilAndCondensateMember2020-01-012020-12-310001592000enlc:NorthTexasOperatingSegmentMemberenlc:CrudeOilAndCondensateMember2020-01-012020-12-310001592000us-gaap:CorporateMemberenlc:CrudeOilAndCondensateMember2020-01-012020-12-310001592000enlc:CrudeOilAndCondensateMember2020-01-012020-12-310001592000us-gaap:ProductMemberenlc:PermianOperatingSegmentMember2020-01-012020-12-310001592000us-gaap:ProductMemberenlc:LouisianaOperatingSegmentMember2020-01-012020-12-310001592000us-gaap:ProductMemberenlc:OklahomaOperatingSegmentMember2020-01-012020-12-310001592000us-gaap:ProductMemberenlc:NorthTexasOperatingSegmentMember2020-01-012020-12-310001592000us-gaap:ProductMemberus-gaap:CorporateMember2020-01-012020-12-310001592000enlc:PermianOperatingSegmentMemberenlc:NaturalGasLiquidsRelatedPartyMember2020-01-012020-12-310001592000enlc:LouisianaOperatingSegmentMemberenlc:NaturalGasLiquidsRelatedPartyMember2020-01-012020-12-310001592000enlc:OklahomaOperatingSegmentMemberenlc:NaturalGasLiquidsRelatedPartyMember2020-01-012020-12-310001592000enlc:NorthTexasOperatingSegmentMemberenlc:NaturalGasLiquidsRelatedPartyMember2020-01-012020-12-310001592000us-gaap:CorporateMemberenlc:NaturalGasLiquidsRelatedPartyMember2020-01-012020-12-310001592000enlc:NaturalGasLiquidsRelatedPartyMember2020-01-012020-12-310001592000enlc:CrudeOilAndCondensateRelatedPartyMemberenlc:PermianOperatingSegmentMember2020-01-012020-12-310001592000enlc:LouisianaOperatingSegmentMemberenlc:CrudeOilAndCondensateRelatedPartyMember2020-01-012020-12-310001592000enlc:CrudeOilAndCondensateRelatedPartyMemberenlc:OklahomaOperatingSegmentMember2020-01-012020-12-310001592000enlc:CrudeOilAndCondensateRelatedPartyMemberenlc:NorthTexasOperatingSegmentMember2020-01-012020-12-310001592000enlc:CrudeOilAndCondensateRelatedPartyMemberus-gaap:CorporateMember2020-01-012020-12-310001592000enlc:CrudeOilAndCondensateRelatedPartyMember2020-01-012020-12-310001592000enlc:RelatedPartyMemberenlc:PermianOperatingSegmentMember2020-01-012020-12-310001592000enlc:LouisianaOperatingSegmentMemberenlc:RelatedPartyMember2020-01-012020-12-310001592000enlc:RelatedPartyMemberenlc:OklahomaOperatingSegmentMember2020-01-012020-12-310001592000enlc:RelatedPartyMemberenlc:NorthTexasOperatingSegmentMember2020-01-012020-12-310001592000enlc:RelatedPartyMemberus-gaap:CorporateMember2020-01-012020-12-310001592000enlc:RelatedPartyMember2020-01-012020-12-310001592000enlc:PermianOperatingSegmentMemberenlc:MidstreamServicesGatheringandTransportationMember2020-01-012020-12-310001592000enlc:LouisianaOperatingSegmentMemberenlc:MidstreamServicesGatheringandTransportationMember2020-01-012020-12-310001592000enlc:MidstreamServicesGatheringandTransportationMemberenlc:OklahomaOperatingSegmentMember2020-01-012020-12-310001592000enlc:NorthTexasOperatingSegmentMemberenlc:MidstreamServicesGatheringandTransportationMember2020-01-012020-12-310001592000enlc:MidstreamServicesGatheringandTransportationMemberus-gaap:CorporateMember2020-01-012020-12-310001592000enlc:MidstreamServicesGatheringandTransportationMember2020-01-012020-12-310001592000enlc:MidstreamServicesProcessingMemberenlc:PermianOperatingSegmentMember2020-01-012020-12-310001592000enlc:LouisianaOperatingSegmentMemberenlc:MidstreamServicesProcessingMember2020-01-012020-12-310001592000enlc:MidstreamServicesProcessingMemberenlc:OklahomaOperatingSegmentMember2020-01-012020-12-310001592000enlc:MidstreamServicesProcessingMemberenlc:NorthTexasOperatingSegmentMember2020-01-012020-12-310001592000enlc:MidstreamServicesProcessingMemberus-gaap:CorporateMember2020-01-012020-12-310001592000enlc:MidstreamServicesProcessingMember2020-01-012020-12-310001592000enlc:PermianOperatingSegmentMemberenlc:MidstreamServicesNGLServicesMember2020-01-012020-12-310001592000enlc:LouisianaOperatingSegmentMemberenlc:MidstreamServicesNGLServicesMember2020-01-012020-12-310001592000enlc:OklahomaOperatingSegmentMemberenlc:MidstreamServicesNGLServicesMember2020-01-012020-12-310001592000enlc:NorthTexasOperatingSegmentMemberenlc:MidstreamServicesNGLServicesMember2020-01-012020-12-310001592000us-gaap:CorporateMemberenlc:MidstreamServicesNGLServicesMember2020-01-012020-12-310001592000enlc:MidstreamServicesNGLServicesMember2020-01-012020-12-310001592000enlc:PermianOperatingSegmentMemberenlc:MidstreamServicesCrudeServicesMember2020-01-012020-12-310001592000enlc:LouisianaOperatingSegmentMemberenlc:MidstreamServicesCrudeServicesMember2020-01-012020-12-310001592000enlc:MidstreamServicesCrudeServicesMemberenlc:OklahomaOperatingSegmentMember2020-01-012020-12-310001592000enlc:NorthTexasOperatingSegmentMemberenlc:MidstreamServicesCrudeServicesMember2020-01-012020-12-310001592000us-gaap:CorporateMemberenlc:MidstreamServicesCrudeServicesMember2020-01-012020-12-310001592000enlc:MidstreamServicesCrudeServicesMember2020-01-012020-12-310001592000enlc:PermianOperatingSegmentMemberenlc:MidstreamServicesOtherServicesMember2020-01-012020-12-310001592000enlc:LouisianaOperatingSegmentMemberenlc:MidstreamServicesOtherServicesMember2020-01-012020-12-310001592000enlc:MidstreamServicesOtherServicesMemberenlc:OklahomaOperatingSegmentMember2020-01-012020-12-310001592000enlc:NorthTexasOperatingSegmentMemberenlc:MidstreamServicesOtherServicesMember2020-01-012020-12-310001592000us-gaap:CorporateMemberenlc:MidstreamServicesOtherServicesMember2020-01-012020-12-310001592000enlc:MidstreamServicesOtherServicesMember2020-01-012020-12-310001592000enlc:PermianOperatingSegmentMemberenlc:MidstreamServicesMember2020-01-012020-12-310001592000enlc:LouisianaOperatingSegmentMemberenlc:MidstreamServicesMember2020-01-012020-12-310001592000enlc:MidstreamServicesMemberenlc:OklahomaOperatingSegmentMember2020-01-012020-12-310001592000enlc:MidstreamServicesMemberenlc:NorthTexasOperatingSegmentMember2020-01-012020-12-310001592000enlc:MidstreamServicesMemberus-gaap:CorporateMember2020-01-012020-12-310001592000enlc:MidstreamServicesMember2020-01-012020-12-310001592000enlc:PermianOperatingSegmentMemberenlc:MidstreamServicesCrudeServicesRelatedPartyMember2020-01-012020-12-310001592000enlc:LouisianaOperatingSegmentMemberenlc:MidstreamServicesCrudeServicesRelatedPartyMember2020-01-012020-12-310001592000enlc:OklahomaOperatingSegmentMemberenlc:MidstreamServicesCrudeServicesRelatedPartyMember2020-01-012020-12-310001592000enlc:NorthTexasOperatingSegmentMemberenlc:MidstreamServicesCrudeServicesRelatedPartyMember2020-01-012020-12-310001592000us-gaap:CorporateMemberenlc:MidstreamServicesCrudeServicesRelatedPartyMember2020-01-012020-12-310001592000enlc:MidstreamServicesCrudeServicesRelatedPartyMember2020-01-012020-12-310001592000enlc:MidstreamServicesRelatedPartyMemberenlc:PermianOperatingSegmentMember2020-01-012020-12-310001592000enlc:LouisianaOperatingSegmentMemberenlc:MidstreamServicesRelatedPartyMember2020-01-012020-12-310001592000enlc:MidstreamServicesRelatedPartyMemberenlc:OklahomaOperatingSegmentMember2020-01-012020-12-310001592000enlc:MidstreamServicesRelatedPartyMemberenlc:NorthTexasOperatingSegmentMember2020-01-012020-12-310001592000enlc:MidstreamServicesRelatedPartyMemberus-gaap:CorporateMember2020-01-012020-12-310001592000enlc:MidstreamServicesRelatedPartyMember2020-01-012020-12-310001592000enlc:PermianOperatingSegmentMember2020-01-012020-12-310001592000enlc:OklahomaOperatingSegmentMember2020-01-012020-12-310001592000enlc:NorthTexasOperatingSegmentMember2020-01-012020-12-310001592000us-gaap:CorporateMember2020-01-012020-12-310001592000enlc:PermianOperatingSegmentMemberenlc:NaturalGasMember2019-01-012019-12-310001592000enlc:LouisianaOperatingSegmentMemberenlc:NaturalGasMember2019-01-012019-12-310001592000enlc:NaturalGasMemberenlc:OklahomaOperatingSegmentMember2019-01-012019-12-310001592000enlc:NorthTexasOperatingSegmentMemberenlc:NaturalGasMember2019-01-012019-12-310001592000us-gaap:CorporateMemberenlc:NaturalGasMember2019-01-012019-12-310001592000enlc:NaturalGasMember2019-01-012019-12-310001592000enlc:NaturalGasLiquidsMemberenlc:PermianOperatingSegmentMember2019-01-012019-12-310001592000enlc:LouisianaOperatingSegmentMemberenlc:NaturalGasLiquidsMember2019-01-012019-12-310001592000enlc:NaturalGasLiquidsMemberenlc:OklahomaOperatingSegmentMember2019-01-012019-12-310001592000enlc:NaturalGasLiquidsMemberenlc:NorthTexasOperatingSegmentMember2019-01-012019-12-310001592000enlc:NaturalGasLiquidsMemberus-gaap:CorporateMember2019-01-012019-12-310001592000enlc:NaturalGasLiquidsMember2019-01-012019-12-310001592000enlc:PermianOperatingSegmentMemberenlc:CrudeOilAndCondensateMember2019-01-012019-12-310001592000enlc:LouisianaOperatingSegmentMemberenlc:CrudeOilAndCondensateMember2019-01-012019-12-310001592000enlc:OklahomaOperatingSegmentMemberenlc:CrudeOilAndCondensateMember2019-01-012019-12-310001592000enlc:NorthTexasOperatingSegmentMemberenlc:CrudeOilAndCondensateMember2019-01-012019-12-310001592000us-gaap:CorporateMemberenlc:CrudeOilAndCondensateMember2019-01-012019-12-310001592000enlc:CrudeOilAndCondensateMember2019-01-012019-12-310001592000us-gaap:ProductMemberenlc:PermianOperatingSegmentMember2019-01-012019-12-310001592000us-gaap:ProductMemberenlc:LouisianaOperatingSegmentMember2019-01-012019-12-310001592000us-gaap:ProductMemberenlc:OklahomaOperatingSegmentMember2019-01-012019-12-310001592000us-gaap:ProductMemberenlc:NorthTexasOperatingSegmentMember2019-01-012019-12-310001592000us-gaap:ProductMemberus-gaap:CorporateMember2019-01-012019-12-310001592000enlc:NaturalGasRelatedPartyMemberenlc:PermianOperatingSegmentMember2019-01-012019-12-310001592000enlc:LouisianaOperatingSegmentMemberenlc:NaturalGasRelatedPartyMember2019-01-012019-12-310001592000enlc:NaturalGasRelatedPartyMemberenlc:OklahomaOperatingSegmentMember2019-01-012019-12-310001592000enlc:NaturalGasRelatedPartyMemberenlc:NorthTexasOperatingSegmentMember2019-01-012019-12-310001592000enlc:NaturalGasRelatedPartyMemberus-gaap:CorporateMember2019-01-012019-12-310001592000enlc:NaturalGasRelatedPartyMember2019-01-012019-12-310001592000enlc:PermianOperatingSegmentMemberenlc:NaturalGasLiquidsRelatedPartyMember2019-01-012019-12-310001592000enlc:LouisianaOperatingSegmentMemberenlc:NaturalGasLiquidsRelatedPartyMember2019-01-012019-12-310001592000enlc:OklahomaOperatingSegmentMemberenlc:NaturalGasLiquidsRelatedPartyMember2019-01-012019-12-310001592000enlc:NorthTexasOperatingSegmentMemberenlc:NaturalGasLiquidsRelatedPartyMember2019-01-012019-12-310001592000us-gaap:CorporateMemberenlc:NaturalGasLiquidsRelatedPartyMember2019-01-012019-12-310001592000enlc:NaturalGasLiquidsRelatedPartyMember2019-01-012019-12-310001592000enlc:CrudeOilAndCondensateRelatedPartyMemberenlc:PermianOperatingSegmentMember2019-01-012019-12-310001592000enlc:LouisianaOperatingSegmentMemberenlc:CrudeOilAndCondensateRelatedPartyMember2019-01-012019-12-310001592000enlc:CrudeOilAndCondensateRelatedPartyMemberenlc:OklahomaOperatingSegmentMember2019-01-012019-12-310001592000enlc:CrudeOilAndCondensateRelatedPartyMemberenlc:NorthTexasOperatingSegmentMember2019-01-012019-12-310001592000enlc:CrudeOilAndCondensateRelatedPartyMemberus-gaap:CorporateMember2019-01-012019-12-310001592000enlc:CrudeOilAndCondensateRelatedPartyMember2019-01-012019-12-310001592000enlc:RelatedPartyMemberenlc:PermianOperatingSegmentMember2019-01-012019-12-310001592000enlc:LouisianaOperatingSegmentMemberenlc:RelatedPartyMember2019-01-012019-12-310001592000enlc:RelatedPartyMemberenlc:OklahomaOperatingSegmentMember2019-01-012019-12-310001592000enlc:RelatedPartyMemberenlc:NorthTexasOperatingSegmentMember2019-01-012019-12-310001592000enlc:RelatedPartyMemberus-gaap:CorporateMember2019-01-012019-12-310001592000enlc:RelatedPartyMember2019-01-012019-12-310001592000enlc:PermianOperatingSegmentMemberenlc:MidstreamServicesGatheringandTransportationMember2019-01-012019-12-310001592000enlc:LouisianaOperatingSegmentMemberenlc:MidstreamServicesGatheringandTransportationMember2019-01-012019-12-310001592000enlc:MidstreamServicesGatheringandTransportationMemberenlc:OklahomaOperatingSegmentMember2019-01-012019-12-310001592000enlc:NorthTexasOperatingSegmentMemberenlc:MidstreamServicesGatheringandTransportationMember2019-01-012019-12-310001592000enlc:MidstreamServicesGatheringandTransportationMemberus-gaap:CorporateMember2019-01-012019-12-310001592000enlc:MidstreamServicesGatheringandTransportationMember2019-01-012019-12-310001592000enlc:MidstreamServicesProcessingMemberenlc:PermianOperatingSegmentMember2019-01-012019-12-310001592000enlc:LouisianaOperatingSegmentMemberenlc:MidstreamServicesProcessingMember2019-01-012019-12-310001592000enlc:MidstreamServicesProcessingMemberenlc:OklahomaOperatingSegmentMember2019-01-012019-12-310001592000enlc:MidstreamServicesProcessingMemberenlc:NorthTexasOperatingSegmentMember2019-01-012019-12-310001592000enlc:MidstreamServicesProcessingMemberus-gaap:CorporateMember2019-01-012019-12-310001592000enlc:MidstreamServicesProcessingMember2019-01-012019-12-310001592000enlc:PermianOperatingSegmentMemberenlc:MidstreamServicesNGLServicesMember2019-01-012019-12-310001592000enlc:LouisianaOperatingSegmentMemberenlc:MidstreamServicesNGLServicesMember2019-01-012019-12-310001592000enlc:OklahomaOperatingSegmentMemberenlc:MidstreamServicesNGLServicesMember2019-01-012019-12-310001592000enlc:NorthTexasOperatingSegmentMemberenlc:MidstreamServicesNGLServicesMember2019-01-012019-12-310001592000us-gaap:CorporateMemberenlc:MidstreamServicesNGLServicesMember2019-01-012019-12-310001592000enlc:MidstreamServicesNGLServicesMember2019-01-012019-12-310001592000enlc:PermianOperatingSegmentMemberenlc:MidstreamServicesCrudeServicesMember2019-01-012019-12-310001592000enlc:LouisianaOperatingSegmentMemberenlc:MidstreamServicesCrudeServicesMember2019-01-012019-12-310001592000enlc:MidstreamServicesCrudeServicesMemberenlc:OklahomaOperatingSegmentMember2019-01-012019-12-310001592000enlc:NorthTexasOperatingSegmentMemberenlc:MidstreamServicesCrudeServicesMember2019-01-012019-12-310001592000us-gaap:CorporateMemberenlc:MidstreamServicesCrudeServicesMember2019-01-012019-12-310001592000enlc:MidstreamServicesCrudeServicesMember2019-01-012019-12-310001592000enlc:PermianOperatingSegmentMemberenlc:MidstreamServicesOtherServicesMember2019-01-012019-12-310001592000enlc:LouisianaOperatingSegmentMemberenlc:MidstreamServicesOtherServicesMember2019-01-012019-12-310001592000enlc:MidstreamServicesOtherServicesMemberenlc:OklahomaOperatingSegmentMember2019-01-012019-12-310001592000enlc:NorthTexasOperatingSegmentMemberenlc:MidstreamServicesOtherServicesMember2019-01-012019-12-310001592000us-gaap:CorporateMemberenlc:MidstreamServicesOtherServicesMember2019-01-012019-12-310001592000enlc:MidstreamServicesOtherServicesMember2019-01-012019-12-310001592000enlc:PermianOperatingSegmentMemberenlc:MidstreamServicesMember2019-01-012019-12-310001592000enlc:LouisianaOperatingSegmentMemberenlc:MidstreamServicesMember2019-01-012019-12-310001592000enlc:MidstreamServicesMemberenlc:OklahomaOperatingSegmentMember2019-01-012019-12-310001592000enlc:MidstreamServicesMemberenlc:NorthTexasOperatingSegmentMember2019-01-012019-12-310001592000enlc:MidstreamServicesMemberus-gaap:CorporateMember2019-01-012019-12-310001592000enlc:MidstreamServicesMember2019-01-012019-12-310001592000enlc:PermianOperatingSegmentMemberenlc:MidstreamServicesNGLServicesRelatedPartyMember2019-01-012019-12-310001592000enlc:LouisianaOperatingSegmentMemberenlc:MidstreamServicesNGLServicesRelatedPartyMember2019-01-012019-12-310001592000enlc:MidstreamServicesNGLServicesRelatedPartyMemberenlc:OklahomaOperatingSegmentMember2019-01-012019-12-310001592000enlc:NorthTexasOperatingSegmentMemberenlc:MidstreamServicesNGLServicesRelatedPartyMember2019-01-012019-12-310001592000enlc:MidstreamServicesNGLServicesRelatedPartyMemberus-gaap:CorporateMember2019-01-012019-12-310001592000enlc:MidstreamServicesNGLServicesRelatedPartyMember2019-01-012019-12-310001592000enlc:PermianOperatingSegmentMemberenlc:MidstreamServicesCrudeServicesRelatedPartyMember2019-01-012019-12-310001592000enlc:LouisianaOperatingSegmentMemberenlc:MidstreamServicesCrudeServicesRelatedPartyMember2019-01-012019-12-310001592000enlc:OklahomaOperatingSegmentMemberenlc:MidstreamServicesCrudeServicesRelatedPartyMember2019-01-012019-12-310001592000enlc:NorthTexasOperatingSegmentMemberenlc:MidstreamServicesCrudeServicesRelatedPartyMember2019-01-012019-12-310001592000us-gaap:CorporateMemberenlc:MidstreamServicesCrudeServicesRelatedPartyMember2019-01-012019-12-310001592000enlc:MidstreamServicesCrudeServicesRelatedPartyMember2019-01-012019-12-310001592000enlc:MidstreamServicesRelatedPartyMemberenlc:PermianOperatingSegmentMember2019-01-012019-12-310001592000enlc:LouisianaOperatingSegmentMemberenlc:MidstreamServicesRelatedPartyMember2019-01-012019-12-310001592000enlc:MidstreamServicesRelatedPartyMemberenlc:OklahomaOperatingSegmentMember2019-01-012019-12-310001592000enlc:MidstreamServicesRelatedPartyMemberenlc:NorthTexasOperatingSegmentMember2019-01-012019-12-310001592000enlc:MidstreamServicesRelatedPartyMemberus-gaap:CorporateMember2019-01-012019-12-310001592000enlc:MidstreamServicesRelatedPartyMember2019-01-012019-12-310001592000enlc:PermianOperatingSegmentMember2019-01-012019-12-310001592000enlc:LouisianaOperatingSegmentMember2019-01-012019-12-310001592000enlc:OklahomaOperatingSegmentMember2019-01-012019-12-310001592000enlc:NorthTexasOperatingSegmentMember2019-01-012019-12-310001592000us-gaap:CorporateMember2019-01-012019-12-310001592000enlc:PermianOperatingSegmentMember2021-12-310001592000enlc:PermianOperatingSegmentMember2020-12-310001592000enlc:LouisianaOperatingSegmentMember2021-12-310001592000enlc:LouisianaOperatingSegmentMember2020-12-310001592000enlc:OklahomaOperatingSegmentMember2021-12-310001592000enlc:OklahomaOperatingSegmentMember2020-12-310001592000enlc:NorthTexasOperatingSegmentMember2021-12-310001592000enlc:NorthTexasOperatingSegmentMember2020-12-310001592000us-gaap:CorporateMember2021-12-310001592000us-gaap:CorporateMember2020-12-310001592000us-gaap:SeriesBPreferredStockMemberus-gaap:SubsequentEventMember2022-01-012022-01-31
UNITED STATES
SECURITIES AND EXCHANGE COMMISSION
Washington, D.C. 20549
Form 10-K
☒ ANNUAL REPORT PURSUANT TO SECTION 13 or 15(d) OF THE SECURITIES EXCHANGE ACT OF 1934
For the fiscal year ended December 31, 2021
OR
☐ TRANSITION REPORT PURSUANT TO SECTION 13 OR 15(d) OF THE SECURITIES EXCHANGE ACT OF 1934
For the transition period from to
Commission file number: 001-36336
ENLINK MIDSTREAM, LLC
(Exact name of registrant as specified in its charter)
| | | | | | | | |
| Delaware | 46-4108528 |
| (State of organization) | (I.R.S. Employer Identification No.) |
| | |
| 1722 Routh St., | Suite 1300 | |
| Dallas, | Texas | 75201 |
| (Address of principal executive offices) | (Zip Code) |
(214) 953-9500
(Registrant’s telephone number, including area code)
SECURITIES REGISTERED PURSUANT TO SECTION 12(b) OF THE ACT:
| | | | | | | | | | | | | | |
| Title of Each Class | | Trading Symbol | | Name of Exchange on which Registered |
Common Units Representing Limited
Liability Company Interests
| | ENLC | | The New York Stock Exchange |
| | | |
Securities registered pursuant to Section 12(g) of the Act: None.
Indicate by check mark if registrant is a well-known seasoned issuer, as defined in Rule 405 of the Securities Act. Yes ☒ No ☐
Indicate by check mark if registrant is not required to file reports pursuant to Section 13 or Section 15(d) of the Act. Yes ☐ No ☒
Indicate by check mark whether registrant (1) has filed all reports required to be filed by Section 13 or 15(d) of the Securities Exchange Act of 1934 during the preceding 12 months (or for such shorter period that the registrant was required to file such reports), and (2) has been subject to such filing requirements for the past 90 days. Yes ☒ No ☐
Indicate by check mark whether the registrant has submitted electronically every Interactive Data File required to be submitted pursuant to Rule 405 of Regulation S-T (§ 232.405 of this chapter) during the preceding 12 months (or for such shorter period that the registrant was required to submit such files). Yes ☒ No ☐
Indicate by check mark whether the registrant is a large accelerated filer, an accelerated filer, a non-accelerated filer, a smaller reporting company, or an emerging growth company. See the definitions of “large accelerated filer,” “accelerated filer,” “smaller reporting company,” and “emerging growth company” in Rule 12b-2 of the Securities Exchange Act. (Check one):
| | | | | | | | | | | | | | |
| Large accelerated filer | ☒ | | Accelerated filer | ☐ |
Non-accelerated filer | ☐ | | Smaller reporting company | ☐ |
| Emerging growth company | ☐ | | | ☐ |
If an emerging growth company, indicate by check mark if the registrant has elected not to use the extended transition period for complying with any new or revised financial accounting standards provided pursuant to Section 13(a) of the Exchange Act. ☐
Indicate by check mark whether the registrant has filed a report on and attestation to its management’s assessment of the effectiveness of its internal control over financial reporting under Section 404(b) of the Sarbanes-Oxley Act (15 U.S.C. 7262(b)) by the registered public accounting firm that prepared or issued its audit report. ☒
Indicate by check mark whether the registrant is a shell company (as defined in Rule 12b-2 of the Act). Yes ☐ No ☒
The aggregate market value of the common units representing limited liability company interests held by non-affiliates of the registrant was approximately $1.7 billion on June 30, 2021, based on $6.39 per unit, the closing price of the common units as reported on the New York Stock Exchange on such date.
At February 9, 2022, there were 484,003,750 common units outstanding.
DOCUMENTS INCORPORATED BY REFERENCE:
None.
TABLE OF CONTENTS
| | | | | | | | | | | | | | |
| Item | | Description | | Page |
| | | | |
| | PART I | | |
| 1. | | | | |
| 1A. | | | | |
| 1B. | | | | |
| 2. | | | | |
| 3. | | | | |
| 4. | | | | |
| | | | |
| | PART II | | |
| 5. | | | | |
| 6. | | | | |
| 7. | | | | |
| 7A. | | | | |
| 8. | | | | |
| 9. | | | | |
| 9A. | | | | |
| 9B. | | | | |
| | | | |
| | PART III | | |
| 10. | | | | |
| 11. | | | | |
| 12. | | | | |
| 13. | | | | |
| 14. | | | | |
| | | | |
| | PART IV | | |
| 15. | | | | |
DEFINITIONS
The following terms as defined are used in this document:
| | | | | | | | |
| Defined Term | | Definition |
| /d | | Per day. |
| | |
| 2014 Plan | | ENLC’s 2014 Long-Term Incentive Plan. |
| | |
| | |
| Adjusted gross margin | | Revenue less cost of sales, exclusive of operating expenses and depreciation and amortization. Adjusted gross margin is a non-GAAP financial measure. See “Item 7. Management’s Discussion and Analysis of Financial Condition and Results of Operations—Non-GAAP Financial Measures” for additional information. |
| AR Facility | | An accounts receivable securitization facility of up to $350 million entered into by EnLink Midstream Funding, LLC, a bankruptcy-remote special purpose entity and our indirect subsidiary, with PNC Bank, National Association, as administrative agent and lender, and PNC Capital Markets, LLC, as structuring agent and sustainability agent. The AR Facility is scheduled to terminate on September 24, 2024, unless extended or earlier terminated in accordance with its terms. |
| ASC | | The Financial Accounting Standards Board (“FASB”) Accounting Standards Codification. |
| ASC 606 | | ASC 606, Revenue from Contracts with Customers. |
| ASC 718 | | ASC 718, Compensation—Stock Compensation. |
| ASC 815 | | ASC 815, Derivatives and Hedging. |
| ASC 820 | | ASC 820, Fair Value Measurements. |
| ASC 842 | | ASC 842, Leases. |
| Ascension JV | | Ascension Pipeline Company, LLC, a joint venture between a subsidiary of ENLK and a subsidiary of Marathon Petroleum Corporation in which ENLK owns a 50% interest and Marathon Petroleum Corporation owns a 50% interest. The Ascension JV, which began operations in April 2017, owns an NGL pipeline that connects ENLK’s Riverside fractionator to Marathon Petroleum Corporation’s Garyville refinery. |
| | |
| Avenger | | Avenger crude oil gathering system, a crude oil gathering system in the northern Delaware Basin. |
| Bbls | | Barrels. |
| Bcf | | Billion cubic feet. |
| | |
| Beginning TSR Price | | The beginning total shareholder return (“TSR”) price, which is the closing unit price of ENLC on the grant date of the performance award agreement or the previous trading day if the grant date was not a trading day, is one of the assumptions used to calculate the grant-date fair value of performance award agreements. |
| BLM | | Bureau of Land Management. |
| BKV | | Banpu Kalnin Ventures Corporation, an affiliate of BKV Oil and Gas Capital Partners. |
| CCS | | Carbon capture, transportation, and sequestration. |
| Cedar Cove JV | | Cedar Cove Midstream LLC, a joint venture between a subsidiary of ENLK and a subsidiary of Kinder Morgan, Inc. in which ENLK owns a 30% interest and Kinder Morgan, Inc. owns a 70% interest. The Cedar Cove JV, which was formed in November 2016, owns gathering and compression assets in Blaine County, Oklahoma, located in the STACK play. |
| CFTC | | U.S. Commodity Futures Trading Commission. |
| CNOW | | Central Northern Oklahoma Woodford Shale. |
CO2 | | Carbon dioxide. |
| Commission | | U.S. Securities and Exchange Commission. |
| Consolidated Credit Facility | | A $1.75 billion unsecured revolving credit facility entered into by ENLC that matures on January 25, 2024, which includes a $500.0 million letter of credit subfacility. The Consolidated Credit Facility was available upon closing of the Merger and is guaranteed by ENLK. |
| | |
| Delaware Basin | | A large sedimentary basin in West Texas and New Mexico. |
| Delaware Basin JV | | Delaware G&P LLC, a joint venture between a subsidiary of ENLK and an affiliate of NGP in which ENLK owns a 50.1% interest and NGP owns a 49.9% interest. The Delaware Basin JV, which was formed in August 2016, owns the Lobo processing facilities and the Tiger processing plant located in the Delaware Basin in Texas. |
| Devon | | Devon Energy Corporation. |
| ENLC | | EnLink Midstream, LLC. |
| ENLC Class C Common Units | | A class of non-economic ENLC common units issued immediately prior to the Merger equal to the number of Series B Preferred Units held immediately prior to the effective time of the Merger, in order to provide certain voting rights to holders of the Series B Preferred Units with respect to ENLC. |
| | |
| ENLC EDA | | Equity Distribution Agreement entered into by ENLC in February 2019 with RBC Capital Markets, LLC, Merrill Lynch, Pierce, Fenner & Smith Incorporated, Barclays Capital Inc., BMO Capital Markets Corp., Citigroup Global Markets Inc., Credit Suisse Securities (USA) LLC, J.P. Morgan Securities LLC, Jefferies LLC, Mizuho Securities USA LLC, MUFG Securities Americas Inc., SunTrust Robinson Humphrey, Inc., and Wells Fargo Securities, LLC (collectively, the “ENLC Sales Agents”) to sell up to $400.0 million in aggregate gross sales of ENLC common units from time to time through an “at the market” equity offering program. |
| | | | | | | | |
| ENLK | | EnLink Midstream Partners, LP or, when applicable, EnLink Midstream Partners, LP together with its consolidated subsidiaries. Also referred to as the “Partnership.” |
| | |
| | |
| | |
| | |
| Exchange Act | | The Securities Exchange Act of 1934, as amended. |
| FERC | | Federal Energy Regulatory Commission. |
| GAAP | | Generally accepted accounting principles in the United States of America. |
| Gals | | Gallons. |
| GCF | | Gulf Coast Fractionators, which owns an NGL fractionator in Mont Belvieu, Texas. ENLK owns 38.75% of GCF. Beginning in January 2021, the GCF assets have been temporarily idled to reduce operating expenses. We expect these assets to resume operations when there is a sustained need for additional fractionation capacity in Mont Belvieu. |
| General Partner | | EnLink Midstream GP, LLC, the general partner of ENLK, which owns a 0.4% general partner interest in ENLK. Prior to the effective time of the Merger, the General Partner also owned all of the incentive distribution rights in ENLK. |
| GHG | | Greenhouse gas. |
| GIP | | Global Infrastructure Management, LLC, an independent infrastructure fund manager, itself, its affiliates, or managed fund vehicles, including GIP III Stetson I, L.P., GIP III Stetson II, L.P., and their affiliates. |
| GIP Transaction | | On July 18, 2018, subsidiaries of Devon closed a transaction to sell all of their equity interests in ENLK, ENLC, and the Managing Member to GIP. |
| | |
| GP Plan | | The General Partner’s Long-Term Incentive Plan. As of the closing of the Merger, ENLC assumed all obligations in respect of the GP Plan. No additional grants of equity awards will be made under the GP Plan for periods after the Merger. |
| | |
| ISDAs | | International Swaps and Derivatives Association Agreements. |
| Managing Member | | EnLink Midstream Manager, LLC, the managing member of ENLC. |
| | |
| MEGA system | | Midland Energy Gathering Area system in Midland, Martin, and Glasscock counties, Texas. |
| Merger | | On January 25, 2019, NOLA Merger Sub, LLC (previously a wholly-owned subsidiary of ENLC) merged with and into ENLK with ENLK continuing as the surviving entity and a subsidiary of ENLC. |
| | |
| Midland Basin | | A large sedimentary basin in West Texas. |
| | |
| MMbbls | | Million barrels. |
| MMbtu | | Million British thermal units. |
| MMcf | | Million cubic feet. |
| MVC | | Minimum volume commitment. |
| NGL | | Natural gas liquid. |
| NGP | | NGP Natural Resources XI, LP. |
| NOLA Merger Sub | | NOLA Merger Sub, LLC, previously a wholly-owned subsidiary of ENLC prior to the Merger. |
| | |
| NYSE | | New York Stock Exchange. |
| OPEC+ | | Organization of the Petroleum Exporting Countries and its broader partners. |
| Operating Partnership | | EnLink Midstream Operating, LP, a Delaware limited partnership and wholly-owned subsidiary of ENLK. |
| ORV | | ENLK’s Ohio River Valley crude oil, condensate stabilization, natural gas compression, and brine disposal assets in the Utica and Marcellus shales. |
| OTC | | Over-the-counter. |
| Permian Basin | | A large sedimentary basin that includes the Midland and Delaware Basins primarily in West Texas and New Mexico. |
| POL contracts | | Percentage-of-liquids contracts. |
| POP contracts | | Percentage-of-proceeds contracts. |
| | |
| | |
| Series B Preferred Unit | | ENLK’s Series B Cumulative Convertible Preferred Unit. |
| Series C Preferred Unit | | ENLK’s Series C Fixed-to-Floating Rate Cumulative Redeemable Perpetual Preferred Unit. |
| STACK | | Sooner Trend Anadarko Basin Canadian and Kingfisher Counties in Oklahoma. |
| Term Loan | | A term loan originally in the amount of $850.0 million entered into by ENLK on December 11, 2018 with Bank of America, N.A., as Administrative Agent, Bank of Montreal and Royal Bank of Canada, as Co-Syndication Agents, Citibank, N.A. and Wells Fargo Bank, National Association, as Co-Documentation Agents, and the lenders party thereto, which ENLC assumed in connection with the Merger and the obligations of which ENLK guaranteed. The Term Loan was paid at maturity on December 10, 2021. |
| VEX | | The Victoria Express Pipeline and related truck terminal and storage assets located in the Eagle Ford Shale in South Texas, which we sold in October 2020. |
| White Star | | White Star Petroleum, LLC. |
| | |
ENLINK MIDSTREAM, LLC
PART I
Item 1. Business
General and Recent Developments
Formation
ENLC is a Delaware limited liability company formed in October 2013. EnLink Midstream, LLC common units are traded on the NYSE under the symbol “ENLC.” Our executive offices are located at 1722 Routh Street, Suite 1300, Dallas, Texas 75201, and our telephone number is (214) 953-9500. Our Internet address is www.enlink.com. We post the following filings in the “Investors” section of our website as soon as reasonably practicable after they are electronically filed with or furnished to the Commission: our Annual Reports on Form 10-K; our quarterly reports on Form 10-Q; our current reports on Form 8-K; and any amendments to those reports or statements filed or furnished pursuant to Section 13(a) or 15(d) of the Securities Exchange Act of 1934, as amended. All such filings on our website are available free of charge. Additionally, filings are available on the Commission’s website (www.sec.gov). In this report, the terms “Company” or “Registrant” as well as the terms “ENLC,” “our,” “we,” and “us” or like terms are sometimes used as references to EnLink Midstream, LLC itself or EnLink Midstream, LLC and its consolidated subsidiaries, including ENLK.
ENLC owns all of ENLK’s common units and also owns all of the membership interests of the General Partner. References in this report to “EnLink Midstream Partners, LP,” the “Partnership,” “ENLK,” or like terms refer to EnLink Midstream Partners, LP itself or EnLink Midstream Partners, LP together with its consolidated subsidiaries, including EnLink Midstream Operating, LP.
On July 18, 2018, GIP acquired control of us and our Managing Member. See “Item 8. Financial Statements and Supplementary Data—Note 1” for more information on the GIP Transaction.
Additional Information
For more information about our organization of business before our simplification transaction in 2019, refer to “Item 1. Business—General” of our Annual Report on Form 10-K for the fiscal year ended December 31, 2019, filed with the Commission on February 26, 2020, and available here.
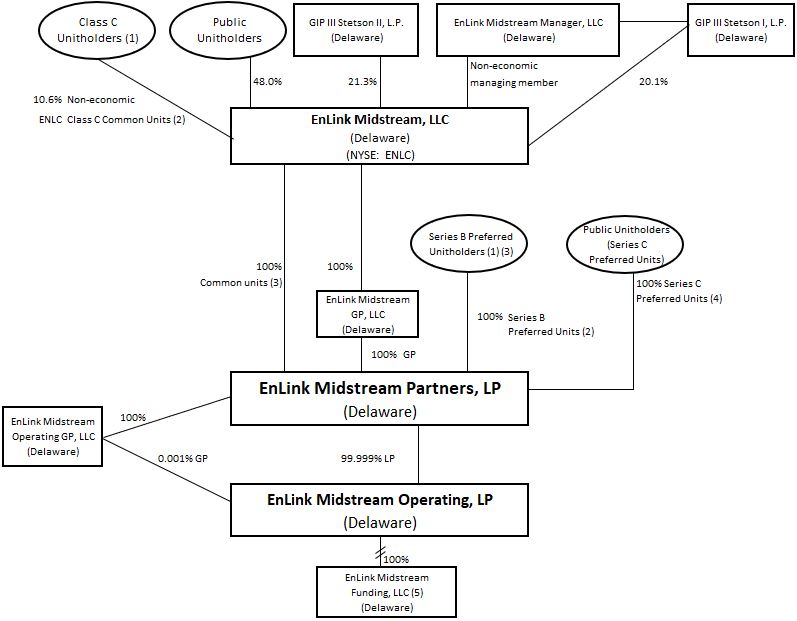
The following diagram depicts our organization and ownership as of December 31, 2021:
____________________________
(1)On August 4, 2021, all of the outstanding Series B Preferred Units and ENLC Class C Common Units were purchased by Brookfield Infrastructure Partners L.P. and funds managed by Oaktree Capital Management, L.P.
(2)Series B Preferred Units are exchangeable into ENLC common units on a 1-for-1.15 basis, subject to certain adjustments. Upon the exchange of any Series B Preferred Units into ENLC common units, an equal number of the ENLC Class C Common Units will be canceled.
(3)All ENLK common units are held by ENLC. The Series B Preferred Units are entitled to vote, on a one-for-one basis (subject to certain adjustments) as a single class with ENLC, on all matters that require approval of the ENLK unitholders.
(4)Series C Preferred Units are perpetual preferred units that are not convertible into other equity interests, and therefore, are not factored into the ENLK ownership calculations for the limited partner and general partner ownership percentages presented.
(5)EnLink Midstream Funding, LLC is a bankruptcy-remote special purpose entity that entered into the AR Facility in October 2020. See “Item 8. Financial Statements and Supplementary Data—Note 6” for more information regarding the AR Facility.
COVID-19 Update
On March 11, 2020, the World Health Organization declared the ongoing coronavirus (COVID-19) outbreak a pandemic and recommended containment and mitigation measures worldwide.
Since the outbreak began, our first priority has been the health and safety of our employees and those of our customers and other business counterparties. Beginning in March 2020, we implemented preventative measures and developed a response plan to minimize unnecessary risk of exposure and prevent infection, while supporting our customers’ operations, and we continue to follow these plans. We also continue to promote heightened awareness and vigilance, hygiene, and implementation of more stringent cleaning protocols across our facilities and operations and we continue to evaluate and adjust our preventative
measures, response plans and business practices with the evolving impacts of COVID-19 and its variants. Since the inception of the pandemic, we have not experienced any significant COVID-19 related operational disruptions.
There remains considerable uncertainty regarding how long the COVID-19 pandemic (including variants of the virus) will persist and affect economic conditions and the extent and duration of changes in consumer behavior.
We cannot predict the full impact that the COVID-19 pandemic or the related volatility in oil and natural gas markets will have on our business, liquidity, financial condition, results of operations, and cash flows (including our ability to make distributions to unitholders) at this time due to numerous uncertainties. The ultimate impacts will depend on future developments, including, among others, the ultimate duration and persistence of the pandemic, the impact of the Delta and Omicron variants of the virus, the speed at which the population is vaccinated against the virus and the efficacy of the vaccines, the emergence of any new variants of the virus against which vaccines are less effective, the effect of the pandemic on economic, social, and other aspects of everyday life, the consequences of governmental and other measures designed to prevent the spread of the virus, actions taken by members of OPEC+ and other foreign, oil-exporting countries, actions taken by governmental authorities, customers, suppliers, and other third parties, and the timing and extent to which normal economic, social, and operating conditions fully resume. Although crude oil and natural gas prices and production activities have recovered to pre-pandemic levels, producers remain cautious and a decline in commodity prices could affect producers’ exploration and production activities. A sustained significant decline in oil and natural gas exploration and production activities and related reduced demand for our services by our customers, whether due to decreases in consumer demand or reduction in the prices for crude oil, condensate, natural gas, and NGLs or otherwise, would have a material adverse effect on our business, liquidity, financial condition, results of operations, and cash flows (including our ability to make distributions to our unitholders).
For additional discussion regarding risks associated with the COVID-19 pandemic, see “Item 1A—Risk Factors—The ongoing coronavirus (COVID-19) pandemic has adversely affected and could continue to adversely affect our business, financial condition, and results of operations.”
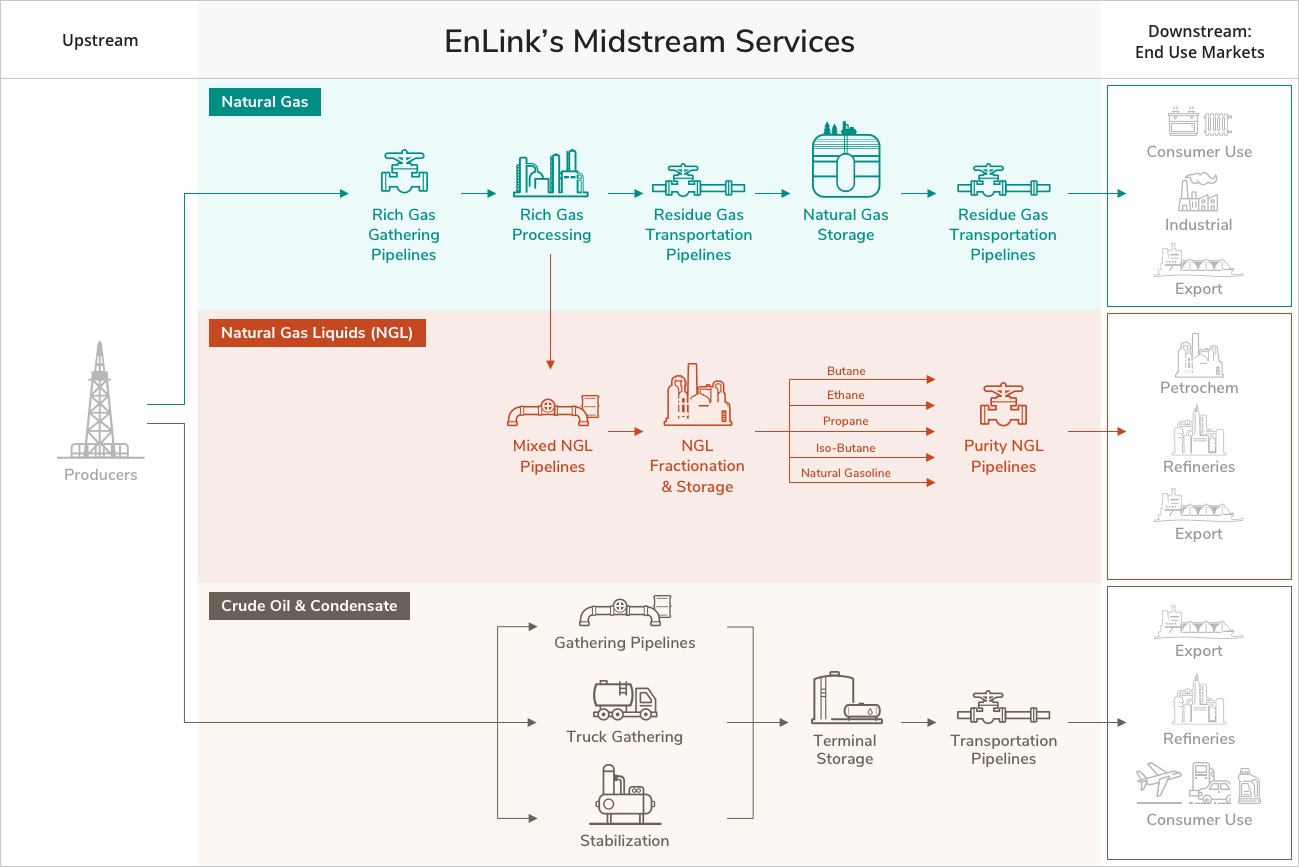
Our Operations
We primarily focus on providing midstream energy services, including:
•gathering, compressing, treating, processing, transporting, storing, and selling natural gas;
•fractionating, transporting, storing, and selling NGLs; and
•gathering, transporting, stabilizing, storing, trans-loading, and selling crude oil and condensate, in addition to brine disposal services.
Our midstream energy asset network includes approximately 12,100 miles of pipelines, 22 natural gas processing plants with approximately 5.5 Bcf/d of processing capacity, seven fractionators with approximately 320,000 Bbls/d of fractionation capacity, barge and rail terminals, product storage facilities, purchasing and marketing capabilities, brine disposal wells, a crude oil trucking fleet, and equity investments in certain joint ventures. Our operations are based in the United States, and our sales are derived primarily from domestic customers.
Our natural gas business includes connecting the wells of producers in our market areas to our gathering systems. Our gathering systems consist of networks of pipelines that collect natural gas from points at or near producing wells and transport it to our processing plants or to larger pipelines for further transmission. We operate processing plants that remove NGLs from the natural gas stream that is transported to the processing plants by our own gathering systems or by third-party pipelines. In conjunction with our gathering and processing business, we may purchase natural gas and NGLs from producers and other supply sources and sell that natural gas or NGLs to utilities, industrial consumers, marketers, and pipelines. Our transmission pipelines receive natural gas from our gathering systems and from third-party gathering and transmission systems and deliver natural gas to industrial end-users, utilities, and other pipelines.
Our fractionators separate NGLs into separate purity products, including ethane, propane, iso-butane, normal butane, and natural gasoline. Our fractionators receive NGLs primarily through our transmission lines that transport NGLs from East Texas and from our South Louisiana processing plants. Our fractionators also have the capability to receive NGLs by truck or rail terminals. We also have agreements pursuant to which third parties transport NGLs from our West Texas and Central Oklahoma operations to our NGL transmission lines that then transport the NGLs to our fractionators. In addition, we have NGL storage capacity to provide storage for customers.
Our crude oil and condensate business includes the gathering and transmission of crude oil and condensate via pipelines, barges, rail, and trucks, in addition to condensate stabilization and brine disposal. We also purchase crude oil and condensate from producers and other supply sources and sell that crude oil and condensate through our terminal facilities to various markets.
Across our businesses, we primarily earn our fees through various fee-based contractual arrangements, which include stated fee-only contract arrangements or arrangements with fee-based components where we purchase and resell commodities in connection with providing the related service and earn a net margin as our fee. We earn our net margin under our purchase and resell contract arrangements primarily as a result of stated service-related fees that are deducted from the price of the commodities purchased.
We manage and report our activities primarily according to the nature of activity and geography. We have five reportable segments:
•Permian Segment. The Permian segment includes our natural gas gathering, processing, and transmission activities and our crude oil operations in the Midland and Delaware Basins in West Texas and Eastern New Mexico;
•Louisiana Segment. The Louisiana segment includes our natural gas and NGL pipelines, natural gas processing plants, natural gas and NGL storage facilities, and fractionation facilities located in Louisiana and our crude oil operations in ORV;
•Oklahoma Segment. The Oklahoma segment includes our natural gas gathering, processing, and transmission activities, and our crude oil operations in the Cana-Woodford, Arkoma-Woodford, northern Oklahoma Woodford, STACK, and CNOW shale areas;
•North Texas Segment. The North Texas segment includes our natural gas gathering, processing, and transmission activities in North Texas; and
•Corporate Segment. The Corporate segment includes our unconsolidated affiliate investments in the Cedar Cove JV in Oklahoma, our ownership interest in GCF in South Texas, and our general corporate assets and expenses.
For more information about our segment reporting, see “Item 8. Financial Statements and Supplementary Data—Note 15.”
Our Business Strategies
We operate a differentiated midstream platform that is built for long-term, sustainable value creation. Our integrated assets are strategically located in premier production basins and core demand centers, including the Permian Basin, the Louisiana Gulf Coast, Central Oklahoma, and North Texas. Our primary business objective is to provide cash flow stability while growing prudently and profitably. We intend to accomplish this objective by executing the following strategies:
•Operational Excellence and Innovation. We have created a rigorous company-wide program that we refer to as the EnLink Way centered on innovation and continuous improvement in our business. We believe this program will allow us to optimize our operations in order to enhance the profitability of current operations, capture capital-efficient commercial opportunities, and enhance the scalability of our asset platforms for future growth.
•Financial Discipline and Flexibility. We are focused on strengthening our financial position and flexibility by generating significant cash flows, driving disciplined and balanced capital allocation, focusing on cost discipline, and maintaining liquidity and balance sheet strength. We believe that these strategies will afford us better access to the capital markets and a competitive cost of capital, and the opportunity to grow our business in a prudent manner throughout the cycles in our industry.
•Strategic Growth. We believe our assets are positioned in some of the most economically advantageous basins in the U.S., as well as key demand centers with growing end-use customers. We expect to grow certain of our systems organically over time by meeting our customers’ midstream service needs that result from their drilling activity in our areas of operation, or growth in supply needs. We are also focused on economically attractive organic expansion opportunities in our areas of operation that allow us to leverage our existing infrastructure, operating expertise, and customer relationships, as well as to increase our natural gas and NGL presence downstream. We are committed to becoming the future of midstream by participating in the energy transition. As part of this effort, we are developing an
integrated offering to bring CCS to businesses along the Mississippi River corridor in Louisiana, one of the highest CO2 emitting regions in the United States. We believe our existing asset footprint, including our extensive network of natural gas pipelines in Louisiana, our operating expertise, and our customer relationships, provide EnLink a strong advantage in building a CCS business.
•Sustainability and Safety. Sustainability and safety are integrated into all aspects of our business. Approximately 90% of our current business is focused on natural gas and natural gas liquids, which we believe will continue to be important sources of clean energy for decades to come. We publish a sustainability report with key metrics that can be measured from year to year, and have announced target emission reduction milestones. To achieve those goals, we continue to evaluate opportunities to reduce or offset emissions in our operations using process improvements and technology, or utilizing renewable energy. With respect to safety, we are committed to operating safely and in an environmentally responsible manner. During 2021, EnLink had its best safety year on record with the lowest number of employee reportable incidents in our history.
Our Assets
Our assets consist of gathering systems, transmission pipelines, processing facilities, fractionation facilities, stabilization facilities, storage facilities, and ancillary assets. The following tables provide information about our assets as of and for the year ended December 31, 2021:
| | | | | | | | | | | | | | | | | | | | | | | | | | |
| | | | | | | | Year Ended |
| | | | | | | | December 31, 2021 |
| Gathering and Transmission Pipelines | | Approximate Length (Miles) | | Compression (HP) | | Estimated Capacity (1) | | Average Throughput (2) |
| Gas Pipelines | | | | | | | | |
| Permian assets: | | | | | | | | |
| MEGA System gathering facilities | | 980 | | | 205,436 | | | 545 | | | 684,500 |
| Delaware gathering system (3) | | 240 | | | 53,680 | | | 280 | | | 382,500 |
| Permian gas assets (3) | | 1,220 | | | 259,116 | | | 825 | | | 1,067,000 |
| | | | | | | | |
| Louisiana assets: | | | | | | | | |
| Louisiana gas gathering and transmission system | | 3,035 | | | 97,400 | | | 3,975 | | | 2,160,800 |
| | | | | | | | |
| Oklahoma assets: | | | | | | | | |
| Central Oklahoma gathering system | | 1,850 | | | 211,490 | | | 1,180 | | | 965,900 |
| Northridge gathering system | | 140 | | | 14,000 | | | 65 | | | 26,500 |
| Oklahoma gas assets | | 1,990 | | | 225,490 | | | 1,245 | | | 992,400 |
| | | | | | | | |
| North Texas assets: | | | | | | | | |
| Bridgeport rich and lean gathering systems | | 2,780 | | | 188,000 | | | 822 | | | 668,200 |
| Johnson County gathering system | | 385 | | | 49,000 | | | 400 | | | 92,300 |
| Silver Creek gathering system | | 890 | | | 45,000 | | | 205 | | | 200,600 |
| Acacia transmission system | | 130 | | | 16,000 | | | 920 | | | 416,300 |
| North Texas gas assets | | 4,185 | | | 298,000 | | | 2,347 | | | 1,377,400 |
| | | | | | | | |
| Total Gas Pipelines | | 10,430 | | | 880,006 | | | 8,392 | | | 5,597,600 |
| | | | | | | | |
| NGL, Crude Oil, and Condensate Pipelines | | | | | | | | |
| Permian assets: | | | | | | | | |
| Permian Crude Oil and Condensate assets | | 490 | | | — | | | 188,500 | | | 134,600 |
| | | | | | | | |
| Louisiana assets: | | | | | | | | |
| Cajun-Sibon NGL pipeline system | | 760 | | | — | | | 185,000 | | | 173,400 |
| Ascension NGL pipeline (4) | | 35 | | | — | | | 50,000 | | | 23,500 |
| Ohio River Valley (5) | | 210 | | | — | | | 17,370 | | | 15,900 |
| Louisiana NGL, Crude Oil, and Condensate assets | | 1,005 | | | — | | | 252,370 | | | 212,800 |
| | | | | | | | |
| Oklahoma assets: | | | | | | | | |
| Central Oklahoma crude oil gathering systems | | 200 | | | — | | | 160,000 | | | 20,200 |
| | | | | | | | |
| Total NGL, Crude Oil, and Condensate Pipelines | | 1,695 | | | — | | | 600,870 | | | 367,600 |
____________________________
(1)Estimated capacity for gas pipelines is MMcf/d. Estimated capacity for liquids and crude and condensate pipelines is Bbls/d.
(2)Average throughput for gas pipelines is MMbtu/d. Average throughput for NGL, crude, and condensate pipelines is Bbls/d.
(3)Includes gross mileage, compression, capacity, and throughput for the Delaware Basin JV, which is owned 50.1% by us. Estimated capacity on our Delaware gathering system includes only the Delaware Basin JV’s compression capacity and does not include gas compressed by third parties on our system.
(4)Includes gross mileage, capacity, and throughput for the Ascension JV, which is owned 50% by us.
(5)Estimated capacity is comprised of trucking capacity only.
| | | | | | | | | | | | | | |
| | | | Year Ended |
| | | | December 31, 2021 |
| Processing Facilities | | Processing Capacity (MMcf/d) | | Average Throughput (MMbtu/d) |
| Permian assets: | | | | |
| MEGA system processing facilities | | 663 | | | 648,000 | |
| Delaware processing facilities | | 635 | | | 362,000 | |
| Permian assets | | 1,298 | | | 1,010,000 | |
| | | | |
| Louisiana assets: | | | | |
| Louisiana gas processing facilities (1) | | 1,778 | | | 214,700 | |
| | | | |
| Oklahoma assets: | | | | |
| Central Oklahoma processing facilities (2) | | 1,160 | | | 916,000 | |
| Northridge processing facility | | 200 | | | 94,300 | |
| Oklahoma assets | | 1,360 | | | 1,010,300 | |
| | | | |
| North Texas assets: | | | | |
| Bridgeport processing facility | | 800 | | | 505,200 | |
| Silver Creek processing system (3) | | 280 | | | 126,300 | |
| North Texas assets | | 1,080 | | | 631,500 | |
| | | | |
| Total Processing Facilities | | 5,516 | | | 2,866,500 | |
____________________________
(1)The Blue Water, Eunice, Plaquemine, and Sabine processing plants are not operational. These plants represent 193 MMcf/d, 350 MMcf/d, 225 MMcf/d, and 300 MMcf/d, respectively, for a total of 1,068 MMcf/d of the total processing capacity of the Louisiana gas processing facilities.
(2)The Thunderbird processing plant is not currently operational and represents 200 MMcf/d of the total processing capacity of the Central Oklahoma processing facilities. In November 2021, we began moving equipment and facilities associated with the Thunderbird processing plant in Central Oklahoma to the Permian Basin. When the move is completed, these assets will operate as a gas processing plant in the Permian Basin.
(3)The Azle and Goforth processing plants are not operational. These plants represent 50 MMcf/d and 30 MMcf/d, respectively, of the total processing capacity of the Silver Creek processing system.
| | | | | | | | | | | | | | |
| | | | Year Ended |
| | | | December 31, 2021 |
| Fractionation Facilities | | Estimated NGL Fractionation Capacity (Bbls/d) | | Average Throughput (Bbls/d) |
| Permian assets: | | | | |
| Mesquite terminal (1) | | 15,000 | | | — | |
| | | | |
| Louisiana assets: | | | | |
| Plaquemine fractionation facility (2) | | 136,800 | | | 80,900 | |
| Riverside fractionation facility (2) | | — | | | 32,900 | |
| Plaquemine processing plant | | 8,500 | | | 1,100 | |
| Eunice fractionation facility | | 75,000 | | | 62,600 | |
| Louisiana assets | | 220,300 | | | 177,500 | |
| | | | |
| North Texas assets: | | | | |
| Bridgeport processing facility | | 25,000 | | | 11,000 | |
| | | | |
| Corporate assets: | | | | |
| GCF (3) | | 56,000 | | | 11,800 | |
| Total Fractionation Facilities | | 316,300 | | | 200,300 | |
____________________________
(1)The Mesquite terminal fractionator is not currently operational.
(2)The Plaquemine fractionation facility produces purity ethane and propane for sale to markets via pipeline, while butane and heavier products are sent to the Riverside fractionation facility for further processing. The Plaquemine fractionation facility and the Riverside fractionation facility have an aggregate fractionation capacity of 136,800 Bbls/d.
(3)Volumes shown reflect our 38.75% ownership in GCF. The GCF fractionation facility is not currently operational.
| | | | | | | | | | | | | | |
| | | | Year Ended |
| | | | December 31, 2021 |
| Storage Assets | | Storage Type | | Estimated Storage Capacity (1) |
| Permian assets: | | | | |
| Avenger storage | | Crude | | 0.1 | |
| | | | |
| Louisiana assets: | | | | |
| Belle Rose gas storage facility | | Gas | | 9.0 | |
| Sorrento gas storage facility | | Gas | | 5.6 | |
| Jefferson Island storage facility | | Gas | | 3.0 | |
| Napoleonville NGL storage facility | | NGL | | 6.8 | |
| ORV storage | | Crude | | 0.7 | |
| | | | |
| Oklahoma assets: | | | | |
| Central Oklahoma storage | | Crude | | 0.2 | |
____________________________
(1)Estimated capacity for gas storage is Bcf and includes linefill capacity necessary to operate storage facilities. Estimated capacity for NGL and crude oil storage is MMbbls.
Permian Segment Assets. Our Permian segment assets include gas gathering systems, crude oil gathering systems and storage, gas processing facilities, and a fractionation facility, which assets are primarily in West Texas and New Mexico.
•Gas Gathering Systems. Our gas gathering systems in the Permian segment consist of the following:
•MEGA system gathering facilities. This gathering system in the Midland Basin serves as an interconnected system of pipelines and compressors to deliver gas from wellheads in the Permian Basin to the MEGA system processing facilities.
•Delaware gas gathering system. This rich natural gas gathering system consists of gathering pipeline and compression assets in the Delaware Basin in Texas and New Mexico. These gathering systems are connected to our Lobo processing facilities and Tiger processing plant, which are owned by the Delaware Basin JV.
•Crude Oil Gathering Systems. Our crude oil gathering systems in the Permian segment consist of crude oil and condensate pipelines and above ground storage, including:
•Avenger. Avenger is a crude oil gathering system in the northern Delaware Basin that is supported by a long-term contract with Devon on dedicated acreage in their Todd and Potato Basin development areas in Eddy and Lea counties in New Mexico.
•Greater Chickadee Gathering System. Greater Chickadee delivers crude oil for customers to Enterprise Product Partners L.P.’s crude oil terminal in West Texas. Greater Chickadee also includes multiple central tank batteries with pump, truck injection, and storage stations to maximize shipping and delivery options for producers.
•Gas Processing Facilities. Our gas processing facilities in the Permian segment consist of the following:
•MEGA system processing facilities. Our MEGA system natural gas processing facilities are located in Midland, Martin, and Glasscock counties, Texas and operate as a connected system. These assets consist of the Bearkat processing facility with a capacity of 75 MMcf/d, the Deadwood processing facility with a capacity of 58 MMcf/d, the Midmar processing facilities with a capacity of 195 MMcf/d, the Riptide processing facility with a capacity of 240 MMcf/d, and the War Horse processing plant with a capacity of 95 MMcf/d.
•Delaware processing facilities. The Delaware processing facilities include our Lobo natural gas processing facilities and the Tiger processing plant. Our Lobo natural gas processing facilities are located in Loving County, Texas and include Lobo I, Lobo II, and Lobo III processing plants which account for 35 MMcf/d, 140 MMcf/d, and 220 MMcf/d of processing capacity, respectively. Our Tiger processing plant is located in Culberson County, Texas, and accounts for 240 MMcf/d of processing capacity. The Lobo processing facilities and the connected gathering system and the Tiger processing plant are owned by the Delaware Basin JV.
•Fractionation Facility. The Mesquite fractionator has an approximate capacity of 15,000 Bbls/d and is located at our Midland gas processing plant complex. The Mesquite fractionator is not currently operational.
Louisiana Segment Assets. Our Louisiana segment assets consist of gas and NGL gathering and transmission pipelines, gas processing facilities, gas and NGL storage, and our ORV crude logistics assets.
•Transmission and Gathering Systems. The gas pipeline system in the Louisiana segment includes gathering and transmission systems, processing facilities, and underground gas storage.
•Gas Transmission and Gathering Systems. Our transmission system consists of a portfolio of large capacity interconnections with the Gulf Coast pipeline grid that provides customers with supply access to multiple domestic production basins for redelivery to major industrial market consumption located primarily in the Mississippi River Corridor between Baton Rouge, Louisiana and New Orleans, Louisiana. Our natural gas transmission services are supplemented by fully integrated, high deliverability salt dome storage capacity strategically located in the natural gas consumption corridor. In combination with our transmission system, our gathering systems provide a fully integrated wellhead to burner tip value chain that includes local gathering, processing, and treating services to Louisiana producers.
•Gas Processing and Storage Facilities. Our gas processing facilities and storage facilities in the Louisiana segment consist of the following:
•Gibson Processing Plant. The Gibson processing plant has 110 MMcf/d of processing capacity and is located in Gibson, Louisiana. The Gibson processing plant is connected to our Louisiana gathering system.
•Pelican Processing Plant. The Pelican processing plant complex is located in Patterson, Louisiana and has a designed capacity of 600 MMcf/d of natural gas. The Pelican processing plant is connected with continental shelf and deepwater production and has downstream connections to the ANR Pipeline. This plant has an interconnection with the Louisiana gas pipeline system allowing us to process natural gas from this system at our Pelican processing plant when markets are favorable.
•Belle Rose Gas Storage Facility. The Belle Rose gas storage facility is located in Assumption Parish, Louisiana. This facility is designed for injecting pipeline quality gas into storage or withdrawing stored gas for delivery by pipeline.
•Sorrento Gas Storage Facility. The Sorrento gas storage facility is located in Ascension Parish, Louisiana. This facility is designed for injecting pipeline quality gas into storage or withdrawing stored gas for delivery by pipeline.
•Jefferson Island Storage Facility. The Jefferson Island storage facility and pipeline header system is located in Iberville and Vermilion Parishes in Louisiana. In December 2020, we acquired the Jefferson Island storage facility, which includes natural gas storage capacity that is connected to our extensive Louisiana natural gas system.
•Idled Processing Plants:
•Blue Water Gas Processing Plant. We operate and own a 64.29% interest in the Blue Water gas processing plant. The Blue Water gas processing plant is located in Crowley, Louisiana and is connected to the Blue Water pipeline system. Our share of the plant’s capacity is approximately 193 MMcf/d. We have shut down the Blue Water gas processing plant, and we do not expect to operate it in the near future unless volumes are sufficient to run the plant.
•Plaquemine Processing Plant. The Plaquemine processing plant has 225 MMcf/d of processing capacity and is connected to the Plaquemine fractionation facility. While the Plaquemine processing plant is currently idle, it has operated periodically throughout 2021 when volumes were sufficient to run the plant. We expect to continue to operate the plant when volumes are sufficient.
•Eunice Processing Plant. The Eunice processing plant is located in South Central Louisiana and has a capacity of 350 MMcf/d of natural gas. We have shut down the Eunice processing plant, and we do not expect the plant to operate in the near future unless volumes are sufficient to run the plant.
•Sabine Pass Processing Plant. The Sabine Pass processing plant is located east of the Sabine River in Johnson's Bayou, Louisiana and has a processing capacity of 300 MMcf/d of natural gas. We have shut down the Sabine Pass processing plant, and we do not expect the plant to operate in the near future unless volumes are sufficient to run the plant.
•NGL and Crude Oil Pipeline Systems. Our NGL and crude oil pipeline systems in the Louisiana segment consist of NGL pipelines, crude oil and condensate pipelines, underground NGL storage, and our ORV crude logistics assets.
•Cajun-Sibon Pipeline System. The Cajun-Sibon pipeline system transports unfractionated NGLs from areas such as the Liberty, Texas interconnects near Mont Belvieu, Texas, and, from time to time, our Gibson and Pelican processing plants in South Louisiana to either the Plaquemine or Eunice fractionators or to third-party fractionators when necessary.
•Ascension Pipeline. The Ascension JV is an NGL pipeline that connects our Riverside fractionator to Marathon Petroleum Corporation’s Garyville refinery and is owned 50% by Marathon Petroleum Corporation.
•Napoleonville Storage Facility. The Napoleonville NGL storage facility is connected to the Riverside facility and is comprised of two existing caverns. The caverns currently provide butane storage.
•Ohio River Valley. Our ORV operations are an integrated network of assets comprised of a 5,000-barrel-per-hour crude oil and condensate barge loading terminal on the Ohio River, a 20-spot crude oil and condensate
rail loading terminal on the Ohio Central Railroad network, crude oil and condensate pipelines in Ohio and West Virginia, above ground crude oil storage, a trucking fleet comprised of both semi and straight trucks, trailers for hauling NGL volumes, and seven existing brine disposal wells. Additionally, our ORV operations include condensate stabilization and natural gas compression stations that are supported by long-term, fee-based contracts with multiple producers.
•Fractionation Facilities. There are four fractionation facilities located in the Louisiana segment that are connected to our processing facilities and to Mont Belvieu, Texas and other hubs through our Cajun-Sibon pipeline system.
•Plaquemine Fractionation Facility. The Plaquemine fractionator is located at our Plaquemine gas processing plant complex and is connected to our Cajun-Sibon pipeline. The Plaquemine fractionation facility produces purity ethane and propane for sale to markets via pipeline, while butane and heavier products are sent to our Riverside facility for further processing. The Plaquemine fractionator, collectively with the Riverside Fractionation Facility, has an approximate capacity of 136,800 Bbls/d of raw-make NGL products.
•Plaquemine Gas Processing Plant. In addition to the Plaquemine fractionation facility, the adjacent Plaquemine gas processing plant also has an on-site fractionator.
•Eunice Fractionation Facility. The Eunice fractionation facility is located in South Central Louisiana. Liquids are delivered to the Eunice fractionation facility by the Cajun-Sibon pipeline system. The Eunice fractionation facility fractionates butane and heavier products from our Riverside facility and is directly connected to NGL markets and to a third-party storage facility.
•Riverside Fractionation Facility. The Riverside fractionator and loading facility are located on the Mississippi River upriver from Geismar, Louisiana. Liquids are delivered to the Riverside fractionator by pipeline from the Pelican processing plants or by third-party truck and rail assets. The loading/unloading facility has the capacity to transload 15,000 Bbls/d of crude oil and condensate from rail cars to barges.
Oklahoma Segment Assets. Our Oklahoma segment assets consist of gas processing facilities, gas gathering systems, and crude oil gathering systems and storage in Southern and Central Oklahoma.
•Gas Gathering Systems. Our gas gathering systems in the Oklahoma segment consist of the following:
•Central Oklahoma gathering system. The Central Oklahoma gathering system serves the STACK and CNOW plays.
•Northridge gathering system. Our Northridge gathering system is located in the Arkoma-Woodford Shale in Southeastern Oklahoma.
•Gas Processing Facilities. Our gas processing facilities in the Oklahoma segment consist of the following:
•Central Oklahoma processing facilities. The Central Oklahoma processing facilities include the Thunderbird processing plant, the Chisholm processing plants, and the Cana processing plant (collectively, the “Central Oklahoma processing system”), which account for 200 MMcf/d, 560 MMcf/d, and 400 MMcf/d of processing capacity, respectively.
•The processing facility at the Thunderbird processing plant was idled due to decreased volumes. In November 2021, we began moving equipment and facilities associated with the Thunderbird processing plant in Central Oklahoma to the Midland Basin. We expect to complete the relocation in the second half of 2022.
•The unprocessed NGLs from the Chisholm processing plants are transported by ONEOK, Inc. (“ONEOK”) to NGL transmission lines, which then transport the NGLs to our fractionators in Louisiana.
•The residue natural gas from the Cana processing plant is delivered to Enable Midstream Partners, LP and an affiliate of ONEOK. Devon is the primary customer of the Cana processing plant. We have extended our fixed-fee processing agreement with Devon, which was effective after the GIP Transaction, and currently have approximately seven years remaining on the fixed-fee gathering and processing
agreement pursuant to which we provide processing services for natural gas delivered by Devon to the Cana processing plant.
•Northridge processing facility. Our Northridge processing plant is located in Hughes County in the Arkoma-Woodford Shale in Southeastern Oklahoma. The residue natural gas from the Northridge processing facility is delivered to CenterPoint Energy, Inc., Enable Midstream Partners, LP, and MPLX LP.
•Crude Oil Gathering Systems. Our crude and condensate assets in the Oklahoma segment have crude oil and condensate pipelines and above ground storage in Central Oklahoma. These assets consist of the following:
•Central Oklahoma Crude Oil Gathering Systems. Our Central Oklahoma crude oil gathering systems include Black Coyote and Redbud. Black Coyote operates in the core of the STACK play in Central Oklahoma and was built primarily to service acreage dedicated from Devon, which is the anchor customer on the system. Redbud also operates in the core of the STACK play and is supported by a contract with Marathon Oil Company.
North Texas Segment Assets. Our North Texas segment assets include gas gathering systems, a gas transmission system, gas processing facilities, and a fractionation facility in the Barnett Shale.
•Gas Gathering Systems. Our gas gathering systems in the North Texas segment are connected to our processing assets and consist of the following:
•Bridgeport rich gas gathering system. A substantial majority of the natural gas gathered on the Bridgeport rich gas gathering system is delivered to the Bridgeport processing facility. BKV was the largest customer on the Bridgeport rich gas gathering system contributing substantially all of the natural gas gathered for the year ended December 31, 2021. BKV acquired Devon’s Barnett Shale assets in October 2020. As a result of this acquisition, we have extended a fixed-fee gathering agreement with BKV and currently have approximately eleven years remaining on the fixed-fee gathering agreement pursuant to which we provide gathering services on the Bridgeport system.
•Bridgeport lean gas gathering system. Natural gas gathered on the Bridgeport lean gas gathering system was primarily attributable to BKV for the year ended December 31, 2021 and was delivered to the Acacia transmission system and to intrastate pipelines without processing. As described above, we are party to a fixed-fee gathering and processing agreement with BKV that covers gathering services on the Bridgeport system.
•Johnson County gathering system. Natural gas gathered on this system is primarily attributable to one customer with whom we have a fixed-fee processing agreement that currently has approximately two years remaining.
•Silver Creek gathering system. Our Silver Creek gathering system is located primarily in Hood, Parker, and Johnson counties, Texas, and connects to the Silver Creek processing system.
•Gas Transmission System. The Acacia transmission system is a pipeline that connects production from the Barnett Shale to markets in North Texas accessed by Atmos Energy, Brazos Electric, Enbridge Inc, Energy Transfer Partners, Enterprise Product Partners, and GDF Suez. BKV was the largest customer on the Acacia pipeline for the year ended December 31, 2021. We currently have approximately two years remaining on a fixed-fee transportation agreement with BKV that covers transmission services and includes annual rate escalators.
•Gas Processing Facilities. Our gas processing facilities in the North Texas segment consist of the following:
•Bridgeport processing facility. Our Bridgeport natural gas processing facility, located in Wise County, Texas, is one of the largest processing plants in the U.S. with seven cryogenic turboexpander plants. BKV was the Bridgeport facility’s largest customer, providing substantially all of the natural gas processed for the year ended December 31, 2021. As described above, we have extended a fixed-fee processing agreement with BKV and currently have approximately eleven years remaining on our agreement with BKV pursuant to which we provide processing services for natural gas delivered to the Bridgeport processing facility.
•Silver Creek processing system. Our Silver Creek processing system, located in Weatherford, Azle, and Fort Worth, Texas, includes three processing plants: the Azle plant, the Silver Creek plant, and the Goforth plant,
which account for 50 MMcf/d, 200 MMcf/d, and 30 MMcf/d of processing capacity, respectively. The Azle and Goforth plants are idled due to decreased volumes, and these plants remain non-operational. Currently, the processing capacity at the Silver Creek plant is sufficient to process all gas on the Silver Creek processing system.
•Fractionation Facility. Our Bridgeport processing plant in North Texas also has fractionation capabilities that provide operational flexibility for the related processing plants but is not the primary fractionation facility for the NGLs produced by the processing plants. Under our current contracts, we do not earn fractionation fees for operating this facility, so throughput volumes through this facility are not captured on a routine basis and are not significant to our adjusted gross margin.
Corporate Segment Assets. Our Corporate segment assets primarily consist of our 38.75% ownership interest in GCF and 30% ownership interest in the Cedar Cove JV.
•GCF. We own a 38.75% interest in GCF, with the remaining interests owned 22.5% by Phillips 66, and 38.75% by Targa Resources Partners, LP. GCF owns an NGL fractionator located on the Gulf Coast at Mont Belvieu, Texas. Targa Resources Partners, LP is the operator of the fractionator. GCF receives raw mix NGLs from customers, fractionates the raw mix, and redelivers the finished products to customers for a fee. Beginning in January 2021, the GCF assets were temporarily idled to reduce operating expenses. We expect these assets to resume operations when there is a sustained need for additional fractionation capacity in Mont Belvieu.
•Cedar Cove JV. We own a 30% interest in the Cedar Cove JV, which operates gathering and compression assets in Blaine County, Oklahoma that tie into our existing Oklahoma assets. Kinder Morgan, Inc. owns a 70% interest in, and is the operator of, the Cedar Cove JV. All gas gathered by the Cedar Cove JV is processed by our Central Oklahoma processing facilities.
Recent Developments
Phantom Processing Plant. In November 2021, we began moving equipment and facilities associated with the Thunderbird processing plant in Central Oklahoma to the Midland Basin. This processing plant relocation is expected to increase the processing capacity of our Permian Basin processing facilities by approximately 200 MMcf/d. We expect to complete the relocation in the second half of 2022.
Amarillo Rattler Acquisition. On April 30, 2021, we completed the acquisition of Amarillo Rattler, LLC, the owner of a gathering and processing system located in the Midland Basin. In connection with the purchase, we entered into an amended and restated gas gathering and processing agreement with Diamondback Energy, strengthening our dedicated acreage position with that entity. We acquired the system with an upfront payment of $50.0 million, which was paid with cash-on-hand, with an additional $10.0 million to be paid on April 30, 2022, and contingent consideration capped at $15.0 million and payable between 2024 and 2026 based on Diamondback Energy’s drilling activity above historical levels.
War Horse Processing Plant. In December 2020, we began moving equipment and facilities previously associated with the Battle Ridge processing plant in Central Oklahoma to the Permian Basin. The move has been completed and the War Horse processing plant began operations in August 2021. In November 2021, we completed an expansion to the War Horse processing plant, which increased the processing capacity to 95 MMcf/d.
Industry Overview
The following diagram illustrates the gathering, processing, fractionation, stabilization, and transmission process.
The midstream industry is the link between the exploration and production of natural gas and crude oil and condensate and the delivery of its components to end-user markets. The midstream industry is generally characterized by regional competition based on the proximity of gathering systems and processing plants to natural gas and crude oil and condensate producing wells.
Natural gas gathering. The natural gas gathering process follows the drilling of wells into gas-bearing rock formations. After a well has been completed, it is connected to a gathering system. Gathering systems typically consist of a network of small diameter pipelines and, if necessary, compression and treating systems that collect natural gas from points near producing wells and transport it to larger pipelines for further transmission.
Compression. Gathering systems are operated at pressures that will maximize the total natural gas throughput from all connected wells. Because wells produce gas at progressively lower field pressures as they age, it becomes increasingly difficult to deliver the remaining production in the ground against the higher pressure that exists in the connected gathering system. Natural gas compression is a mechanical process in which a volume of gas at an existing pressure is compressed to a desired higher pressure, allowing gas that no longer naturally flows into a higher-pressure downstream pipeline to be brought to market. Field compression is typically used to allow a gathering system to operate at a lower pressure or provide sufficient discharge pressure to deliver gas into a higher-pressure downstream pipeline. The remaining natural gas in the ground will not be produced if field compression is not installed because the gas will be unable to overcome the higher gathering system pressure. A declining well can continue delivering natural gas if field compression is installed.
Natural gas processing. The principal components of natural gas are methane and ethane, but most natural gas also contains varying amounts of heavier NGLs and contaminants, such as water and CO2, sulfur compounds, nitrogen, or helium. Natural gas produced by a well may not be suitable for long-haul pipeline transportation or commercial use and may need to be processed to remove the heavier hydrocarbon components and contaminants. Natural gas in commercial distribution systems mostly consists of methane and ethane, and moisture and other contaminants have been removed, so there are negligible
amounts of them in the gas stream. Natural gas is processed to remove unwanted contaminants that would interfere with pipeline transportation or use of the natural gas and to separate those hydrocarbon liquids from the gas that have higher value as NGLs. The removal and separation of individual hydrocarbons through processing is possible due to differences in weight, boiling point, vapor pressure, and other physical characteristics. Natural gas processing involves the separation of natural gas into pipeline-quality natural gas and a mixed NGL stream and the removal of contaminants.
NGL fractionation. NGLs are separated into individual, more valuable components during the fractionation process. NGL fractionation facilities separate mixed NGL streams into discrete NGL products: ethane, propane, isobutane, normal butane, natural gasoline, and stabilized crude oil and condensate. Ethane is primarily used in the petrochemical industry as feedstock for ethylene, one of the basic building blocks for a wide range of plastics and other chemical products. Propane is used as a petrochemical feedstock in the production of ethylene and propylene and as a heating fuel, an engine fuel, and industrial fuel. Isobutane is used principally to enhance the octane content of motor gasoline. Normal butane is used as a petrochemical feedstock in the production of ethylene and butylene (a key ingredient in synthetic rubber), as a blend stock for motor gasoline, and to derive isobutene through isomerization. Natural gasoline, a mixture of pentanes and heavier hydrocarbons, is used primarily as motor gasoline blend stock or petrochemical feedstock.
Natural gas transmission. Natural gas transmission pipelines receive natural gas from mainline transmission pipelines, processing plants, and gathering systems and deliver it to industrial end-users, utilities, and to other pipelines.
Crude oil and condensate transmission. Crude oil and condensate are transported by pipelines, barges, rail cars, and tank trucks. The method of transportation used depends on, among other things, the resources of the transporter, the locations of the production points and the delivery points, cost-efficiency, and the quantity of product being transported.
Condensate Stabilization. Condensate stabilization is the distillation of the condensate product to remove the lighter end components, which ultimately creates a higher quality condensate product that is then delivered via truck, rail, or pipeline to local markets.
Brine gathering and disposal services. Typically, shale wells produce significant amounts of water that, in most cases, require disposal. Produced water and frac-flowback is hauled via truck transport or is pumped through pipelines from its origin at the oilfield tank battery or drilling pad to the disposal location. Once the water reaches the delivery disposal location, water is processed and filtered to remove impurities, and injection wells place fluids underground for storage and disposal.
Storage. Demand for natural gas, NGLs, and crude oil fluctuate daily and seasonally, while production and pipeline deliveries are relatively constant in the short term. Storage of products during periods of low demand helps to ensure that sufficient supplies are available during periods of high demand. Natural gas and NGLs are stored in large volumes in underground facilities and in smaller volumes in tanks above and below ground, while crude oil is typically stored in tanks above ground.
Crude oil and condensate terminals. Crude oil and condensate rail terminals are an integral part of ensuring the movement of new crude oil and condensate production from the developing shale plays in the United States and Canada. In general, the crude oil and condensate rail loading terminals are used to load rail cars and transport the commodity out of developing basins into market rich areas of the country where crude oil and condensate rail unloading terminals are used to unload rail cars and store crude oil and condensate volumes for third parties until the crude oil and condensate is redelivered to premium market delivery points via pipelines, trucks, or rail.
Balancing Supply and Demand
When we purchase natural gas, NGLs, crude oil, and condensate, we establish a margin normally by selling it for physical delivery to third-party users. We can also use over-the-counter derivative instruments or enter into future delivery obligations under futures contracts on the New York Mercantile Exchange (“NYMEX”) related to our natural gas purchases to balance our margin position. Through these transactions, we seek to maintain a position that is balanced between (1) purchases and (2) sales or future delivery obligations. Our policy is not to acquire and hold natural gas, NGL, or crude oil futures contracts or derivative products for the purpose of speculating on price changes.
Competition
The business of providing gathering, transmission, processing, and marketing services for natural gas, NGLs, crude oil, and condensate is highly competitive. We face strong competition in obtaining natural gas, NGLs, crude oil, and condensate
supplies and in the marketing, transportation, and processing of natural gas, NGLs, crude oil, and condensate. Our competitors include major integrated and independent exploration and production companies, natural gas producers, interstate and intrastate pipelines, other natural gas, NGLs, and crude oil and condensate gatherers, and natural gas processors. Competition for natural gas and crude oil and condensate supplies is primarily based on geographic location of facilities in relation to production or markets, the reputation, efficiency, and reliability of the gatherer, and the pricing arrangements offered by the gatherer. For areas where acreage is not dedicated to us, we compete with similar enterprises in providing additional gathering and processing services in its respective areas of operation. Many of our competitors may offer more services or have greater financial resources and access to larger natural gas, NGLs, crude oil, and condensate supplies than we do. Our competition varies in different geographic areas.
In marketing natural gas, NGLs, crude oil, and condensate, we have numerous competitors, including marketing affiliates of interstate pipelines, major integrated oil and gas companies, and local and national natural gas producers, gatherers, brokers, and marketers of widely varying sizes, financial resources, and experience. Local utilities and distributors of natural gas are, in some cases, engaged directly and through affiliates in marketing activities that compete with our marketing operations.
We face strong competition for acquisitions and development of new projects from both established and start-up companies. Competition increases the cost to acquire existing facilities or businesses and results in fewer commitments and lower returns for new pipelines or other development projects. Our competitors may have greater financial resources than we possess or may be willing to accept lower returns or greater risks. Our competition differs by region and by the nature of the business or the project involved.
Natural Gas, NGL, Crude Oil, and Condensate Supply
Our gathering and transmission pipelines have connections with major intrastate and interstate pipelines, which we believe have ample natural gas and NGL supplies in excess of the volumes required for the operation of these systems. We evaluate well and reservoir data that is either publicly available or furnished by producers or other service providers in connection with the construction and acquisition of our gathering systems and assets to determine the availability of natural gas, NGLs, crude oil, and condensate supply for our systems and assets and/or obtain an MVC from the producer that results in a rate of return on investment. We do not routinely obtain independent evaluations of reserves dedicated to our systems and assets due to the cost and relatively limited benefit of such evaluations. Accordingly, we do not have estimates of total reserves dedicated to our systems and assets or the anticipated life of such producing reserves.
Credit Risk and Significant Customers
We are subject to risk of loss resulting from nonpayment or nonperformance by our customers and other counterparties, such as our lenders and hedging counterparties. We diligently attempt to ensure that we issue credit to only credit-worthy customers. However, our purchase and resale of crude oil, condensate, NGLs, and natural gas exposes us to significant credit risk, as the margin on any sale is generally a very small percentage of the total sales price. Therefore, a credit loss can be very large relative to our overall profitability. A substantial portion of our throughput volumes come from customers that have investment-grade ratings. However, lower commodity prices in future periods and other macro-economic factors, including the ongoing or future effects of the COVID-19 pandemic on our industry and our customers may result in a reduction in our customers’ liquidity and ability to make payments or perform on their obligations to us.
The following customers individually represented greater than 10% of our consolidated revenues during 2021, 2020, or 2019. These customers represented a significant percentage of our consolidated revenues, and the loss of these customers would have a material adverse impact on our results of operations because the revenues and adjusted gross margin received from transactions with these customers is material to us. No other customers represented greater than 10% of our consolidated revenues during the periods presented.
| | | | | | | | | | | | | | | | | |
| Year Ended December 31, |
| 2021 | | 2020 | | 2019 |
| Devon | 6.7 | % | | 14.4 | % | | 10.5 | % |
| Dow Hydrocarbons and Resources LLC | 14.5 | % | | 13.2 | % | | 10.0 | % |
| Marathon Petroleum Corporation | 13.4 | % | | 12.2 | % | | 13.8 | % |
Regulation
Recent Regulatory Developments. On January 20, 2021, the Acting Secretary for the Department of the Interior signed an order suspending new fossil fuel leasing and permitting on federal lands, including offshore pipeline leases, for 60 days. Then on January 27, 2021, President Biden issued an executive order indefinitely suspending new oil and natural gas leases on public lands or in offshore waters pending completion of a comprehensive review and reconsideration of federal oil and gas permitting and leasing practices. Several states filed lawsuits challenging the suspension and on June 15, 2021, a judge in the U.S. District Court for the Western District of Louisiana issued a nationwide temporary injunction blocking the suspension. The Department of the Interior appealed the U.S. District Court’s ruling but resumed oil and gas leasing pending resolution of the appeal. In November 2021, the Department of the Interior completed its review and issued a report on the federal oil and gas leasing program. The Department of the Interior’s report recommends several changes to federal leasing practices, including changes to royalty payments, bidding, and bonding requirements.
If our customers are unable to secure permits, sustained reductions in exploration or production activity in our areas of operation could lead to reduced utilization of our pipeline and terminal systems or reduced rates under renegotiated transportation or storage agreements. We are still evaluating the effects of the potential change to the federal leasing program on our operations and our customers’ operations, but our inability and our customers’ inability to secure required permits could adversely affect our business, financial condition, results of operations, or cash flows, including our ability to make cash distributions to our unitholders.
Natural Gas Pipeline Regulation. We own an interstate natural gas pipeline that is subject to regulation as a natural gas company by FERC under the Natural Gas Act of 1938 (“NGA”). FERC regulates the rates and terms and conditions of service on interstate natural gas pipelines, as well as the certification, construction, modification, expansion, and abandonment of facilities.
The rates and terms and conditions of service for our interstate pipeline services regulated by FERC must be just and reasonable and not unduly preferential or unduly discriminatory, although negotiated rates may be accepted in certain circumstances. Such rates and terms and conditions of service are set forth in FERC-approved tariffs. Proposed rate increases and changes to our tariff are subject to FERC approval. Pursuant to FERC’s jurisdiction over rates, existing rates may be challenged by complaint or by FERC on its own initiative and proposed new or changed rates may be challenged by protest. If protested, a rate increase may be suspended for up to five months and collected, subject to refund. If, upon completion of an investigation, FERC finds that the new or changed rate is unlawful, it is authorized to require the pipeline to refund revenues collected in excess of the just and reasonable rate during the term of the investigation.
In addition to policies regarding rate setting, interstate natural gas pipelines regulated by FERC are required to comply with numerous regulations related to standards of conduct, market transparency, and market manipulation. FERC’s standards of conduct regulate the manner in which interstate natural gas pipelines may interact with their marketing affiliates if such marketing affiliates are shippers on their interstate natural gas pipelines. FERC’s market oversight and transparency regulations require regulated entities to submit annual reports of threshold purchases or sales of natural gas and publicly post certain information on scheduled volumes. FERC’s market manipulation regulations, promulgated pursuant to the Energy Policy Act of 2005 (the “EPAct 2005”), make it unlawful for any entity, directly or indirectly in connection with the purchase or sale of natural gas subject to the jurisdiction of FERC, or the purchase or sale of transportation services subject to the jurisdiction of FERC, to (1) use or employ any device, scheme, or artifice to defraud; (2) make any untrue statement of material fact or omit to state a material fact necessary to make the statements made not misleading (in light of the circumstances under which the statements were made); or (3) engage in any act, practice, or course of business that operates (or would operate) as a fraud or deceit upon any person. The EPAct 2005 also gives FERC authority to impose civil penalties for violations of these statutes up to $1.0 million per day per violation for violations occurring after August 8, 2005. The maximum penalty authority established by the statute has been adjusted to approximately $1.39 million per day per violation and will continue to be adjusted periodically for inflation. Should we fail to comply with all applicable FERC-administered statutes, rules, regulations, and orders, we could be subject to substantial penalties and fines.
Certain of our intrastate natural gas pipelines also transport gas in interstate commerce and, thus, the rates, terms and conditions of such services are subject to FERC jurisdiction under Section 311 of the Natural Gas Policy Act of 1978 (“NGPA”). Pipelines providing transportation service under Section 311 of the NGPA are required to provide services on an open and nondiscriminatory basis, and the maximum rates for interstate transportation services provided by such pipelines must be “fair and equitable.” Such rates are generally subject to review every five years by FERC or by an appropriate state agency.
In addition to regulation under Section 311 of the NGPA, our intrastate natural gas pipeline operations are subject to regulation by various state agencies. Most state agencies possess the authority to review and authorize natural gas transportation transactions and the construction, acquisition, abandonment, and interconnection of physical facilities for intrastate pipelines. State agencies also may regulate transportation rates, service terms and conditions, and contract pricing.
Liquids Pipeline Regulation. We own certain liquids and crude oil pipelines that are regulated by FERC as common carrier interstate pipelines under the Interstate Commerce Act (“ICA”), the Energy Policy Act of 1992, and related rules and orders.
FERC regulation requires that interstate liquids pipeline rates and terms and conditions of service, including rates for transportation of crude oil, condensate, and NGLs, be filed with FERC and that these rates and terms and conditions of service be “just and reasonable” and not unduly discriminatory or unduly preferential.
Rates of interstate liquids pipelines are currently regulated by FERC primarily through an annual indexing methodology, under which pipelines increase or decrease their rates in accordance with an index adjustment specified by FERC. This adjustment is subject to review every five years. On December 17, 2020, for the five-year period beginning on July 1, 2021, FERC established an annual index adjustment equal to the change in the producer price index for finished goods plus 0.78%. On January 20, 2022, however, FERC issued an Order on Rehearing revising the annual index adjustment to the change in the producer price index for finished goods minus 0.21% (“Order on Rehearing”). As a result of the change in the index adjustment, certain ceiling levels for our interstate liquids pipelines were reduced and any rates that exceeded the newly computed ceiling levels were subsequently lowered to bring those rates into compliance with the revised ceiling level. The revised rates will become effective March 1, 2022.
The ICA permits interested persons to challenge proposed new or changed rates and authorizes FERC to suspend the effectiveness of such rates for up to seven months and investigate such rates. If, upon completion of an investigation, FERC finds that the new or changed rate is unlawful, it is authorized to require the pipeline to refund revenues collected in excess of the just and reasonable rate during the term of the investigation. FERC may also investigate, upon complaint or on its own motion, rates that are already in effect and may order a carrier to change its rates prospectively. Under certain circumstances, FERC could limit our ability to set rates based on our costs or could order us to reduce our rates and pay reparations to complaining shippers for up to two years prior to the date of the complaint. FERC also has the authority to change our terms and conditions of service if it determines that they are unjust and unreasonable or unduly discriminatory or preferential.
As we acquire, construct, and operate new liquids assets and expand our liquids transportation business, the classification and regulation of our liquids transportation services, including services that our marketing companies provide on our FERC-regulated liquids pipelines, are subject to ongoing assessment and change based on the services we provide and determinations by FERC and the courts. Such changes may subject additional services we provide to regulation by FERC.
Intrastate NGL and other petroleum pipelines are not generally subject to rate regulation by FERC, but they are subject to regulation by various agencies in the respective states where they are located. While such regulatory regimes vary, state agencies typically require intrastate NGL and petroleum pipelines to file their rates with the agencies and permit shippers to challenge existing rates or proposed rate increases.
Gathering Pipeline Regulation. Section 1(b) of the NGA exempts natural gas gathering facilities from the jurisdiction of FERC under the NGA (no such exemption exists under the ICA for pipelines transporting liquids in interstate commerce). We own a number of natural gas pipelines that we believe meet the traditional tests FERC has used to establish that a pipeline is a gathering pipeline and therefore not subject to FERC jurisdiction. The distinction between FERC-regulated transmission services and federally unregulated gathering services is a fact-intensive analysis, however, so the classification and regulation of our gathering facilities are subject to change. Application of FERC jurisdiction to our gathering facilities could increase our operating costs, decrease our rates, and adversely affect our business. State regulation of gathering facilities generally includes various safety, environmental, and, in some circumstances, nondiscriminatory requirements and complaint-based rate regulation.
In addition, we are subject to some state ratable take and common purchaser statutes. The ratable take statutes generally require gatherers to take, without undue discrimination, natural gas production that may be tendered to the gatherer for handling. Similarly, common purchaser statutes generally require gatherers to purchase without undue discrimination as to source of supply or producer. These statutes are designed to prohibit discrimination in favor of one producer over another producer or one source of supply over another source of supply.
Natural Gas Storage Regulation. The U.S. Department of Transportation’s Pipeline and Hazardous Materials Safety Administration (“PHMSA”) regulates safety issues related to downhole facilities located at both intrastate and interstate underground natural gas storage facilities. PHMSA mandates certain reporting requirements for operators of underground
natural gas storage facilities and sets minimum federal safety standards. In addition, all intrastate transportation related underground natural gas storage facilities are subject to minimum federal safety standards and are inspected by PHMSA or by a state entity that has chosen to expand its authority to regulate these facilities under a certification filed with PHMSA. We are in compliance with these PHMSA rules.
Certain of our field injection and withdrawal wells and water disposal wells are subject to the jurisdiction of the Railroad Commission of Texas (“TRRC”). TRRC regulations require that we report the volumes of natural gas and water disposal associated with the operations of such wells on a monthly and annual basis, respectively. Results of periodic mechanical integrity tests must also be reported to the TRRC. In addition, our underground gas storage caverns in Louisiana are subject to the jurisdiction of the Louisiana Department of Natural Resources (“LDNR”). In recent years, LDNR has put in place more comprehensive regulations governing underground hydrocarbon storage in salt caverns, and we are in compliance with these newer regulations.
We also operate brine disposal wells that are regulated as Class II wells under the federal Safe Drinking Water Act (“SDWA”). The SDWA imposes requirements on owners and operators of Class II wells through the EPA’s Underground Injection Control program, including construction, operating, monitoring and testing, reporting, and closure requirements. Our brine disposal wells are also subject to comparable state laws and regulations. For more information, see “Environmental Matters” below.
Sales of Natural Gas and NGLs. The prices at which we sell natural gas and NGLs currently are not subject to federal regulation and, for the most part, are not subject to state regulation. Our natural gas and NGL sales are, however, affected by the availability, terms, cost, and regulation of pipeline transportation.
Employee Safety. We are subject to the requirements of the Occupational Safety and Health Act (“OSHA”), and comparable state laws that regulate the protection of the health and safety of workers. In addition, the OSHA hazard communication standard requires that information be maintained about hazardous materials used or produced in operations and that this information be provided to employees, state and local government authorities, and citizens. We believe that our operations are in substantial compliance with the OSHA requirements including general industry standards, record keeping requirements, and monitoring of occupational exposure to regulated substances.
Pipeline Safety Regulations. Our pipelines are subject to regulation by PHMSA pursuant to the Natural Gas Pipeline Safety Act of 1968 (“NGPSA”) and the Pipeline Safety Improvement Act of 2002 (“PSIA”). The NGPSA regulates safety requirements in the design, construction, operation, and maintenance of gas pipeline facilities. The PSIA established mandatory inspections for all U.S. crude oil and natural gas transportation pipelines and some gathering lines in high-consequence areas (“HCAs”), which include, among other things, areas of high population density or that serve as sources of drinking water. PHMSA has developed regulations implementing the PSIA that require transportation pipeline operators to implement integrity management programs, including more frequent inspections and other measures to ensure pipeline safety in HCAs. Additionally, the Pipeline Safety, Regulatory Certainty and Job Creation Act of 2011 increased penalties for safety violations, established additional safety requirements for newly constructed pipelines, and required studies of certain safety issues that could result in the adoption of new regulatory requirements for existing pipelines. In December 2020, the President of the United States signed the Protecting our Infrastructure of Pipelines and Enhancing Safety Act of 2020 (the “PIPES Act”), which reauthorizes PHMSA’s oil and gas pipeline programs through 2023 and imposes additional mandates on the agency. For example, the law requires, among other things, rulemaking to amend the integrity management program, emergency response plan, operation and maintenance manual, and pressure control recordkeeping requirements for gas distribution operators; to create new leak detection and repair program obligations; and to set new minimum federal safety standards for onshore gas gathering lines. Additionally, PHMSA’s maximum civil penalties were increased in January 2021.
On January 23, 2017, PHMSA issued a final rule amending its pipeline safety regulations to address requirements of the Pipeline Safety, Regulatory Certainty, and Job Creation Act of 2011 and to update and clarify certain regulatory requirements regarding notifications of accidents and incidents. The final rule also added provisions for cost recovery for design reviews of certain new projects, provides for renewal of existing special permits, and incorporates certain standards for in-line inspections and stress corrosion cracking assessments. On January 11, 2021, PHMSA issued another final rule amending its pipeline safety regulations to ease regulatory burdens on the construction, operation, and maintenance of gas transmission, distribution, and gathering pipeline systems. The amendments also modified the monetary threshold for reporting to PHMSA incidents that result in property damage from $50,000 to $122,000.
In July 2018, PHMSA issued an advance notice of proposed rulemaking seeking comment on the class location requirements for natural gas transmission pipelines, and particularly the actions operators must take when class locations change due to population growth or building construction near the pipeline. The associated notice of proposed rulemaking,
issued October 14, 2020, proposes an integrity management alternative for managing class location changes in areas that increase in population above a defined threshold.
In October 2019, PHMSA issued three new final rules. One rule, effective in December 2019, establishes procedures to implement the expanded emergency order enforcement authority set forth in an October 2016 interim final rule. Among other things, this rule allows PHMSA to issue an emergency order without advance notice or opportunity for a hearing. The other two rules, effective in July 2020, impose several new requirements on operators of onshore gas transmission systems and hazardous liquids pipelines. The rule concerning gas transmission extends the requirement to conduct integrity assessments beyond HCAs to pipelines in Moderate Consequence Areas (“MCAs”). It also includes requirements to reconfirm Maximum Allowable Operating Pressure (“MAOP”), report MAOP exceedances, consider seismicity as a risk factor in integrity management, and use certain safety features on in-line inspection equipment. The rule concerning hazardous liquids extends the required use of leak detection systems beyond HCAs to all regulated non-gathering hazardous liquid pipelines, requires reporting for gravity fed lines and unregulated gathering lines, requires periodic inspection of all lines not in HCAs, calls for inspections of lines after extreme weather events, and adds a requirement to make all lines in or affecting HCAs capable of accommodating in-line inspection tools over the next 20 years.
In addition, PHMSA has taken recent action to regulate gathering systems, which includes integrity management requirements. In November 2021, PHMSA issued a final rule that extended pipeline safety requirements to onshore gas gathering pipelines. The rule requires all onshore gas gathering pipeline operators to comply with PHMSA’s incident and annual reporting requirements. It also extends existing pipeline safety requirements to a new category of gas gathering pipelines, “Type C” lines, which generally include high-pressure pipelines that are larger than 8.625 inches in diameter. Safety requirements applicable to Type C lines vary based on pipeline diameter and potential failure consequences. The final rule becomes effective in May 2022 and operators must comply with the applicable safety requirements by November 2022.
At the state level, several states have passed legislation or promulgated rules dealing with pipeline safety. We believe that our pipeline operations are in substantial compliance with applicable PHMSA and state requirements; however, due to the possibility of new or amended laws and regulations or reinterpretation of existing laws and regulations, there can be no assurance that future compliance with PHMSA or state requirements will not have a material adverse effect on our financial condition, results of operations, or cash flows.
Environmental Matters
Recent Developments. On January 20, 2021, the Biden Administration came into office and immediately issued a number of executive orders related to environmental matters that could affect our operations and those of our customers, including an Executive Order on “Protecting Public Health and the Environment and Restoring Science to Tackle the Climate Crisis” seeking to adopt new regulations and policies to address climate change and suspend, revise, or rescind, prior agency actions that are identified as conflicting with the Biden Administration’s climate policies. Among the areas that could be affected by the review are regulations addressing methane emissions and the part of the extraction process known as hydraulic fracturing. The Biden Administration has also issued other orders that could ultimately affect our business, such as the executive order rejoining the Paris Agreement. As part of rejoining the Paris Agreement, the Biden Administration announced that the United States would commit to a 50 to 52 percent reduction from 2005 levels of GHG emissions by 2030, and set the goal of reaching net-zero GHG emissions by 2050. The Biden Administration could seek, in the future, to put into place additional executive orders, policy and regulatory reviews, and seek to have Congress pass legislation that could adversely affect the production of oil and gas assets and our operations and those of our customers.
General. Our operations involve processing and pipeline services for delivery of hydrocarbons (natural gas, NGLs, crude oil, and condensates) from point-of-origin at crude oil and gas wellheads operated by our suppliers to our end-use market customers. Our facilities include natural gas processing and fractionation plants, natural gas and NGL storage caverns, brine disposal wells, pipelines and associated facilities, fractionation and storage units for NGLs, and transportation and delivery of hydrocarbons. As with all companies in our industrial sector, our operations are subject to stringent and complex federal, state, and local laws and regulations relating to the discharge of hazardous substances or solid wastes into the environment or otherwise relating to protection of the environment. Compliance with existing and anticipated environmental laws and regulations increases our overall costs of doing business, including costs of planning, constructing, and operating plants, pipelines, and other facilities, as well as capital expenditures necessary to maintain or upgrade equipment and facilities. Similar costs are likely upon changes in laws or regulations and upon any future acquisition of operating assets.
Any failure to comply with applicable environmental laws and regulations, including those relating to equipment failures, and obtaining required governmental approvals and permits, may result in the assessment of administrative, civil, or criminal penalties, imposition of investigatory or remedial activities, and, in certain, less common circumstances, issuance of temporary
or permanent injunctions, or construction or operation bans or delays. As part of the regular evaluation of our operations, we routinely review and update governmental approvals as necessary.
The continuing trend in environmental regulation is to place more restrictions and limitations on activities that may affect the environment, and thus there can be no assurance as to the amount or timing of future expenditures for environmental compliance or remediation, and actual future expenditures may be different from the amounts we currently anticipate. Moreover, risks of process upsets, accidental releases, or spills are associated with possible future operations, and we cannot assure you that we will not incur significant costs and liabilities, including those relating to claims for damage to the environment, property, and persons as a result of any such upsets, releases, or spills. We may be unable to pass on current or future environmental costs to our customers. A discharge or release of hydrocarbons, hazardous substances, or solid wastes into the environment could, to the extent losses related to the event are not insured, subject us to substantial expense, including both the cost to comply with applicable laws and regulations and to pay fines or penalties that may be assessed and the cost related to claims made by neighboring landowners and other third parties for personal injury or damage to natural resources or property. We attempt to anticipate future regulatory requirements that might be imposed and plan accordingly to comply with changing environmental laws and regulations and to minimize costs with respect to more stringent future laws and regulations or more rigorous enforcement of existing laws and regulations.
Hazardous Substances and Solid Waste. Environmental laws and regulations that relate to the release of hazardous substances or solid wastes into soils, sediments, groundwater, and surface water and/or include measures to prevent and control pollution may pose significant costs to our industrial sector. These laws and regulations generally regulate the generation, storage, treatment, transportation, and disposal of solid wastes and hazardous substances and may require investigatory and corrective actions at facilities where such waste or substance may have been released or disposed. For instance, the Comprehensive Environmental Response, Compensation, and Liability Act (“CERCLA”), also known as the federal “Superfund” law, and comparable state laws impose liability without regard to fault or the legality of the original conduct on certain classes of persons that contributed to a release of a “hazardous substance” into the environment. Potentially responsible parties include the owner or operator of the site where a release occurred and companies that disposed or arranged for the disposal of the hazardous substances found at an off-site location, such as a landfill. Under CERCLA, these persons may be subject to joint and several liability for the costs of cleaning up and restoring sites where hazardous substances have been released into the environment and for damages to natural resources. CERCLA also authorizes the U.S. Environmental Protection Agency (“EPA”) and, in some cases, third parties, to take actions in response to threats to public health or the environment and to seek recovery of costs they incur from the potentially responsible classes of persons. It is not uncommon for neighboring landowners and other third parties to file claims for personal injury and property damage allegedly caused by hazardous substances or solid wastes released into the environment. Although petroleum, natural gas, and NGLs are excluded from CERCLA’s definition of a “hazardous substance,” in the course of ordinary operations, we may generate wastes that may fall within the definition of a “hazardous substance.” In addition, there are other laws and regulations that can create liability for releases of petroleum, natural gas, or NGLs. Moreover, we may be responsible under CERCLA or other laws for all or part of the costs required to clean up sites at which such substances have been disposed. We have not received any notification that we may be potentially responsible for cleanup costs under CERCLA or any analogous federal, state, or local law.
We also generate, and may in the future generate, both hazardous and nonhazardous solid wastes that are subject to requirements of the federal Resource Conservation and Recovery Act (“RCRA”) and/or comparable state statutes. From time to time, the EPA and state regulatory agencies have considered the adoption of stricter disposal standards for nonhazardous wastes, including crude oil, condensate, and natural gas wastes. Moreover, it is possible that some wastes generated by us that are currently exempted from the definition of hazardous waste may in the future lose this exemption and be designated as “hazardous wastes,” resulting in the wastes being subject to more rigorous and costly management and disposal requirements. Additionally, the Toxic Substances Control Act (“TSCA”) and analogous state laws impose requirements on the use, storage, and disposal of various chemicals and chemical substances. Changes in applicable laws or regulations may result in an increase in our capital expenditures or plant operating expenses or otherwise impose limits or restrictions on our production and operations.
We currently own or lease, have in the past owned or leased, and in the future may own or lease, properties that have been used over the years for brine disposal operations, crude oil and condensate transportation, natural gas gathering, treating, or processing and for NGL fractionation, transportation, or storage. Solid waste disposal practices within the NGL industry and other oil and natural gas related industries have improved over the years with the passage and implementation of various environmental laws and regulations. Nevertheless, some hydrocarbons and other solid wastes may have been released on or under various properties owned, leased, or operated by us during the operating history of those properties. In addition, a number of these properties may have been operated by third parties over whose operations and hydrocarbon and waste management practices we had no control. These properties and wastes disposed thereon may be subject to the SWDA, CERCLA, RCRA,
TSCA, and analogous state laws. Under these laws, we could be required, alone or in participation with others, to remove or remediate previously disposed wastes or property contamination, if present, including groundwater contamination, or to take action to prevent future contamination.
Air Emissions. Our current and future operations are subject to the federal Clean Air Act and regulations promulgated thereunder and under comparable state laws and regulations. These laws and regulations regulate emissions of air pollutants from various industrial sources, including our facilities, and impose various control, monitoring, and reporting requirements. Pursuant to these laws and regulations, we may be required to obtain environmental agency pre-approval for the construction or modification of certain projects or facilities expected to produce air emissions or result in an increase in existing air emissions, obtain and comply with the terms of air permits, which include various emission and operational limitations, or use specific emission control technologies to limit emissions. We likely will be required to incur certain capital expenditures in the future for air pollution control equipment in connection with maintaining or obtaining governmental approvals addressing air emission-related issues. Failure to comply with applicable air statutes or regulations may lead to the assessment of administrative, civil, or criminal penalties and may result in the limitation or cessation of construction or operation of certain air emission sources or require us to incur additional capital expenditures. Although we can give no assurances, we believe such requirements will not have a material adverse effect on our financial condition, results of operations, or cash flows, and the requirements are not expected to be more burdensome to us than to any similarly situated company.
In addition, the EPA included Wise County, the location of our Bridgeport facility, in its January 2012 revision to the Dallas-Fort Worth ozone nonattainment area (“DFW area”) for the 2008 revised ozone national ambient air quality standard (“NAAQS”). Effective September 23, 2019, the DFW area was reclassified to a serious nonattainment area under this standard, potentially requiring the state to adopt more stringent permitting requirements. Under the area’s serious nonattainment designation, new major sources in Wise County, meaning sources that emit greater than 50 tons/year of nitrogen oxides (“NOx”) and volatile organic compounds (“VOCs”), as well as major modifications of existing facilities in the county resulting in net emissions increases of greater than 25 tons/year of NOx or VOCs, are subject to more stringent new source review (“NSR”) pre-construction permitting requirements than they would be in an area that is in attainment with the 2008 ozone NAAQS. NSR pre-construction permits can take twelve to eighteen months to obtain and require the permit applicant to offset the proposed emission increases with reductions elsewhere at a 1.2 to 1 ratio. The attainment date for serious nonattainment areas was July 20, 2021, with a 2020 attainment year. The DFW area did not comply with the 2008 ozone NAAQs by the end of 2020 and thus risks reclassification to severe nonattainment. Reclassification for the DFW area is anticipated in early 2022.
In October 2015, the EPA promulgated a new NAAQS for ozone of 70 parts per billion (“ppb”) for both the 8-hour primary and secondary standards, down from the 75 ppb standards of the 2008 ozone NAAQS. On June 4, 2018, EPA designated the DFW area, including Wise County, as a marginal nonattainment area under this standard. EPA published a final rule to implement the 2015 ozone NAAQS on December 6, 2018. The area’s marginal classification does not require the additional control measures to be implemented. The DFW Area, however, failed to attain this standard by its marginal attainment date of August 2021, and now risks reclassification to moderate nonattainment, which could result in stricter permitting requirements, delay or prohibit our ability to obtain such permits, and result in potentially significant expenditures for pollution control equipment. Furthermore, the area remains subject to the requirements associated with its serious classification under the 2008 standard notwithstanding its marginal classification under the 2015 standard. The 2015 standards were challenged before the U.S. Court of Appeals for the D.C. Circuit. On August 23, 2019, the D.C. Circuit upheld the EPA’s primary ozone standard and remanded the secondary standard to EPA for reconsideration. The implementation of these standards could result in stricter permitting requirements, delays or prohibitions on our ability to obtain such permits, and result in potentially significant expenditures for pollution control equipment. Reclassification for the DFW area is anticipated in early 2022.
The EPA reviewed the 2015 NAAQS standard in 2020 but decided to retain the standard without revision. EPA, however, recently announced that it intends to reconsider the 2020 decision to retain the 2015 NAAQS standards. To the extent that EPA’s reconsideration results in a new standard, the new standard could cause stricter permitting requirements, delays or prohibitions on our ability to obtain such permits, and result in potentially significant expenditures for pollution control equipment. Furthermore, the area remains subject to the requirements associated with its serious classification under the 2008 standard notwithstanding its marginal classification under the 2015 standard.
Effective May 15, 2012, the EPA promulgated rules under the Clean Air Act that established new air emission controls for oil and natural gas production, pipelines, and processing operations under the New Source Performance Standards (“NSPS”) and National Emission Standards for Hazardous Air Pollutants (“NESHAPs”) programs. These rules require the control of emissions through reduced emission (or “green”) completions and establish specific new requirements regarding emissions from wet seal and reciprocating compressors, pneumatic controllers, and storage vessels at production facilities, gathering systems, boosting facilities, and onshore natural gas processing plants. In addition, the rules revised existing requirements for VOC emissions from equipment leaks at onshore natural gas processing plants by lowering the leak definition for valves from
10,000 parts per million to 500 parts per million and requiring the monitoring of connectors, pumps, pressure relief devices, and open-ended lines. These rules required a number of modifications to our assets and operations. In October 2012, several challenges to the EPA’s NSPS and NESHAPs rules for the industry were filed by various parties, including environmental groups, and industry associations. In a January 16, 2013 unopposed motion to hold this litigation in abeyance, the EPA indicated that it may reconsider some aspects of the rules. The case remains in abeyance. The EPA has since revised certain aspects of the rules.
In partial response to the issues raised regarding the 2012 rulemaking, the EPA finalized new rules that took effect August 2, 2016 to regulate emissions of methane and VOCs from new and modified sources in the oil and gas sector under the NSPS. In September 2020, the EPA published two additional final rules, the 2020 Policy Rule and the 2020 Technical Amendments. The 2020 Policy Rule removed sources in the transmission and storage segment from the regulated source category of the 2016 NSPS, rescinded the NSPS (including both VOC and methane requirements) applicable to those sources, and rescinded the methane-specific requirements of the NSPS applicable to sources in the production and processing segments. On January 21, 2021, President Biden issued an Executive Order on “Protecting Public Health and the Environment and Restoring Science to Tackle the Climate Crisis” directing EPA to consider publishing for notice and comment, by September 2021, a proposed rule suspending, revising, or rescinding the 2020 NSPS for the oil and natural gas sector, and on June 30, 2021, President Biden signed a joint congressional resolution rescinding the 2020 Policy rule. In November 2021, the EPA proposed a new rule targeting methane and VOC emissions from new and existing oil and gas sources, including sources in the production, processing, transmission, and storage segments. The proposed rule would: (1) update NSPS subpart OOOOa; (2) adopt a new NSPS subpart OOOOb for sources that commence construction, modification, or reconstruction after the date the proposed rule is published in the Federal Register; and (3) adopt a new NSPS subpart OOOOc to establish emissions guidelines, which will inform state plans to establish standards for existing sources. If finalized, these increasingly stringent requirements, or the application of new requirements to existing facilities, could result in additional restrictions on operations and increased compliance costs for us or our customers. The Company had previously complied with these regulations during the Obama administration and does not expect the reinstatement to have a material effect on the Company or its operations.
In June 2016, the EPA also finalized a rule regarding alternative criteria for aggregating multiple small surface sites into a single source for air quality permitting purposes. This rule could cause small facilities within one-quarter mile of one another to be deemed a major source on an aggregate basis, thereby triggering more stringent air permitting processes and requirements across the oil and gas industry. EPA draft guidance issued in September 2018 clarified that this rule pertains to the oil and gas industry.
Other federal agencies have also taken steps to impose new or more stringent regulations on the oil and gas sector in order to further reduce methane emissions. For example, the BLM adopted new rules, effective January 17, 2017, to reduce venting, flaring, and leaks during oil and natural gas production activities on onshore federal and Indian leases. Certain provisions of the BLM rule went into effect in January 2017, while the effective date of others was delayed until 2019 pending reconsideration. In September 2018, BLM published a final rule that rescinded several requirements of the 2016 methane rules. The September 2018 rule was challenged in the U.S. District Court for the Northern District of California almost immediately after issuance. In July 2020, the U.S. District Court for the Northern District of California vacated BLM’s 2018 revision rule. Additionally, in October 2020, a Wyoming federal district judge vacated the 2016 venting and flaring rule. In December 2020, environmental groups appealed the October 2020 decision, and litigation is ongoing. As a result of this continued regulatory focus and other factors, additional GHG regulation of the oil and gas industry remains possible. Compliance with such rules could result in additional costs, including increased capital expenditures and operating costs for us and for other companies in our industry. While we are not able at this time to estimate such additional costs, as is the case with similarly situated entities in the industry, they could be significant for us. Compliance with such rules, as well as any new state rules, may also make it more difficult for our suppliers and customers to operate, thereby reducing the volume of natural gas transported through our pipelines, which may adversely affect our business. However, the status of recent and future rules and rulemaking initiatives under the Biden Administration remains uncertain.
Climate Change. In December 2009, the EPA determined that emissions of certain gases, commonly referred to as “greenhouse gases,” present an endangerment to public health and the environment because emissions of such gases are, according to the EPA, contributing to the warming of the earth’s atmosphere and other climatic changes. Based on these findings, the EPA adopted regulations under existing provisions of the federal Clean Air Act that require Prevention of Significant Deterioration (“PSD”) pre-construction permits and Title V operating permits for greenhouse gas emissions from certain large stationary sources. Under these regulations, facilities required to obtain PSD permits must meet “best available control technology” standards for their greenhouse gas emissions established by the states or, in some cases, by the EPA on a case by case basis. The EPA has also adopted rules requiring the monitoring and reporting of greenhouse gas emissions from specified sources in the United States, including, among others, certain onshore oil and natural gas processing and fractionating facilities. In addition, on January 21, 2021, President Biden issued an Executive Order on “Protecting Public Health and the Environment and Restoring Science to Tackle the Climate Crisis” seeking to adopt new regulations and policies to address
climate change and suspend, revise, or rescind, prior agency actions that are identified as conflicting with the Biden Administration’s climate policies.
In addition, efforts have been made and continue to be made in the international community toward the adoption of international treaties or protocols that would address global climate change issues. Because regulation of greenhouse gas emissions is relatively new, further regulatory, legislative, and judicial developments are likely to occur. Such developments in greenhouse gas initiatives may affect us and other companies operating in the oil and gas industry. In addition to these developments, recent judicial decisions have allowed certain tort claims alleging property damage to proceed against greenhouse gas emissions sources, which may increase our litigation risk for such claims. In addition, in 2015, the United States participated in the United Nations Conference on Climate Change, which led to the creation of the Paris Agreement. The Paris Agreement entered into force November 4, 2016, and requires countries to review and “represent a progression” in their intended nationally determined contributions, which set GHG emission reduction goals every five years beginning in 2020. In November 2019, the State Department formally informed the United Nations of the United States’ withdrawal from the Paris Agreement and withdrew from the agreement in November 2020. However, on January 20, 2021, President Biden signed an instrument that reverses this withdrawal, and the United States will formally re-join the Paris Agreement on February 19, 2021. As part of rejoining the Paris Agreement, President Biden announced that the United States would commit to a 50 to 52 percent reduction from 2005 levels of GHG emissions by 2030 and set the goal of reaching net-zero GHG emissions by 2050. Due to the uncertainties surrounding the regulation of and other risks associated with greenhouse gas emissions, we cannot predict the financial impact of related developments on us.
Federal or state legislative or regulatory initiatives that regulate or restrict emissions of greenhouse gases in areas in which we conduct business could adversely affect the availability of, or demand for, the products we store, transport, and process, and, depending on the particular program adopted, could increase the costs of our operations, including costs to operate and maintain our facilities, install new emission controls on our facilities, acquire allowances to authorize our greenhouse gas emissions, pay any taxes related to our greenhouse gas emissions, and/or administer and manage a greenhouse gas emissions program. We may be unable to recover any such lost revenues or increased costs in the rates we charge our customers, and any such recovery may depend on events beyond our control, including the outcome of future rate proceedings before FERC or state regulatory agencies and the provisions of any final legislation or regulations. Reductions in our revenues or increases in our expenses as a result of climate control initiatives could have adverse effects on our business, financial condition, results of operations, or cash flows.
Due to their location, our operations along the Gulf Coast are vulnerable to operational and structural damages resulting from hurricanes and other severe weather systems, while inland operations include areas subject to tornadoes. Our insurance may not cover all associated losses. We are taking steps to mitigate physical risks from storms, but no assurance can be given that future storms will not have a material adverse effect on our business.
Hydraulic Fracturing and Wastewater. The Federal Water Pollution Control Act, also known as the Clean Water Act, and comparable state laws impose restrictions and strict controls regarding the discharge of pollutants, including NGL-related wastes, into state waters or waters of the United States. In June 2015, the EPA and the U.S. Army Corps of Engineers (“USACE”) finalized a rule intended to clarify the meaning of the term “waters of the United States,” (“WOTUS”) which establishes the scope of regulated waters under the Clean Water Act. The rule has been challenged and was stayed by federal courts. If upheld, the rule is expected to expand federal jurisdiction under the Clean Water Act. On February 6, 2018, EPA and USACE published a final rule to postpone the effectiveness of the WOTUS rule until February 6, 2020. The February 2018 delay rule is subject to pending judicial challenges in multiple federal district courts. In October 2019, EPA and USACE issued a final rule that repealed the 2015 WOTUS definition and reinstated the agencies’ narrower pre-2015 scope of federal CWA jurisdiction. In April 2020, EPA and USACE issued a new final WOTUS definition that continues to provide a narrower scope of federal CWA jurisdiction than contemplated under the 2015 WOTUS definition, while also providing for greater predictability and consistency of federal CWA jurisdiction. Judicial challenges to EPA’s 2015 WOTUS definition, the October 2019 repeal rule and the April 2020 final rule are currently before multiple federal district courts. Additionally, the rules are among agency actions listed for review in accordance with President Biden’s January 20, 2021 Executive Order: “Protecting Public Health and the Environment and Restoring Science to Tackle the Climate Crisis.”
On August 30, 2021, the U.S. District Court for the District of Arizona vacated and remanded the April 2020 final rule. Following the August 30, 2021 decision, EPA and USACE ceased implementing the April 2020 final rule, and on December 7, 2021, published a proposed rule titled the “Revised Definition of ‘Waters of the United States.’” The proposed rule provides that EPA and USACE will began interpreting the WOTUS definition consistent with the Pre-2015 regulatory regime, generally referred to as the “1986 definition,” subject to some amendments that reflect the agencies’ interpretation of the statutory limits on the WOTUS definition and Supreme Court precedent. The proposed rule, if finalized, would be expected to significantly expand federal jurisdiction as compared to the April 2020 final rule, and as such, we could face increased costs and delays with respect to obtaining permits for activities in jurisdictional waters, including wetlands. Regulations promulgated pursuant to the Clean Water Act require that entities that discharge into federal and state waters obtain National Pollutant Discharge
Elimination System permits and/or state permits authorizing these discharges. The Clean Water Act and analogous state laws assess administrative, civil, and criminal penalties for discharges of unauthorized pollutants into the water and impose substantial liability for the costs of removing spills from such waters. In addition, the Clean Water Act and analogous state laws require that individual permits or coverage under general permits be obtained by covered facilities for discharges of storm water runoff. We believe that we are in substantial compliance with Clean Water Act permitting requirements as well as the conditions imposed by our permits and that continued compliance with such existing permit conditions will not have a material effect on our financial condition, results of operations, or cash flows.
We operate brine disposal wells that are regulated as Class II wells under the SDWA. The SDWA imposes requirements on owners and operators of Class II wells through the EPA’s Underground Injection Control program, including construction, operating, monitoring and testing, reporting, and closure requirements. Our brine disposal wells are also subject to comparable state laws and regulations, which in some cases are more stringent than requirements under the SDWA, such as the Ohio Department of Natural Resources (“ODNR”) rules that took effect October 1, 2012. These rules set more stringent standards for the permitting and operating of brine disposal wells, including extensive review of geologic data and use of state-of-the-art technology. The ODNR also imposes requirements on the transportation and disposal of brine. Compliance with current and future laws and regulations regarding our brine disposal wells may impose substantial costs and restrictions on our brine disposal operations, as well as adversely affect demand for our brine disposal services. State and federal regulatory agencies recently have focused on a possible connection between the operation of injection wells used for oil and gas waste waters and an observed increase in minor seismic activity and tremors. When caused by human activity, such events are called induced seismicity. In a few instances, operators of injection wells in the vicinity of minor seismic events have reduced injection volumes or suspended operations, often voluntarily. A 2012 report published by the National Academy of Sciences concluded that only a very small fraction of the tens of thousands of injection wells have been suspected to be, or have been, the likely cause of induced seismicity. However, some state regulatory agencies have modified their regulations to account for induced seismicity. For example, TRRC rules allow the TRRC to modify, suspend, or terminate a permit based on a determination that the permitted activity is likely to be contributing to seismic activity. In the state of Ohio, the ODNR requires a seismic study prior to the authorization of any new disposal well. In addition, the ODNR has instituted a continuous monitoring network of seismographs and is able to curtail injected volumes regionally based upon seismic activity detected. The Oklahoma Corporation Commission (“OCC”) has also taken steps to focus on induced seismicity, including increasing the frequency of required recordkeeping for wells that dispose into certain formations and considering seismic information in permitting decisions. For instance, on August 3, 2015, the OCC adopted a plan calling for mandatory reductions in oil and gas wastewater disposal well volumes, the implementation of which has involved reductions of injection or shut-ins of disposal wells. The OCC also released well completion seismicity guidelines in December 2016 for operators in the STACK play that call for hydraulic fracturing operations to be suspended following earthquakes of certain magnitudes in the vicinity. Regulatory agencies are continuing to study possible linkage between injection activity and induced seismicity. To the extent these studies result in additional regulation of injection wells, such regulations could impose additional regulations, costs, and restrictions on our brine disposal operations. Such regulations could also affect our customers’ injection well operations and, therefore, impact our gathering business.
It is common for our customers or suppliers to recover natural gas from deep shale formations through the use of hydraulic fracturing, combined with sophisticated horizontal drilling. Hydraulic fracturing is an important and commonly used process in the completion of wells by oil and gas producers. Hydraulic fracturing involves the injection of water, sand, and chemical additives under pressure into rock formations to stimulate gas production. Due to public concerns raised regarding potential impacts of hydraulic fracturing on groundwater quality, legislative, and regulatory efforts at the federal level and in some states and localities have been initiated to require or make more stringent the permitting and other regulatory requirements for hydraulic fracturing operations of our customers and suppliers. There are certain governmental reviews either underway or being proposed that focus on environmental aspects of hydraulic fracturing practices. On December 13, 2016, the EPA released a study of the potential adverse effects that hydraulic fracturing may have on water quality and public health, concluding that there is scientific evidence that hydraulic fracturing activities potentially can impact drinking water resources in the United States under some circumstances. This study or similar studies could spur initiatives to further regulate hydraulic fracturing. In June 2016, the EPA finalized rules prohibiting discharges of wastewater from hydraulic fracturing operations to publicly owned wastewater treatment plants. Also, effective June 24, 2015, BLM adopted rules regarding well stimulation, chemical disclosures, water management, and other requirements for hydraulic fracturing on federal and American Indian lands. A federal district court invalidated these BLM rules in June 2016, but they were reinstated on appeal by the U.S. Court of Appeals for the Tenth Circuit in September 2017. In December 2017, BLM published a final rule rescinding the 2015 BLM rules. The final rule was challenged in the U.S. District Court for the Northern District of California almost immediately after issuance. On March 27, 2020, the District Court upheld the BLM’s rescission of the 2015 rules. This decision is pending appeal in the U.S. Court of Appeals for the Ninth Circuit. Reinstatement of the 2015 BLM rules, or the adoption of additional regulatory burdens in the future, whether federal, state, or local, could increase the cost of or restrict the ability of our customers or suppliers to perform hydraulic fracturing. As a result, any increased federal, state, or local regulation could reduce the volumes of natural
gas that our customers move through our gathering systems which would materially adversely affect our financial condition, results of operations, or cash flows.
Endangered Species and Migratory Birds. The Endangered Species Act (“ESA”), Migratory Bird Treaty Act (“MBTA”), and similar state and local laws restrict activities that may affect endangered or threatened species or their habitats or migratory birds. Some of our pipelines may be located in areas that are designated as habitats for endangered or threatened species, potentially exposing us to liability for impacts on an individual member of a species or to habitat. The ESA can also make it more difficult to secure a federal permit for a new pipeline.
Office Facilities
We lease approximately 157,600 square feet of space at our executive offices in Dallas, Texas under a lease expiring in February 2030. We also lease office space of approximately 56,000 square feet in Midland, Texas, and 47,500 square feet in Houston, Texas under long-term leases, and various other locations to support our operations.
Human Capital
As of December 31, 2021, we (through our subsidiaries) employed 1,073 full-time employees. Of these employees, 249 were general and administrative, engineering, accounting, and commercial personnel, and the remainder were operational employees. We are not party to any collective bargaining agreements, and we have not had any significant labor disputes in the past. We believe that we have good relations with our employees.
One of our core values is a “focus on people.” We strive to provide our employees with a rewarding work environment, including the opportunity for success and a platform for personal and professional development. We are committed to providing a working environment that empowers our employees, allows them to execute at their highest potential, keeps them safe, and promotes their professional growth. We offer a competitive total rewards program to our employees. Our total rewards program is comprised of base salary, short-term incentives tied to our performance, comprehensive employee benefits that include medical and dental coverage, company-paid life insurance, disability coverage, and paid parental leave for both birth and non-birth parents. We also offer a 401(k) program, which includes fully-vested employer matched contributions. We believe that our values, rewarding work environment, and competitive pay help us retain our employees and minimize employee turnover in a very challenging personnel market. Our employees have an average tenure of eight years and voluntary turnover rates over the last three years have remained relatively flat, averaging approximately 9% per year.
The safety of our employees is a key management priority. We strive to promote a safety-centric culture, including linking a portion of short-term incentive compensation for our employees to our safety standards and performance. We also maintain strict safety protocols and require quarterly safety training for all field employees and annual safety training for corporate employees. During 2021, EnLink had its best safety year on record. We assess the effectiveness of our safety record by closely monitoring various measures, including our Total Recordable Incident Rate (“TRIR”), which is an industry standard measurement of safety. In 2021, we had a TRIR of 0.44, representing the lowest number of employee reportable incidents in our history. We also require annual safety training by every employee. Additional hours of safety training are required for field personnel. During 2021, our employees completed approximately 8,000 online courses comprising more than 8,500 hours of compliance-based training. In addition, our employees completed over 4,500 hours of required safety training.
We also see value in having a diverse and inclusive environment. We have a Diversity, Equity, and Inclusion Action Team, which is responsible for helping us to promote and foster a welcoming, open, and diverse workplace, and whose members are drawn from throughout the company. As of December 31, 2021, women represented approximately 39% of the positions at our corporate offices in Dallas and Houston and held approximately 36% of all manager and above positions in those offices. At the same date, minorities represented approximately 26% of the manager and above positions at our corporate offices in Dallas and Houston and held approximately 20% of all manager and above positions company-wide. Additionally, women and minorities constituted 29% of all officers company-wide. We also require annual anti-harassment and discrimination training for all employees, and, in 2021, all people managers completed inclusive leadership training.
For more information on our employee initiatives, see the “Our People” section of our Sustainability Report (located on our website at www.enlink.com) regarding our Human Capital programs and initiatives. In addition, see “General and Recent Developments—Current Market Environment” for more information regarding our actions to prioritize the health and safety of our employees with respect to the COVID-19 pandemic. Information included in our Sustainability Report or otherwise included on our website is not incorporated into this Annual Report on Form 10-K.
Sustainability
We strive for sustainable business practices, including safe, responsible and ethical operations, respect for the environment, a focus on customers, and support for our team of employees. We maximize safe operations of our assets by focusing on mitigating risk, routinely increasing knowledge and skills of our employees, improving our processes, and measuring our performance. We link a portion of short-term incentive compensation for our employees to our safety standards and performance in order to promote a safety-centric culture. We also operate our assets and construct new facilities to minimize our footprint and environmental impact, control pollution, and conserve resources. We focus on serving our customers safely and reliability and providing the highest level of service through innovation and continuous improvement processes in our business. We support our employees by providing competitive pay and benefits, training, and a respectful and inclusive culture.
We have a standing Sustainability Committee (“Sustainability Committee”) of the Board of Directors of the Managing Member (the “Board”), which assists the Board in its general oversight of our environmental, social, and governance initiatives, including our environmental, health and safety, and operational excellence initiatives, and also provides oversight with respect to identifying, evaluating, and monitoring of risks associated with such matters. We have also formed an executive sponsored, cross-functional committee, comprised of leaders from various departments of our company, to put into action our sustainable business practices. In addition, we publish an annual sustainability report, which provides both accountability to us regarding sustainable business practices as well as transparency to our stakeholders regarding our progress toward becoming a more sustainable company. Our most recent sustainability report can be found on our website (www.enlink.com). Information included in our Sustainability Report or otherwise included on our website is not incorporated into this Annual Report on Form 10-K.
Environmental Responsibility
We strive for safe operations that minimize our environmental impact. We demonstrate that objective by complying with applicable environmental laws, focusing on prevention of spills and emissions of unpermitted substances into the atmosphere, reducing our impact on land, waterways, and wildlife habitats, and managing our resource consumption to minimize waste. We have also adopted technologies that support the continuous improvement of our operations to minimize their environmental impact.
We work to operate our assets in a way that maximizes their usefulness, reliability, and safe operations, including through the use of smart tool runs, pressure testing, cathodic protection and robust corrosion management, and routine tests of our assets. We utilize the latest technology to monitor and operate our pipeline systems, such as leak detection monitoring software and vibration monitoring of our compressor stations, which accelerates response time to potential incidents and increases our reliability. We also hold safety trainings for our employees each month and require employees to attend based on their job position.
We attempt to minimize our environmental impact through our operations. Many of our facilities are self-powered, generating energy from the hydrocarbons being processed and reducing the need for public grid connection. We also employ processes that allow us to repurpose exhaust heat, a byproduct of operations, for warming purposes required elsewhere in our process. We utilize solar capabilities to power our methanol pumps, meter stations, and line operating data gathering stations, reducing our need for additional power. We maintain a robust leak detection and repair program and have implemented infrared optical gas image surveys at most of our facilities. To improve emissions performance and operational efficiency, we replaced flares with thermal oxidizers at many of our plants, and we installed vapor recovery units and exhaust catalysts and rerouted compressor blowdown gas back into our system at many of our compressor stations and we continue to make similar changes to our operations, from time to time, to minimize our environmental impact.
We also reuse our resources to limit our waste production. We focus on repurposing and refurnishing idle materials and equipment to be used in new ways at other facilities, including meters, filter separators, compressors, treaters, scrubbers, dehydration systems, amine systems, process vessels, cylinders, valves, pipe, tanks, and pig traps.
We seek to minimize impacts from the construction of our facilities and other operations as well. We first identify site options during the project planning phase to avoid wetlands, habitats, and other environmentally sensitive areas, when possible. Once operational, we partner closely with regulatory agencies to ensure we are compliant with environmental regulations. We also generally restore land to preconstruction conditions, often beyond the footprint that we utilize.
We also seek to minimize the CO2 emissions in our operations. In May 2021, we announced our intention to reach net zero
greenhouse gas emissions by 2050, positioning us among industry leaders in sustainability. We plan to execute substantial
emissions reduction strategies that will systematically move EnLink toward a net zero goal, including achieving a 30%
reduction in methane emissions intensity by 2024 and a path to reach a 30% reduction in total CO2-equivalent emissions
intensity levels by 2030, both as compared to 2020 levels. In November 2021, we entered into an agreement with Continental Carbonic Products, Inc., a wholly owned subsidiary of Matheson Tri-Gas, Inc., and member of the Nippon Sanso Holdings Corporation group of companies, to capture and sell CO2 emitted from our Bridgeport processing plant in North Texas. The
CO2 will be sold on a firm basis for 15 years and will be converted into food-grade products. This project is expected to be in service in early 2024. The project makes meaningful progress toward our goal of a 30% reduction in total CO2-equivalent emissions intensity by 2030, while being modestly profitable.
Social Responsibility
We provide our employees with a rewarding work environment, providing a platform for personal and professional development. We focus on providing a working environment that empowers, and invests in, our employees. We often participate in community events throughout our area of operations each year, and we encourage our employees to participate in at least one community service project each year.
We provide competitive pay packages that support the financial security of our employees and help attract and retain top talent. For more information on our employee initiatives, see “Item 1. Business—Human Capital” in this report.
Governance
The Board includes directors with extensive energy, finance, sustainability, and public company governance experience. The compensation of our executives is determined and approved by the Board and by the Governance and Compensation Committee (the “Compensation Committee”) of the Board, which Compensation Committee includes independent directors. The determination of executive compensation includes an analysis of the evolving demands of the industry, assessment of individual contributions to the business strategy, and an in-depth comparison of the compensation practices of a defined peer company group. We foster a strong culture of ownership among our executives and align the interests of our leaders with those of our stakeholders by tying a large portion of the short-term and long-term compensation of our executives to the performance of the company.
We require our employees to complete annual training courses related to our corporate policies, including our Code of Business Conduct and Ethics, which outlines our requirements to maintain a work culture based on integrity, ethics, and safe and fair business dealings. We also identify and prioritize the risks associated with our business each quarter through our enterprise risk management program, conducted by leaders throughout our business. We identify top risks to our business and regularly review them with the Board and its committees, including the Sustainability Committee, and through biannual meetings held with the Audit Committee.
Item 1A. Risk Factors
The following risk factors and all other information contained in this report should be considered carefully when evaluating us. These risk factors could affect our actual results. Other risks and uncertainties, in addition to those that are described below, may also impair our business operations. If any of the following risks occur, our business, financial condition, results of operations, or cash flows (including our ability to make distributions to our unitholders and noteholders) could be affected materially and adversely. In that case, we may be unable to make distributions to our unitholders and the trading price of our common units could decline. In this report, the terms “Company” or “Registrant,” as well as the terms “ENLC,” “our,” “we,” “us” or like terms, are sometimes used to refer to EnLink Midstream, LLC itself or EnLink Midstream, LLC and its consolidated subsidiaries, including ENLK and its consolidated subsidiaries. Readers are advised to refer to the context in which terms are used, and to read these risk factors in conjunction with other detailed information concerning our business as set forth in our accompanying financial statements and notes and contained in “Item 7. Management’s Discussion and Analysis of Financial Condition and Results of Operations” included herein.
Risk Factor Summary
The following is a summary of risk factors that could adversely impact our financial condition, results of operations, or cash flows:
Risks Inherent in an Investment in ENLC
Risks Inherent to an Investment in ENLC include the following risks:
•GIP owns approximately 46.4% of our outstanding common units as of February 9, 2022 and controls the Managing Member, and therefore, GIP could favor GIP’s own interests to the detriment of our unitholders in any conflict of interest;
•GIP may compete with us and is not required to offer us the opportunity to acquire additional assets or businesses;
•we are a “controlled company” under NYSE rules and rely on exemptions from certain listing requirements.
•our operating agreement replaces fiduciary duties otherwise owed to our unitholders with limited contractual standards;
•our operating agreement restricts remedies available to our unitholders for actions of the Managing Member, and unitholders cannot remove the Managing Member without its consent without a vote of the holders of at least 66 2/3% of all outstanding ENLC common units;
•unitholders have limited voting rights and are not entitled to elect the Managing Member or its directors;
•a default under GIP’s credit facility could result in a change in control and a default under some of our debt agreements;
•our operating agreement restricts the voting rights of unitholders owning more than 20% of our units;
•control of the Managing Member may be transferred to a third party without unitholder consent;
•we may issue additional units, including senior units, without the approval of holders of common units;
•the holders of Series B Preferred Units have certain voting rights and the preferred units may be exchanged for our common units, diluting common unitholders;
•GIP may sell common units, which could adversely impact the trading price of common units;
•our Managing Member has a call right that may require unitholders to sell their common units at an undesirable time or price;
•costs reimbursements due to the Managing Member and its affiliates will be determined by the Managing Member and could be substantial;
•unitholders may have liability to repay distributions that were wrongfully distributed to them; and
•the price of our common units may fluctuate significantly.
Financial and Indebtedness Risks
Financial and Indebtedness Risks include the following risks:
•our cash flow consists almost exclusively of cash flows from ENLK, and we may not have sufficient cash available to pay distributions to unitholders each quarter;
•our debt agreements have terms, which may restrict our current and future operations;
•our debt levels could limit our flexibility and adversely affect our financial health or limit our flexibility to obtain financing and to pursue other business opportunities;
•changes in the availability and cost of capital, as a result of a change in our credit rating, could increase our financing costs and reduce our cash available for distribution;
•impairments to long-lived assets, lease right-of-use assets, and equity method investments could reduce our earnings;
•exposure to credit risk of our customers and counterparties could have an adverse effect on our financial condition;
•interest rate increases could adversely impact the price of ENLC’s common units, our ability to issue equity or incur indebtedness, and our ability to make cash distributions;
•we may not realize our deferred tax assets;
•entity level corporate income taxes will reduce cash available for distributions to common unitholders; and
•changes in determining LIBOR or its replacement with a new benchmark rate under our debt agreements may adversely impact interest expense.
Business and Industry Risks
Business and Industry Risks include the following risks:
•the ongoing coronavirus (COVID-19) pandemic has persisted and the outlook remains uncertain and could adversely affect our business, financial condition, and results of operation;
•our inability to retain existing customers or acquire new customers would reduce our revenues and limit our future profitability;
•decreases in the volumes that we gather, process, fractionate, or transport would adversely affect our financial condition, results of operations, or cash flows;
•volumes we service in the future could be less than we anticipate as a result of uncertainty regarding hydrocarbon reserves, which could have a material adverse effect on our financial condition, results of operations, or cash flows;
•any inability to balance our purchases and sales under our sale and purchase arrangements would increase our exposure to commodity price risks and could cause volatility in our operating income;
•adverse developments in the midstream business would adversely affect our financial condition and results of operations and reduce our ability to make distributions;
•competition for crude oil, condensate, natural gas, and NGL supplies and any decrease in the availability of such commodities, volatile prices and market demand for crude oil, condensate, natural gas, and NGLs that are beyond our control could each adversely affect our financial condition, results of operation, or cash flows;
•reductions in demand for NGL products by the petrochemical, refining, or other industries or by the fuel markets could materially adversely affect our financial condition, results of operations, or cash flows;
•increasing scrutiny and changing expectations from stakeholders with respect to our environment, social, and governance practices may impose additional costs on us or expose us to new or additional risks;
•vulnerability to weather-related risks, particularly for our South Louisiana and Texas Gulf Coast assets, could adversely impact our financial condition, results of operations, or cash flows;
•our dependency on certain of our large customers for a substantial portion of the natural gas that we gather, process, and transport could result in a decline in our operating results and cash available for distribution, and developments that materially and adversely affect these customers could adversely affect us;
•future growth may be limited if we are unable to make acquisitions on economically acceptable terms and integrate assets into our asset base effectively;
•entering into new businesses in connection with our strategy to participate in the energy transition could limit our future growth if we are unable to execute on this strategy or operate these new lines of business effectively or the new lines of business may never develop or present risks that we cannot effectively manage;
•disruption of our assets due to costs to acquire rights-of-way or leases could cause us to cease operations on the affected land, increase costs related to continuing operations elsewhere, and reduce our revenue;
•occurrence of a significant accident or other event not fully insured could adversely affect our operations and financial condition;
•risks to conduct of certain operations through joint ventures could have a material adverse effect on the success of these operations, our financial position, results of operations, or cash flows;
•unavailability of third-party pipelines or midstream facilities interconnected to our assets could adversely affect our adjusted gross margin and cash flow;
•loss of key members of management or the failure to retain an appropriately qualified workforce could disrupt our business operations or have a material adverse effect on our business and results of operations;
•fluctuations in commodity prices and interest rates could result in financial losses or reduce our income;
•our use of derivative financial instruments does not eliminate our exposure to commodity price fluctuations and could result in financial losses or reduce our income; and
•terrorist or cyberattack or a failure of our computer systems may adversely affect our ability to operate our business and may harm our reputation.
Environmental, Legal Compliance, and Regulatory Risks
Environmental, Legal Compliance, and Regulatory Risks include the following risks:
•increases in federal, state, and local legislation, and regulatory initiatives, as well as government reviews relating to hydraulic fracturing could result in increased costs and reductions or delays in natural gas production by our customers and could adversely impact our revenues and results of operation;
•climate change legislation and regulatory initiatives could result in increased operating costs and reduced demand for the natural gas and NGL services we provide;
•our ability to receive or renew required permits and other approvals from governmental authorities or other third parties could impact our operations;
•federal and state rate and service regulation and pipeline safety regulation on our natural gas or liquids pipelines could limit our revenues and increase our operating costs;
•compliance with existing or new environmental laws and regulations could increase our operating costs;
•compliance with privacy and data protection laws could increase our operating costs;
•recent rules under the Clean Air Act could increase our capital expenditures and operating costs and reduce demand for our services; and
•restrictions on our operations imposed by the ESA and MBTA could have an adverse impact on our operations.
Risks Inherent in an Investment in ENLC
GIP owns approximately 46.4% of ENLC’s outstanding common units as of February 9, 2022 and controls the Managing Member, which has sole responsibility for conducting our business and managing our operations. Our Managing Member and its affiliates, including GIP, have conflicts of interest with us and limited duties to us and may favor their own interests to your detriment.
GIP owns and controls the Managing Member and appoints all of the directors of the Managing Member. Some of the directors of the Managing Member, including directors with a majority of the voting power of the board of directors of the Managing Member, are also directors or officers of GIP. Although the Managing Member has a duty to manage us in a manner it subjectively believes to be in, or not opposed to, our best interests, the directors and officers of the Managing Member also have a duty to manage the Managing Member in a manner that is in the best interests of GIP, in its capacity as the sole member of the Managing Member. Conflicts of interest may arise between GIP and its affiliates, including the Managing Member, on the one hand, and us and our unitholders, on the other hand. In resolving these conflicts of interest, the Managing Member may favor its own interests and the interests of its affiliates over the interests of our unitholders. These conflicts include, among others, the following situations:
•neither our operating agreement nor any other agreement requires GIP to pursue a business strategy that favors us or to enter into any commercial or business arrangement with us. GIP’s directors and officers have a fiduciary duty to make decisions in the best interests of the owners of GIP, which may be contrary to our interests;
•GIP may be constrained by the terms of its debt instruments from taking actions, or refraining from taking actions, that may be in our best interests;
•the Managing Member determines the amount and timing of asset purchases and sales, borrowings, issuance of additional membership interests and reserves, each of which can affect the amount of cash that is available to be distributed to unitholders;
•the Managing Member determines which costs incurred by it are reimbursable by us;
•the Managing Member is allowed to take into account the interests of parties other than us in exercising certain rights under our operating agreement;
•our operating agreement limits the liability of, and eliminates and replaces the fiduciary duties that would otherwise be owed by, the Managing Member and also restricts the remedies available to our unitholders for actions that, without the provisions of the operating agreement, might constitute breaches of fiduciary duty;
•any future contracts between us, on the one hand, and affiliates of GIP, on the other, may not be the result of arm’s-length negotiations;
•except in limited circumstances, the Managing Member has the power and authority to conduct our business without unitholder approval;
•the Managing Member may exercise its right to call and purchase all of ENLC’s outstanding common units not owned by it and its affiliates if it and its affiliates own more than 90% of ENLC’s outstanding common units;
•the Managing Member controls the enforcement of obligations owed to us by the Managing Member and its affiliates, including commercial agreements; and
•the Managing Member decides whether to retain separate counsel, accountants, or others to perform services for us.
GIP is not limited in its ability to compete with us and is not obligated to offer us the opportunity to acquire additional assets or businesses, which could limit our ability to grow and could adversely affect our results of operations and cash available for distribution to our unitholders.
GIP is a private equity firm with significant resources and experience making investments in midstream energy businesses. GIP is not prohibited from owning assets or interests in entities, or engaging in businesses, that compete directly or indirectly with us. Affiliates of GIP currently own interests in other oil and gas companies, including midstream companies, which may compete directly or indirectly with us. In addition, GIP and its affiliates may acquire, construct, or dispose of additional
midstream or other assets and may be presented with new business opportunities, without any obligation to offer us the opportunity to purchase or construct such assets or to engage in such business opportunities.
Pursuant to the terms of our operating agreement, the doctrine of corporate opportunity, or any analogous doctrine, does not apply to the Managing Member, or any of its affiliates, including GIP and its officers. Any such person or entity that becomes aware of a potential transaction, agreement, arrangement or other matter that may be an opportunity for us will not have any duty to communicate or offer such opportunity to us. Any such person or entity will not be liable to us or to any unitholder for breach of any duty by reason of the fact that such person or entity pursues or acquires such opportunity for itself, directs such opportunity to another person or entity, or does not communicate such opportunity or information to us. As a result, competition from GIP, its affiliates, and other companies in which it owns interests could materially and adversely impact our results of operations and the level of our distributions. This may create actual and potential conflicts of interest between us and affiliates of the Managing Member and result in less than favorable treatment of us and our unitholders.
We are a “controlled company” within the meaning of NYSE rules and, as a result, we qualify for, and rely on, exemptions from some of the listing requirements with respect to independent directors.
Because GIP controls more than 50% of the voting power for the election of directors of the Managing Member, we are a controlled company within the meaning of NYSE rules, which exempt controlled companies from the following corporate governance requirements:
•the requirement that a majority of the board consist of independent directors;
•the requirement that the board of directors have a nominating or corporate governance committee, composed entirely of independent directors, that is responsible for identifying individuals qualified to become board members, consistent with criteria approved by the board, selection of board nominees for the next annual meeting of equity holders, development of corporate governance guidelines, and oversight of the evaluation of the board and management;
•the requirement that we have a compensation committee of the board, composed entirely of independent directors, that is responsible for reviewing and approving corporate goals and objectives relevant to chief executive officer compensation, evaluation of the chief executive officer’s performance in light of the goals and objectives, determination and approval of the chief executive officer’s compensation, making recommendations to the board with respect to compensation of other executive officers and incentive compensation and equity-based plans that are subject to board approval and producing a report on executive compensation to be included in an annual proxy statement or Form 10-K filed with the Commission;
•the requirement that we conduct an annual performance evaluation of the nominating, corporate governance and compensation committees; and
•the requirement that we have written charters for the nominating, corporate governance and compensation committees addressing the committees’ responsibilities and annual performance evaluations.
For so long as we remain a controlled company, we will not be required to have a majority of independent directors or nominating, corporate governance or compensation committees composed entirely of independent directors. Accordingly, you may not have the same protections afforded to stockholders of companies that are subject to all of the NYSE corporate governance requirements.
Our operating agreement replaces the fiduciary duties otherwise owed to our unitholders by the Managing Member with contractual standards governing its duties.
Our operating agreement contains provisions that eliminate and replace the fiduciary standards that the Managing Member would otherwise be held to by state fiduciary duty law. For example, our operating agreement permits the Managing Member to make a number of decisions, in its individual capacity, as opposed to in its capacity as the Managing Member, or otherwise, free of fiduciary duties to us and our unitholders. This entitles the Managing Member to consider only the interests and factors that it desires, and it has no duty or obligation to give any consideration to any interest of, or factors affecting, us, our affiliates, or our members. Examples of decisions that the Managing Member may make in its individual capacity include:
•how to allocate business opportunities among us and its other affiliates;
•whether to exercise its call right;
•how to exercise its voting rights with respect to any membership interests it owns;
•whether or not to consent to any merger or consolidation of us or any amendment to our operating agreement; and
•whether or not to seek the approval of the conflicts committee of the board of directors of the Managing Member, or the unitholders, or neither, of any conflicted transaction.
By purchasing any ENLC common units, a unitholder is treated as having consented to the provisions in our operating agreement, including the provisions discussed above.
Our operating agreement restricts the remedies available to holders of our membership interests for actions taken by the Managing Member that might otherwise constitute breaches of fiduciary duty.
Our operating agreement contains provisions that restrict the remedies available to holders of ENLC common units for actions taken by the Managing Member that might otherwise constitute breaches of fiduciary duty under state fiduciary duty law. For example, our operating agreement provides that:
•whenever the Managing Member makes a determination or takes, or declines to take, any other action in its capacity as the Managing Member, the Managing Member is required to make such determination, or take or decline to take such other action, in good faith, and will not be subject to any other or different standard imposed by Delaware law, or any other law, rule, or regulation, or at equity;
•the Managing Member will not have any liability to us or our unitholders for decisions made in its capacity as a managing member so long as it acted in good faith, meaning that it subjectively believed that the decision was in, or not opposed to, our best interests;
•our operating agreement is governed by Delaware law and any claims, suits, actions, or proceedings:
•arising out of or relating in any way to our operating agreement (including any claims, suits, or actions to interpret, apply, or enforce the provisions of our operating agreement or the duties, obligations, or liabilities among members or of members to us, or the rights or powers of, or restrictions on, the members or the company);
•brought in a derivative manner on our behalf;
•asserting a claim of breach of a fiduciary duty owed by any of our directors, officers, or other employees or the Managing Member, or owed by the Managing Member, to us or our members;
•asserting a claim arising pursuant to any provision of the Delaware Limited Liability Company Act (“DLLCA”); or
•asserting a claim governed by the internal affairs doctrine;
must be exclusively brought in the Court of Chancery of the State of Delaware (or, if such court does not have subject matter jurisdiction thereof, any other court located in the State of Delaware with subject matter jurisdiction), regardless of whether such claims, suits, actions, or proceedings sound in contract, tort, fraud, or otherwise, are based on common law, statutory, equitable, legal, or other grounds, or are derivative or direct claims. By purchasing ENLC common units, a member is irrevocably consenting to these limitations and provisions regarding claims, suits, actions, or proceedings and submitting to the exclusive jurisdiction of the Court of Chancery of the State of Delaware (or such other Delaware courts) in connection with any such claims, suits, actions, or proceedings;
•the Managing Member and its officers and directors will not be liable for monetary damages to us or our members resulting from any act or omission unless there has been a final and non-appealable judgment entered by a court of competent jurisdiction determining that the Managing Member or its officers or directors, as the case may be, acted in bad faith or engaged in fraud or willful misconduct, or, in the case of a criminal matter, acted with knowledge that the conduct was unlawful; and
•the Managing Member will not be in breach of its obligations under our operating agreement or its duties to us or our members if a transaction with an affiliate or the resolution of a conflict of interest is:
•approved by the conflicts committee of the board of directors of the Managing Member, although the Managing Member is not obligated to seek such approval; or
•approved by the vote of a majority of the outstanding ENLC common units, excluding any ENLC common units owned by the Managing Member and its affiliates, although the Managing Member is not obligated to seek such approval.
Our Managing Member will not have any liability to us or our unitholders for decisions whether or not to seek the approval of the conflicts committee of the board of directors of the Managing Member or holders of a majority of ENLC common units, excluding any ENLC common units owned by the Managing Member and its affiliates. If an affiliate transaction or the resolution of a conflict of interest is not approved by the conflicts committee or holders of ENLC common units, then it will be presumed that, in making its decision, taking any action or failing to act, the board of directors acted in good faith, and in any proceeding brought by or on behalf of any member or us, the person bringing or prosecuting such proceeding will have the burden of overcoming such presumption.
Holders of ENLC common units have limited voting rights and are not entitled to elect the Managing Member or the board of directors of the Managing Member, which could reduce the price at which ENLC common units trade.
Unlike the holders of common stock in a corporation, ENLC unitholders have only limited voting rights on matters affecting our business and, therefore, limited ability to influence management’s decisions regarding our business. Unitholders do not have the right to elect the Managing Member or the board of directors of the Managing Member on an annual or other continuing basis. The board of directors of the Managing Member, including its independent directors, is chosen by the sole member of the Managing Member. Furthermore, if unitholders are dissatisfied with the performance of the Managing Member, they will have very limited ability to remove the Managing Member. Our operating agreement also contains provisions limiting the ability of unitholders to call meetings or to acquire information about our operations, as well as other provisions limiting the unitholders’ ability to influence the manner or direction of management. As a result of these limitations, the price at which ENLC common units trade could be diminished because of the absence or reduction of a takeover premium in the trading price.
Even if our unitholders are dissatisfied, they cannot initially remove the Managing Member without its consent.
ENLC’s unitholders are unable to remove the Managing Member without its consent because the Managing Member and its affiliates own sufficient units to be able to prevent its removal. The vote of the holders of at least 66 2/3% of all outstanding ENLC common units voting together as a single class is required to remove the Managing Member. As of February 9, 2022, the Managing Member and its affiliates owned approximately 46.4% of the outstanding ENLC common units.
GIP has pledged all of the equity interests that it owns in ENLC and the Managing Member to GIP’s lenders under its credit facility. A default under GIP’s credit facility could result in a change of control of the Managing Member.
GIP has pledged all of the equity interests that it owns in ENLC and the Managing Member to its lenders as security under a secured credit facility entered into by a GIP entity in connection with the GIP Transaction (the “GIP Credit Facility”). Although we are not a party to this credit facility, if GIP were to default under the GIP Credit Facility, GIP’s lenders could foreclose on the pledged equity interests. Any such foreclosure on GIP’s interest would result in a change of control of the Managing Member and would allow the new owner to replace the board of directors and officers of the Managing Member with its own designees and to control the decisions taken by the board of directors and officers. Moreover, any change of control of the Managing Member would permit the lenders under ENLC’s Consolidated Credit Facility and AR Facility to declare all amounts thereunder immediately due and payable, and if any such event occurs, we may be required to refinance our debt on unfavorable terms, which could negatively impact our results of operations and our ability to make distributions to our unitholders.
Our operating agreement restricts the voting rights of unitholders owning 20% or more of ENLC’s common units.
Unitholders’ voting rights are further restricted by our operating agreement, which provides that any units held by a person that owns 20% or more of any class of units, other than the Managing Member, its affiliates, their transferees and persons who acquired such units with the prior approval of the board of directors of the Managing Member, including the holders of the ENLC Class C Common Units, cannot vote on any matter.
The control of the Managing Member may be transferred to a third party without unitholder consent.
Our Managing Member may transfer its managing member interest in us to a third party in a merger or in a sale of all or substantially all of its assets without the consent of our unitholders. Furthermore, our operating agreement does not restrict the ability of GIP to transfer all or a portion of the ownership interest in the Managing Member to a third party. If the managing member interest were transferred, the new owner of the Managing Member would then be in a position to replace the board of directors and officers of the Managing Member with its own choices and thereby exert significant control over the decisions made by such board of directors and officers. This effectively permits a “change of control” of the Managing Member without the vote or consent of the unitholders. On July 18, 2018, Devon sold its equity interests in us and our Managing Member to affiliates of GIP, without a vote or consent of the unitholders. For more information about the GIP transaction, see “Item 8. Financial Statements and Supplementary Data—Note 1.”
We may issue additional units, including units that are senior to ENLC common units, without the approval of the holders of common units, which would dilute existing ownership interests.
Our operating agreement does not limit the number of additional membership interests that we may issue at any time without the approval of our unitholders, except that our operating agreement restricts our ability to issue any membership interests senior to or on parity with the Series B Preferred Units with respect to distributions on such membership interests or upon liquidation without the affirmative vote of the holders of a majority of our outstanding ENLC Class C Common Units, voting separately as a class. The issuance by us of additional ENLC common units or other equity securities of equal or senior rank will have the following effects:
•each unitholder’s proportionate ownership interest in us will decrease;
•the amount of cash available for distribution on each unit may decrease;
•the relative voting strength of each previously outstanding unit may be diminished; and
•the market price of ENLC common units may decline.
The ENLC Class C Common Units give the holders thereof certain voting rights, and the ability to exchange such holder’s Series B Preferred Units into our common units, which could cause dilution to our common unitholders.
The holders of our Series B Preferred Units have an equal number of ENLC Class C Common Units, which provide these holders with certain voting rights at ENLC in accordance with our operating agreement. For each additional Series B Preferred Unit issued by ENLK pursuant to its partnership agreement, ENLC will issue an additional Class C Common Unit to the applicable holders of Series B Preferred Units, so that the number of ENLC Class C Common Units issued and outstanding will always equal the number of Series B Preferred Units issued and outstanding. The holders of ENLC Class C Common Units will vote with the holders of common units as a single class on all matters on which holders of common units are entitled to vote. Each Class C Common Unit will be entitled to the number of votes equal to the number of common units into which a Series B Preferred Unit is then exchangeable, which is the product of the number of Series B Preferred Units being exchanged multiplied by 1.15 (subject to certain adjustments).
In addition, the holders of ENLC Class C Common Units are entitled to vote as a separate class on any matter that (i) adversely affects the rights, preferences, and privileges of the ENLC Class C Common Units or the Series B Preferred Units, including certain leverage ratio restrictions and other minority protections with respect to substantially the same matters for which the holders of Series B Preferred Units have approval rights under the ENLK partnership agreement, or (ii) amends or modifies any of the terms of the ENLC Class C Common Units or Series B Preferred Units. The approval of a majority of the ENLC Class C Common Units is required to approve any matter for which the holders of ENLC Class C Common Units are entitled to vote as a separate class. These restrictions may adversely affect our ability to finance future operations or capital needs or to engage in other business activities.
Furthermore, the exchange of the Series B Preferred Units into common units, which the holders of the Series B Preferred Units may elect to cause at any time, may cause substantial dilution to the holders of the common units. As of February 9, 2022, on an as-exchanged basis, the Series B Preferred Units (and the corresponding voting power of the ENLC Class C Common Units) represented approximately 10.1% of the membership interests of ENLC.
GIP may sell ENLC common units in the public markets or otherwise, which sales could have an adverse impact on the trading price of our common units.
As of February 9, 2022, GIP held 224,355,359 ENLC common units. Additionally, we have agreed to provide GIP with certain registration rights with respect to the ENLC common units held by it. The sale of these units could have an adverse
impact on the price of ENLC common units or on any trading market that may develop. On February 15, 2022, we and GIP entered into an agreement pursuant to which we will repurchase, on a quarterly basis, a pro rata portion of the ENLC common units held by GIP, based upon the number of common units purchased by us during the applicable quarter from public unitholders under our common unit repurchase program. The number of ENLC common units held by GIP that we repurchase in any quarter will be calculated such that GIP’s then-existing economic ownership percentage of our outstanding common units is maintained after our repurchases of common units from public unitholders are taken into account, and the per unit price we pay to GIP will be the average per unit price paid by us for the common units repurchased from public unitholders. For more information about our repurchase agreement with GIP, see Item 9B of this Report.
Our Managing Member has a call right that may require unitholders to sell their ENLC common units at an undesirable time or price.
If at any time the Managing Member and its affiliates own more than 90% of ENLC’s common units, the Managing Member will have the right, but not the obligation, which it may assign to any of its affiliates or to us, to acquire all, but not less than all, of ENLC common units held by unaffiliated persons at a price equal to the greater of (1) the average of the daily closing price of ENLC common units over the 20 trading days preceding the date three days before notice of exercise of the call right is first mailed and (2) the highest per-unit price paid by the Managing Member or any of its affiliates for ENLC common units during the 90-day period preceding the date such notice is first mailed. As a result, unitholders may be required to sell their ENLC common units at an undesirable time or price and may not receive any return or a negative return on their investment. Unitholders may also incur a tax liability upon a sale of their units. Our Managing Member is not obligated to obtain a fairness opinion regarding the value of ENLC common units to be repurchased by it upon exercise of the call right. There is no restriction in our operating agreement that prevents the Managing Member from issuing additional ENLC common units and exercising its call right. If the Managing Member exercised its call right, the effect would be to take us private. As of February 9, 2022, GIP owned an aggregate of approximately 46.4% of outstanding ENLC common units.
Cost reimbursements due to the Managing Member and its affiliates for services provided, which will be determined by the Managing Member, could be substantial and would reduce cash available for distribution to our unitholders.
Prior to making distributions on ENLC common units, we will reimburse the Managing Member and its affiliates for all expenses they incur on our behalf. These expenses will include all costs incurred by the Managing Member and its affiliates in managing and operating us, including costs for rendering corporate staff and support services to us, if any. There is no limit on the amount of expenses for which the Managing Member and its affiliates may be reimbursed. Our operating agreement provides that the Managing Member will determine the expenses that are allocable to us. In addition, to the extent the Managing Member incurs obligations on behalf of us, we are obligated to reimburse or indemnify the Managing Member. During 2021, we reimbursed the Managing Member and its affiliates for $0.5 million in connection with personnel secondment services provided by GIP. If we are unable or unwilling to reimburse or indemnify the Managing Member, the Managing Member may take actions to cause us to make payments of these obligations and liabilities. Any such payments could reduce the amount of cash otherwise available for distribution to our unitholders.
Unitholders may have liability to repay distributions that were wrongfully distributed to them.
Under certain circumstances, unitholders may have to repay amounts wrongfully returned or distributed to them. Under the DLLCA, a limited liability company may not make a distribution to a member if, after the distribution, all liabilities of the limited liability company, other than liabilities to members on account of their membership interests and liabilities for which the recourse of creditors is limited to specific property of the company, would exceed the fair value of the assets of the limited liability company. For the purpose of determining the fair value of the assets of a limited liability company, the DLLCA provides that the fair value of property subject to liability for which recourse of creditors is limited shall be included in the assets of the limited liability company only to the extent that the fair value of that property exceeds the non-recourse liability. The DLLCA provides that a member who receives a distribution and knew at the time of the distribution that the distribution was in violation of the DLLCA will be liable to the limited liability company for the amount of the distribution for three years following the date of the distribution.
The price of ENLC common units may fluctuate significantly, which could cause our unitholders to lose all or part of their investment.
As of February 9, 2022, approximately 53.6% of ENLC common units were held by public unitholders. The lack of liquidity may result in wide bid-ask spreads, contribute to significant fluctuations in the market price of ENLC common units, and limit the number of investors who are able to buy ENLC common units. The market price of ENLC common units may be influenced by many factors, some of which are beyond our control, including:
•the quarterly distributions paid by us with respect to ENLC common units;
•our quarterly or annual earnings, or those of other companies in our industry;
•the loss of a significant customer;
•events affecting GIP;
•announcements by us or our competitors of significant contracts or acquisitions;
•changes in accounting standards, policies, guidance, interpretations, or principles;
•general economic conditions, including the impacts of COVID-19 (or any of its variants) or any other pandemic;
•the failure of securities analysts to cover ENLC common units or changes in financial estimates by analysts;
•future sales of ENLC common units; and
•other factors described in these “Risk Factors.”
In March 2020, soon after the World Health Organization declared the ongoing COVID-19 outbreak a pandemic, the ENLC common units reached a historically low trading price of $0.93.
Financial and Indebtedness Risks
Our cash flow consists almost exclusively of cash flows from ENLK.
Currently, our only cash-generating asset is our partnership interest in ENLK. Our cash flow is therefore completely dependent upon the ability of ENLK to generate cash or our ability to borrow under the Consolidated Credit Facility and the AR Facility.
The amount of cash that ENLK can provide to us each quarter principally depends upon the amount of cash it generates from its operations, which will fluctuate from quarter to quarter based on, among other things:
•the fees ENLK charges and the margins it realizes for its services;
•the prices of, levels of production of, and demand for crude oil, condensate, NGLs, and natural gas;
•the volume of natural gas ENLK gathers, compresses, processes, transports, and sells, the volume of NGLs ENLK processes or fractionates and sells, the volume of crude oil ENLK handles at its crude terminals, the volume of crude oil and condensate that ENLK gathers, transports, purchases, and sells, the volumes of condensate stabilized, and the volumes of brine ENLK disposes;
•the relationship between natural gas and NGL prices; and
•ENLK’s level of operating costs.
In addition, the actual amount of cash generated by ENLK that will be available to us will depend on other factors, some of which are beyond its control, including:
•the level of capital expenditures ENLK makes;
•the cost of acquisitions, if any;
•ENLK’s debt service requirements and distribution requirements with respect to Series B Preferred Units and Series C Preferred Units;
•fluctuations in its working capital needs;
•prevailing economic conditions; and
•the amount of cash reserves established by the General Partner in its sole discretion for the proper conduct of business.
Because of these and potentially other factors, we may not be able, or may not have sufficient available cash to pay distributions to unitholders each quarter. Furthermore, you should also be aware that the amount of cash ENLK has available depends primarily upon its cash flows, including cash flow from financial reserves and working capital borrowings, and is not solely a function of profitability, which will be affected by non-cash items. As a result, ENLK may make cash distributions during periods when it records losses and may not make cash distributions during periods when it records net income.
The terms of the Consolidated Credit Facility, the AR Facility, and indentures governing our senior notes and ENLK’s senior notes may restrict our current and future operations, particularly our ability to respond to changes in business or to take certain actions.
The Consolidated Credit Facility, the AR Facility, and the indentures governing our senior notes and ENLK’s senior notes contain, and any future indebtedness we incur will likely contain, a number of restrictive covenants that impose significant operating and financial restrictions, including restrictions on our ability to engage in acts that may be in our best long-term interest. One or more of these agreements include covenants that, among other things, restrict our ability to:
•incur subsidiary indebtedness;
•engage in transactions with our affiliates;
•consolidate, merge, or sell substantially all of our assets;
•incur liens;
•enter into sale and lease back transactions; and
•change business activities we conduct.
In addition, the Consolidated Credit Facility requires us to satisfy and maintain specified financial ratios, and the AR Facility requires ENLC’s consolidated leverage ratio not to exceed limits identical to those in the Consolidated Credit Facility. The AR Facility also contains events of default relating to a borrowing base deficiency and events negatively affecting the overall credit quality of the receivables securing the AR Facility. Our ability to meet those financial ratios and receivables-related tests can be affected by events beyond our control, including prevailing economic, financial, and industry conditions, and we cannot assure you that we will meet those ratios and receivables-related tests, particularly if market or other economic conditions deteriorate.
A breach of any of these covenants could result in an event of default under the applicable debt agreement. Upon the occurrence of such an event of default, all amounts outstanding under the applicable debt agreements could be declared to be immediately due and payable and all applicable commitments to extend further credit could be terminated. If indebtedness under the applicable debt agreements is accelerated, there can be no assurance that we will have sufficient assets to repay the indebtedness. The operating and financial restrictions and covenants in these debt agreements and any future debt agreements may adversely affect our ability to finance future operations or capital needs or to engage in other business activities.
Our debt levels could limit our flexibility and adversely affect our financial health or limit our flexibility to obtain financing and to pursue other business opportunities.
We continue to have the ability to incur debt, subject to limitations in our debt agreements. Our level of indebtedness could have important consequences to us, including the following:
•our ability to obtain additional financing, if necessary, for working capital, capital expenditures, acquisitions, or other purposes may be impaired or such financing may not be available on favorable terms;
•our funds available for operations, future business opportunities, and distributions to unitholders will be reduced by that portion of our cash flows required to make interest payments on our debt;
•our debt level will make us more vulnerable to general adverse economic and industry conditions;
•our ability to plan for, or react to, changes in our business and the industry in which we operate; and
•our risk that we may default on our debt obligations.
In addition, our ability to make scheduled payments or to refinance our obligations depends on our successful financial and operating performance, which will be affected by prevailing economic, financial, and industry conditions, many of which are beyond our control. If our cash flow and capital resources are insufficient to fund our debt service obligations, we may be forced to take actions such as further reducing distributions, reducing or delaying our business activities, acquisitions, investments, or capital expenditures, selling assets, restructuring or refinancing our debt, or seeking additional equity capital. We may not be able to undertake any of these actions on satisfactory terms or at all.
Any reductions in our credit ratings could increase our financing costs, increase the cost of maintaining certain contractual relationships, and reduce our cash available for distribution.
We cannot guarantee that our credit ratings will remain in effect for any given period of time or that a rating will not be lowered or withdrawn entirely by a rating agency if, in its judgment, circumstances so warrant. As of February 9, 2022, Fitch Ratings, S&P, and Moody’s have assigned a BB+, BB+, and Ba2 credit rating, respectively, to ENLK and ENLC. Any downgrade could also lead to higher borrowing costs for future borrowings and could require:
•additional or more restrictive covenants that impose operating and financial restrictions on us and our subsidiaries;
•our subsidiaries to guarantee such debt and certain other debt;
•us and our subsidiaries to provide collateral to secure such debt; and
•us or our subsidiaries to post cash collateral or letters of credit under our hedging arrangements or in order to purchase commodities or obtain trade credit.
Any increase in our financing costs or additional or more restrictive covenants resulting from a credit rating downgrade could adversely affect our ability to finance future operations. If a credit rating downgrade and the resultant collateral requirement were to occur at a time when we were experiencing significant working capital requirements or otherwise lacked liquidity, our results of operations could be adversely affected.
An impairment of long-lived assets, including intangible assets, equity method investments, and right-of-use assets related to leases could reduce our earnings.
GAAP requires us to test long-lived assets, including intangible assets with finite useful lives, for impairment whenever events or changes in circumstances indicate that the carrying amount may not be recoverable. For the investments we account for under the equity method, the impairment test considers whether the fair value of the unconsolidated affiliate investment as a whole, not the underlying net assets, has declined and whether that decline is other than temporary. If we determine that an impairment is indicated, we would be required to take an immediate non-cash charge to earnings with a correlative effect on equity and balance sheet leverage as measured by debt to total capitalization. For the year ended December 31, 2021, we recognized $0.8 million impairment expense related to property and equipment and lease right-of-use assets. We have recognized impairments on property and equipment in the past. See “Item 8. Financial Statements and Supplementary Data—Note 2” for more information about impairment of long-lived assets. Additional impairment of the value of our existing long-lived assets could have a significant negative impact on our future operating results.
We are exposed to the credit risk of our customers and counterparties, and a general increase in the nonpayment and nonperformance by our customers could have an adverse effect on our financial condition, results of operations, or cash flows.
Risks of nonpayment and nonperformance by our customers are a major concern in our business. We are subject to risks of loss resulting from nonpayment or nonperformance by our customers and other counterparties, such as our lenders and hedging counterparties. Any increase in the nonpayment and nonperformance by our customers could adversely affect our results of operations and reduce our ability to make distributions to our unitholders. Additionally, equity values for many of our customers continue to be low. The combination of a reduction in cash flow from lower commodity prices, a reduction in borrowing bases under reserve-based credit facilities, and the lack of availability of debt or equity financing may result in a significant reduction in our customers’ liquidity and ability to make payment or perform on their obligations to us. Furthermore, some of our customers may be highly leveraged and subject to their own operating and regulatory risks, which increases the risk that they may default on their obligations to us. In May 2019, White Star, the counterparty to our $58.0 million second lien secured term loan receivable, filed for reorganization under Chapter 11 of the U.S. Bankruptcy Code and was not able to repay the outstanding amounts owed to us under the second lien secured term loan. For additional information regarding this transaction, refer to “Item 8. Financial Statements and Supplementary Information—Note 2.”
Increases in interest rates could adversely impact the price of ENLC’s common units, ENLC’s or ENLK’s ability to issue equity or incur debt for acquisitions or other purposes, and ENLC’s or ENLK’s ability to make cash distributions.
Interest rates on future credit facilities and debt offerings could be higher than current levels, causing our financing costs to increase accordingly. As with other yield-oriented securities, ENLC’s unit price is impacted by ENLC’s level of cash distributions and implied distribution yield. The distribution yield is often used by investors to compare and rank yield-oriented securities for investment decision-making purposes. Therefore, changes in interest rates, either positive or negative, may affect the yield requirements of investors who invest in ENLC’s units, and a rising interest rate environment could have an adverse impact on the price of ENLC’s common units, ENLC’s or ENLK’s ability to issue equity or incur debt for acquisitions or other purposes and ENLC’s or ENLK’s ability to make cash distributions at our intended levels or at all. Beginning on December 15, 2022, distributions on ENLK’s Series C Preferred Units will be based on a floating rate tied to LIBOR rather than a fixed rate and, therefore, the amount paid by ENLK as a distribution will be more sensitive to changes in interest rates.
We may not realize our deferred tax assets.
As of December 31, 2021, we had deferred tax assets (primarily consisting of federal and state net operating loss carryovers) of $633.2 million, against which we provided a valuation allowance of $151.6 million. The ultimate realization of our deferred tax assets is dependent upon generating future taxable income to utilize our net operating loss carryovers before they expire. While we have recorded valuation allowances against certain of our deferred tax assets, the valuation allowances are subject to change as facts and circumstances change.
Additionally, Section 382 of the Internal Revenue Code of 1986, as amended (“Section 382”), generally imposes an annual limitation on the amount of net operating losses and other pre-change tax attributes (such as tax credits) that may be used to offset taxable income by a corporation that has undergone an “ownership change” (as determined under Section 382). An ownership change generally occurs if one or more shareholders (or groups of shareholders) that are each deemed to own at least 5% of our stock increase their ownership by more than 50 percentage points over their lowest ownership percentage during a rolling three-year period. As of December 31, 2021, we have not experienced an ownership change. Therefore, our utilization of net operating loss carryforwards was not subject to an annual limitation. However, if we were to experience ownership changes in the future as a result of subsequent shifts in our common unit ownership, our ability to use our pre-change net operating loss carryforwards to offset future taxable income may be subject to limitations, which could potentially result in increased future tax liability to us. Additionally, at the state level, there may be periods during which the use of NOL carryforwards is suspended or otherwise limited, which could accelerate or permanently increase state taxes owed. In any case, our net operating loss and tax credit carryforwards are subject to review and potential disallowance upon audit by the tax authorities of the jurisdictions where these tax attributes are incurred.
The value of our deferred tax assets and liabilities are also dependent upon the tax rates expected to be in effect at the time they are realized. A change in enacted corporate tax rates in our major jurisdictions, especially the U.S. federal corporate tax rate, would change the value of our deferred taxes, which could be material.
We are treated as a corporation subject to entity level federal and state income taxation. Any such entity level income taxes will reduce the amount of cash available for distribution.
We are treated as a corporation for tax purposes that is required to pay federal and state income tax on our taxable income at corporate rates. Historically, we have had net operating losses (“NOLs”) that eliminated substantially all of our taxable income and, thus, we historically have not had to pay material amounts of income taxes. We anticipate generating NOLs for tax purposes during 2021, and as a result, do not expect to incur material amounts of federal and state income tax liabilities. In the event we do generate taxable income, federal and state income tax liabilities will reduce the cash available for distribution to our unitholders.
Changes in the method of determining the London Interbank Offered Rate, or the replacement of the London Interbank Offered Rate with an alternative reference rate, may adversely affect interest expense related to outstanding debt.
Amounts drawn under the Consolidated Credit Facility and the AR Facility currently bear interest at rates based on the U.S. Dollar London Interbank Offered Rate (“LIBOR”). On July 27, 2017, the Financial Conduct Authority in the United Kingdom (“FCA”) announced that it would phase out LIBOR as a benchmark by the end of 2021. On March 5, 2021, ICE Benchmark Administration, the current administrator of LIBOR, announced that it intends to cease publication of 1-week and 2-month LIBOR at the end of 2021 and, subject to compliance with applicable regulations, including as to representativeness, it does not intend to cease publication of the remaining tenors until June 30, 2023. It is uncertain whether USD LIBOR will be available as a benchmark for pricing our floating rate indebtedness until, or after, June 30, 2023. The Consolidated Credit Facility and the AR Facility include mechanisms to amend the facilities to reflect the establishment of an alternative rate of interest upon the
occurrence of certain events related to the phase-out of LIBOR and on September 24, 2021, EnLink Midstream Funding, LLC entered into the Second Amendment to the Receivables Financing Agreement to, among other things, provide for the technical amendment and contractual alternative to address the anticipated replacement of LIBOR. The expected replacement reference rate for the AR Facility, plus the applicable spread adjustment, could result in a higher interest rate under the AR Facility than if our borrowings were still based upon LIBOR. If no such amendment or other contractual alternative is established for the Consolidated Credit Facility on or prior to the phase-out of LIBOR, interest under the Consolidated Credit Facility will bear interest at higher rates based on the prime rate until such amendment or other contractual amendment is established. Even where we have entered into interest rate swaps or other derivative instruments for purposes of managing our interest rate exposure, our hedging strategies may not be effective as a result of the replacement or phasing out of LIBOR, and our earnings may be subject to volatility. In addition, the overall financial markets may be disrupted as a result of the phase-out or replacement of LIBOR. The potential increase in our interest expense as a result of the phase-out of LIBOR and uncertainty as to the nature of such potential phase-out and alternative reference rates or disruption in the financial market could have an adverse effect on our financial condition, results of operations and cash flows.
Business and Industry Risks
The ongoing coronavirus (COVID-19) pandemic has adversely affected and could continue to adversely affect our business, financial condition, and results of operations.
On March 11, 2020, the World Health Organization declared the ongoing coronavirus (COVID-19) outbreak a pandemic and recommended containment and mitigation measures worldwide. The ongoing pandemic and related travel and operational restrictions, as well as business closures and curtailed consumer activity, resulted in a reduction in global demand for energy, volatility in the market prices for crude oil, condensate, natural gas, and NGLs, and a significant reduction in the market price of crude oil and a related curtailment of drilling and production activity, including by some of our customers, during the first and second quarter of 2020. As a result of these decreases in producer activity, we experienced reduced volumes gathered, processed, fractionated, and transported on our assets in some of the regions that supply our systems during this same period, although commodity prices and our volumes have now returned to pre-pandemic levels.
Since the outbreak began, our first priority has been the health and safety of our employees and those of our customers and other business counterparties. Beginning in March 2020, we implemented preventative measures and developed a response plan to minimize unnecessary risk of exposure and prevent infection, while supporting our customers’ operations, and we continue to follow these plans. We maintain a crisis management team for health, safety and environmental matters and personnel issues and a cross-functional COVID-19 response team to address various impacts of the situation, as they develop. We also continue to promote heightened awareness, vigilance, and hygiene, and we continue to evaluate and adjust our preventative measures, response plans and business practices with the evolving impacts of COVID-19 and its variants. We have continued to maintain these COVID protocols since the inception of the pandemic and to date we have not experienced any significant COVID-19 related operational disruptions. However, the quarantine of personnel or the inability to access our facilities or customer sites could adversely affect our operations. If a large proportion of our employees in critical positions were to contract COVID-19 at the same time, we would rely upon our business continuity plans in an effort to continue operations at our systems, pipelines, and facilities, but there is no certainty that such measures will be sufficient to mitigate the adverse impact to our operations that could result from shortages of highly skilled employees.
There remains considerable uncertainty regarding how long the COVID-19 pandemic (including the Delta and Omicron variants of the virus, as well as any other variants) will persist and affect economic conditions and the extent and duration of changes in consumer behavior, such as the reluctance to travel, as well as whether governmental and other measures implemented to try to slow the spread of the virus and its variants, such as large-scale travel bans and restrictions, border closures, quarantines, shelter-in-place orders, and business and government shutdowns that exist as of the date of this report will be extended or whether new measures will be imposed. As a result, there is significant uncertainty as to whether COVID-19 will cause additional market dislocations or how significantly and how long any such market disruptions may affect us. We expect to see continued volatility in crude oil, condensate, natural gas, and NGL prices for the foreseeable future, which may, over the long term, adversely impact our business. A sustained significant decline in oil and natural gas exploration and production activities and related reduced demand for our services by our customers, whether due to decreases in consumer demand or reduction in the prices for oil, condensate natural gas and NGLs or otherwise, would have a material adverse effect on our business, liquidity, financial condition, results of operations, and cash flows.
These uncertain economic conditions may also result in the inability of our customers and other counterparties to make payments to us, on a timely basis or at all, which could adversely affect our business, liquidity, financial condition, results of operations, and cash flows. A substantial deterioration in our business and/or a prolonged period of market dislocation could also affect our compliance with the financial covenants in our revolving credit facility, particularly the consolidated leverage
ratio covenant. If we were unable to continue to meet any of the financial covenants, we would not be able to borrow funds under our revolving credit facility and the AR Facility.
We cannot predict the full impact that the COVID-19 pandemic or the related volatility in oil and natural gas markets will have on our business, liquidity, financial condition, results of operations, and cash flows at this time due to numerous uncertainties. Furthermore, the COVID-19 pandemic (including federal, state and local governmental responses, broad economic impacts and market disruptions) has heightened a number of the risks discussed in the risk factors described in this report. The ultimate impacts will depend on future developments, including, among others, the ultimate duration and persistence of the pandemic, the impact of the Delta and Omicron variants of the virus, the speed at which the population is vaccinated against the virus and the efficacy of the vaccines, the emergence of new variants of the virus against which vaccines are less effective, the effect of the pandemic on economic, social and other aspects of everyday life, the consequences of governmental and other measures designed to prevent the spread of the virus, actions taken by members of OPEC+ and other foreign, oil-exporting countries, actions taken by governmental authorities, customers, suppliers, and other third parties, and the timing and extent to which normal economic, social and operating conditions resume.
We may not be able to retain existing customers or acquire new customers, which would reduce our revenues and limit our future profitability.
The renewal or replacement of existing contracts with our customers at rates sufficient to maintain current revenues and cash flows depends on a number of factors beyond our control, including the price of, and demand for, crude oil, condensate, NGLs, and natural gas in the markets we serve and competition from other midstream service providers. Our competitors include companies larger than we are, which could have both a lower cost of capital and a greater geographic coverage, as well as companies smaller than we are, which could have lower total cost structures. In addition, competition is increasing in some markets that have been overbuilt, resulting in an excess of midstream energy infrastructure capacity, or where new market entrants are willing to provide services at a discount in order to establish relationships and gain a foothold. The inability of our management to renew or replace our current contracts as they expire and to respond appropriately to changing market conditions could have a negative effect on our profitability.
In particular, our ability to renew or replace our existing contracts with industrial end-users and utilities impacts our profitability. As a consequence of the increase in competition in the industry and volatility of natural gas prices, industrial end-users and utilities may be reluctant to enter into long-term purchase contracts. Many industrial end-users purchase natural gas from more than one natural gas company and have the ability to change providers at any time. Some of these industrial end-users also have the ability to switch between gas and alternate fuels in response to relative price fluctuations in the market. Because there are numerous companies of greatly varying size and financial capacity that compete with us in marketing natural gas, we often compete in the industrial end-user and utilities markets primarily on the basis of price.
Any decrease in the volumes that we gather, process, fractionate, or transport would adversely affect our financial condition, results of operations, or cash flows.
Our financial performance depends to a large extent on the volumes of natural gas, crude oil, condensate, and NGLs gathered, processed, fractionated, and transported on our assets. Decreases in the volumes of natural gas, crude oil, condensate, and NGLs we gather, process, fractionate, or transport would directly and adversely affect our financial condition. These volumes can be influenced by factors beyond our control, including:
•continued fluctuations in commodity prices, including the prices of natural gas, NGLs, crude oil, and condensate;
•environmental or other governmental regulations;
•weather conditions, including the impact of hurricanes and winter storms;
•increases in storage levels of natural gas, NGLs, crude oil, and condensate;
•increased use of alternative energy sources;
•decreased demand for natural gas, NGLs, crude oil, and condensate;
•economic conditions, including the impacts of COVID-19 (or any of its variants) or any other pandemic;
•supply disruptions;
•availability of supply connected to our systems; and
•availability and adequacy of infrastructure to gather and process supply into and out of our systems.
The volumes of natural gas, crude oil, condensate, and NGLs gathered, processed, fractionated, and transported on our assets also depend on the production from the regions that supply our systems. Supply of natural gas, crude oil, condensate, and NGLs can be affected by many of the factors listed above, including commodity prices and weather. In order to maintain or increase throughput levels on our systems, we must obtain new sources of natural gas, crude oil, condensate, and NGLs. The
primary factors affecting our ability to obtain non-dedicated sources of natural gas, crude oil, condensate, and NGLs include (i) the level of successful leasing, permitting, and drilling activity in our areas of operation, (ii) our ability to compete for volumes from new wells and (iii) our ability to compete successfully for volumes from sources connected to other pipelines. We have no control over the level of drilling activity in our areas of operation, the amount of reserves associated with wells connected to our systems, or the rate at which production from a well declines. In addition, we have no control over producers or their drilling or production decisions, which are affected by, among other things, the availability and cost of capital, levels of reserves, availability of drilling rigs, and other costs of production and equipment.
We typically do not obtain independent evaluations of hydrocarbon reserves; therefore, volumes we service in the future could be less than we anticipate.
We typically do not obtain independent evaluations of hydrocarbon reserves connected to our gathering systems or that we otherwise service due to the unwillingness of producers to provide reserve information as well as the cost of such evaluations. Accordingly, we do not have independent estimates of total reserves serviced by our assets or the anticipated life of such reserves. If the total reserves or estimated life of the reserves is less than we anticipate, and we are unable to secure additional sources, then the volumes transported on our gathering systems or that we otherwise service in the future could be less than anticipated. A decline in the volumes could have a material adverse effect on our financial condition, results of operations, or cash flows.
We may not be successful in balancing our purchases and sales.
We are a party to certain long-term gas, NGL, crude oil, and condensate sales commitments that we satisfy through supplies purchased under long-term gas, NGL, crude oil, and condensate purchase agreements. When we enter into those arrangements, our sales obligations generally match our purchase obligations. However, over time, the supplies that we have under contract may decline due to reduced drilling or other causes, and we may be required to satisfy the sales obligations by purchasing additional gas at prices that may exceed the prices received under the sales commitments. In addition, a producer could fail to deliver contracted volumes or deliver in excess of contracted volumes, or a consumer could purchase more or less than contracted volumes. Any of these actions could cause our purchases and sales not to be balanced. If our purchases and sales are not balanced, we will face increased exposure to commodity price risks and could have increased volatility in our operating income.
We have made commitments to purchase natural gas in production areas based on production-area indices and to sell the natural gas into market areas based on market-area indices, pay the costs to transport the natural gas between the two points, and capture the difference between the indices as margin. Changes in the index prices relative to each other (also referred to as basis spread) can significantly affect our margins or even result in losses.
Adverse developments in our gathering, transmission, processing, crude oil, condensate, natural gas, and NGL services businesses would adversely affect our financial condition and results of operations, and reduce our ability to make distributions to our unitholders.
We rely exclusively on the revenues generated from our gathering, transmission, processing, fractionation, crude oil, natural gas, condensate, and NGL services businesses, and as a result, our financial condition depends upon prices of, and continued demand for, natural gas, NGLs, crude oil, and condensate. An adverse development in one of these businesses may have a significant impact on our financial condition and our ability to make distributions to our unitholders.
We must continually compete for crude oil, condensate, natural gas, and NGL supplies, and any decrease in supplies of such commodities could adversely affect our financial condition, results of operations, or cash flows.
In order to maintain or increase throughput levels in our gathering systems and asset utilization rates at our processing plants and fractionators, we must continually contract for new product supplies. We may not be able to obtain additional contracts for crude oil, condensate, natural gas, and NGL supplies. The primary factors affecting our ability to connect new wells to our gathering facilities include our success in contracting for existing supplies that are not committed to other systems and the level of drilling activity near our gathering systems. If we are unable to maintain or increase the volumes on our systems by accessing new supplies to offset the natural decline in reserves, our business and financial results could be materially, adversely affected. In addition, our future growth will depend in part upon whether we can contract for additional supplies at a greater rate than the rate of natural decline in our current supplies.
Fluctuations in energy prices can greatly affect production rates and investments by third parties in the development of new crude oil, condensate, and natural gas reserves. As recently as 2020, during the COVID-19 pandemic, commodity prices fell,
which led to lower drilling activity, and resulted in lower volumes in the basins in which we operate. Although crude oil and natural gas prices and production activities have generally recovered to pre-pandemic levels, global capital investments by oil and natural gas producers remain at relatively low levels compared to historical levels, and producers remain cautious. Tax policy changes or additional regulatory restrictions on development could also have a negative impact on drilling activity, reducing supplies of product available to our systems and assets. Additional governmental regulation of, or delays in issuance of permits for, exploration and production industry may negatively impact current and future drilling activity. In addition, real or perceived differences in economic returns from various producing basins could influence producers to direct their future drilling activity away from basins in which we currently operate. We have no control over producers and depend on them to maintain sufficient levels of drilling activity. A continued decrease in the level of drilling activity or a material decrease in production in our principal geographic areas for a prolonged period, as a result of unfavorable commodity prices or otherwise, likely would have a material adverse effect on our financial condition, results of operations, and cash flows.
Our profitability is dependent upon prices and market demand for crude oil, condensate, natural gas, and NGLs that are beyond our control and have been volatile. A depressed commodity price environment could result in financial losses and reduce our cash available for distribution.
We are subject to significant risks due to fluctuations in commodity prices. We are directly exposed to these risks primarily in the gas processing and NGL fractionation components of our business. For the year ended December 31, 2021, approximately 6% of our total adjusted gross margin was generated under percent of liquids contracts and percent of proceeds contracts, with most of these contracts relating to our processing plants in the Permian Basin. Under percent of liquids contracts, we receive a fee in the form of a percentage of the liquids recovered, and the producer bears all the cost of the natural gas shrink. Accordingly, our revenues under percent of liquids contracts are directly impacted by the market price of NGLs. Adjusted gross margin under percent of proceeds contracts is impacted only by the value of the natural gas or liquids produced with margins higher during periods of higher natural gas and liquids prices.
We also realize adjusted gross margins under processing margin contracts. For the year ended December 31, 2021, less than 1% of our total adjusted gross margin was generated under processing margin contracts. We have a number of processing margin contracts for activities at our Plaquemine and Pelican processing plants. Under this type of contract, we pay the producer for the full amount of inlet gas to the plant, and we make a margin based on the difference between the value of liquids recovered from the processed natural gas as compared to the value of the natural gas volumes lost (“shrink”) and the cost of fuel used in processing. The shrink and fuel losses are referred to as plant thermal reduction (“PTR”). Our margins from these contracts can be greatly reduced or eliminated during periods of high natural gas prices relative to liquids prices.
We are also indirectly exposed to commodity prices due to the negative impacts of low commodity prices on production and the development of production of crude oil, condensate, natural gas, and NGLs connected to or near our assets and on the levels of volumes we transport between certain market centers.
Although the majority of our NGL fractionation business is under fee-based arrangements, a portion of our business is exposed to commodity price risk because we realize a margin due to product upgrades associated with our Louisiana fractionation business. For the year ended December 31, 2021, adjusted gross margin realized associated with product upgrades represented less than 2% of our adjusted gross margin.
Commodity prices were volatile during 2021. Crude oil prices increased 58%, weighted average NGL prices increased 77%, and natural gas prices increased 45% from January 1, 2021 to December 31, 2021. We expect continued volatility in these commodity prices. For example, see the table below for the range of closing prices for crude oil, NGL, and natural gas during 2021.
| | | | | | | | | | | | | | |
| Commodity | | Closing Price | | Date |
| Crude oil (high) (1) | | $ | 84.65 | | | October 26, 2021 |
| Crude oil (low) (1) | | $ | 47.62 | | | January 4, 2021 |
| Crude oil (average) (1)(4) | | $ | 68.11 | | | Not applicable |
| NGL (high) (2) | | $ | 1.02 | | | November 1, 2021 |
| NGL (low) (2) | | $ | 0.46 | | | January 4, 2021 |
| NGL (average) (2)(4) | | $ | 0.71 | | | Not applicable |
| Natural gas (high) (3) | | $ | 6.31 | | | October 5, 2021 |
| Natural gas (low) (3) | | $ | 2.45 | | | January 22, 2021 |
| Natural gas (average) (3)(4) | | $ | 3.72 | | | Not applicable |
____________________________
(1)Crude oil closing prices based on the NYMEX futures daily close prices.
(2)Weighted average NGL gas closing prices based on the Oil Price Information Service Napoleonville daily average spot liquids prices.
(3)Natural gas closing prices based on Gas Daily Henry Hub closing prices.
(4)The average closing price was computed by taking the sum of the closing prices of each trading day divided by the number of trading days during the period presented.
The markets and prices for crude oil, condensate, natural gas, and NGLs depend upon factors beyond our control that make it difficult to predict future commodity price movements with any certainty. These factors include the supply and demand for crude oil, condensate, natural gas, and NGLs, which fluctuate with changes in market and economic conditions and other factors, including:
•the impact of weather on the supply and demand for crude oil and natural gas;
•the level of domestic crude oil, condensate, and natural gas production;
•technology, including improved production techniques (particularly with respect to shale development);
•the level of domestic industrial and manufacturing activity;
•the availability of imported crude oil, natural gas, and NGLs;
•international demand for crude oil and NGLs;
•actions taken by foreign crude oil and gas producing nations;
•the continued threat of terrorism and the impact of military action and civil unrest;
•public health crises that reduce economic activity and affect the demand for travel, including the impacts of COVID-19 (or any of its variants) or any other pandemic;
•the availability of local, intrastate, and interstate transportation systems;
•the availability of downstream NGL fractionation facilities;
•the availability and marketing of competitive fuels;
•the development and adoption of alternative energy technologies, such as electric vehicles;
•the impact of energy conservation efforts; and
•the extent of governmental regulation and taxation, including the regulation of hydraulic fracturing and “greenhouse gases.”
Changes in commodity prices also indirectly impact our profitability by influencing drilling activity and well operations, and thus the volume of gas, crude oil, and condensate we gather and process and NGLs we fractionate. Volatility in commodity prices may cause our adjusted gross margin and cash flows to vary widely from period to period. Our hedging strategies may not be sufficient to offset price volatility risk and, in any event, do not cover all of our throughput volumes. Moreover, hedges are subject to inherent risks, which we describe in “Item 7A. Quantitative and Qualitative Disclosure about Market Risk.” Our use of derivative financial instruments does not eliminate our exposure to fluctuations in commodity prices and interest rates and has (in the past) resulted and could (in the future) result in financial losses or reductions in our income.
A reduction in demand for NGL products by the petrochemical, refining, or other industries or by the fuel markets could materially adversely affect our financial condition, results of operations, or cash flows.
The NGL products we produce have a variety of applications, including as heating fuels, petrochemical feedstocks, and refining blend stocks. A reduction in demand for NGL products, whether because of general or industry specific economic conditions, new government regulations, global competition, reduced demand by consumers for products made with NGL products (for example, reduced petrochemical demand observed due to lower activity in the automobile and construction industries), increased competition from petroleum-based feedstocks due to pricing differences, mild winter weather for some NGL applications, or other reasons could result in a decline in the volume of NGL products we handle or reduce the fees we charge for our services. Our NGL products and the demand for these products are affected as follows:
•Ethane. Ethane is typically supplied as purity ethane or as part of ethane-propane mix. Ethane is primarily used in the petrochemical industry as feedstock for ethylene, one of the basic building blocks for a wide range of plastics and other chemical products. Although ethane is typically extracted as part of the mixed NGL stream at gas processing plants, if natural gas prices increase significantly in relation to NGL product prices or if the demand for ethylene falls, it may be more profitable for natural gas processors to leave the ethane in the natural gas stream. Such “ethane rejection” reduces the volume of NGLs delivered for fractionation and marketing.
•Propane. Propane is used as a petrochemical feedstock in the production of ethylene and propylene, as a heating, engine, and industrial fuel, and in agricultural applications such as crop drying. Changes in demand for ethylene and propylene could adversely affect demand for propane. The demand for propane as a heating fuel is significantly affected by weather conditions. The volume of propane sold is at its highest during the six-month peak heating season of October through March. Demand for our propane may be reduced during periods of warmer-than-normal weather.
•Normal Butane. Normal butane is used in the production of isobutane, as a refined product blending component, as a fuel gas, and in the production of ethylene and propylene. Changes in the composition of refined products resulting from governmental regulation, changes in feedstocks, products, and economics, demand for heating fuel and for ethylene and propylene could adversely affect demand for normal butane.
•Isobutane. Isobutane is predominantly used in refineries to produce alkylates to enhance octane levels. Accordingly, any action that reduces demand for motor gasoline or demand for isobutane to produce alkylates for octane enhancement might reduce demand for isobutane.
•Natural Gasoline. Natural gasoline is used as a blending component for certain refined products and as a feedstock used in the production of ethylene and propylene. Changes in the mandated composition resulting from governmental regulation of motor gasoline and in demand for ethylene and propylene could adversely affect demand for natural gasoline.
NGLs and products produced from NGLs are sold in competitive global markets. Any reduced demand for ethane, propane, normal butane, isobutane, or natural gasoline in the markets we access for any of the reasons stated above could adversely affect demand for the services we provide as well as NGL prices, which would negatively impact our financial condition, results of operations, or cash flows.
Increasing scrutiny and changing expectations from stakeholders with respect to our environmental, social and governance practices may impose additional costs on us or expose us to new or additional risks.
Companies across all industries are facing increasing scrutiny from stakeholders related to their environmental, social, and governance (“ESG”) practices. Investor advocacy groups, certain institutional investors, investment funds, and other influential investors are also increasingly focused on ESG practices and in recent years have placed increasing importance on the implications and social cost of their investments. Regardless of the industry, investors’ increased focus and activism related to ESG and similar matters may hinder access to capital, as investors may decide to reallocate capital or to not commit capital as a result of their assessment of a company’s ESG practices. Companies that do not adapt to or comply with investor or stakeholder expectations and standards, which are evolving, or which are perceived to have not responded appropriately to the growing concern for ESG issues, regardless of whether there is a legal requirement to do so, may suffer from reputational damage and the business, financial condition, and/or stock price of such a company could be materially and adversely affected.
We could also face pressures from stakeholders, who are increasingly focused on climate change, to prioritize sustainable energy practices, reduce our carbon footprint and promote sustainability. These stakeholders could require us to implement ESG procedures or standards in order to remain invested in us or before they could make further investments in us.
Additionally, we could face reputational challenges in the event our ESG procedures or standards do not meet the standards set by certain constituencies. We have adopted certain practices as highlighted in our annual sustainability report, including a focus on environmental stewardship by operating our assets and constructing new facilities in order to minimize our footprint and environmental impact, control pollution, and conserve resources. It is possible, however, that our stakeholders might not be satisfied with our sustainability efforts or the speed of their adoption. If we do not meet stakeholder expectations, our business, ability to access capital, and/or our common unit price could be harmed.
Additionally, adverse effects upon the oil and gas industry related to the worldwide social and political environment, including uncertainty or instability resulting from climate change, changes in political leadership and environmental policies, changes in geopolitical-social views toward fossil fuels and renewable energy, concern about the environmental impact of climate change and investors’ expectations regarding ESG matters, may also adversely affect demand for our services. Any long-term material adverse effect on the oil and gas industry could have a significant financial and operational adverse impact on our business.
Our business is subject to a number of weather-related risks. These weather conditions can cause significant damage and disruption to our operations and adversely impact our financial condition, results of operations, or cash flows.
Virtually all of our operations are exposed to potential natural disasters, including hurricanes, tornadoes, storms, floods, ice storms, blizzards, extreme cold weather, fires, severe temperatures, and earthquakes, and also disruptions caused by these natural events, such as electrical blackouts. In particular, South Louisiana and the Texas Gulf Coast experience hurricanes and other extreme weather conditions on a frequent basis. The location of significant assets and concentration of activity in these regions make us particularly vulnerable to weather risks in these areas.
During the third quarter of 2021, we experienced a temporary loss of some processing volumes in our Louisiana operations due to the effects of Hurricane Ida, which forced a temporary shut-down of some of our operations and those of our downstream customers. All of our operations and those of our customers are now operating normally. In 2020, our Louisiana assets were also affected by hurricanes. The location of significant assets and concentration of activity in these active hurricane regions make us particularly vulnerable to weather events in these areas.
In addition, our assets are vulnerable to winter storms and extreme cold weather. For example, in February 2021, the areas in which we operate experienced a severe winter storm, with extreme cold, ice, and snow occurring over an unprecedented period of approximately 10 days (“Winter Storm Uri”). Winter Storm Uri adversely affected our facilities and activities across our footprint, as it did for producers and other midstream companies located in these areas. The severe cold temperatures caused production freeze-offs and also led some producers to proactively shut-in their wells to preserve well integrity. As a result, our gathering and processing volumes were significantly reduced during this period, with peak volume declines ranging between 44% and 92%, depending on the region.
High winds, storm surge, flooding, ice storms, extreme cold weather, and other natural disasters can cause significant damage and curtail our operations for extended periods during and after such weather conditions and could cause significant disruptions in electrical power, all of which may result in decreased revenues and otherwise adversely impact our financial condition, results of operations, or cash flow. These interruptions could involve significant damage to people, property, or the environment, and repair time and costs could be extensive. Any such event that interrupts the revenues generated by our operations, or which causes us to make significant expenditures not covered by insurance, could reduce our cash available for paying distributions to our unitholders and, accordingly, adversely affect our financial condition and the market price of our securities. Moreover, as a larger portion of our operations become dependent on a steady supply of electric power to operate, in part as a result of a shift to electrical power in order to minimize CO2 emissions, we would be more vulnerable to events such as extreme weather that cause blackouts, which could disrupt our operations and persist for a significant period of time.
In addition, we rely on the volumes of natural gas, crude oil, condensate, and NGLs gathered, processed, fractionated, and transported on our assets. These volumes are influenced by the production from the regions that supply our systems. Adverse weather conditions and persistent electrical blackouts can cause direct or indirect disruptions to the operations of, and otherwise negatively affect, producers, suppliers, customers, and other third parties to which our assets are connected, even if our assets are not damaged. As a result, our financial condition, results of operations, and cash flows could be adversely affected. Also, disruptions in our operations, which affect our customers and other third parties, have generated, and could in the future generate, commercial and legal disputes with these parties that could cause us to pay damages or make business concessions to these parties, and these damages or business concessions might be costly to the Company and adversely affect our financial condition, results of operation, and cash flows.
Our pipeline operations along the Gulf Coast and offshore could be impacted by subsidence and coastal erosion. Such processes could cause serious damage to our pipelines, which could affect our ability to provide transportation services.
Additionally, such processes could impact our customers who operate along the Gulf Coast, and they may be unable to utilize our services. Subsidence and coastal erosion could also expose our operations to increased risks associated with severe weather conditions, such as hurricanes, flooding, and rising sea levels. As a result, we may incur significant costs to repair and preserve our pipeline infrastructure. Such costs could adversely affect our financial condition, results of operations, or cash flows.
We are dependent on certain large customers for a substantial portion of the natural gas that we gather, process, and transport. The loss of any of these customers would adversely affect our financial condition, results of operations, or cash flows.
We are dependent on certain large customers for a substantial portion of our natural gas supply. For the year ended December 31, 2021, Dow Hydrocarbons and Resources LLC, Marathon Petroleum Corporation, and Devon represented 14.5%, 13.4%, and 6.7%, respectively, of our consolidated revenues and each also represented a similar percentage of our adjusted gross margin. We expect to derive a significant portion of our revenues from these customers for the foreseeable future. As a result, any development, whether in our area of operations or otherwise, that adversely affects their production, financial condition, leverage, market reputation, liquidity, results of operations, or cash flows may adversely affect our revenues and cash available for distribution.
Further, we are subject to the risk of non-payment or non-performance by these customers. We cannot predict the extent to which these customers’ business will be impacted by pricing conditions in the energy industry, nor can we estimate the impact such conditions would have on these customers’ ability to perform under our gathering and processing agreements. If we were to lose any of these customers, and we are unable to replace the shortfall revenue from other sources, our operating results and cash flows would be adversely affected.
If we do not make acquisitions on economically acceptable terms or efficiently and effectively integrate the acquired assets with our asset base, our future growth will be limited.
Our ability to grow depends, in part, on our ability to make acquisitions that result in an increase in cash generated from operations on a per unit basis. If we are unable to make accretive acquisitions either because we are (1) unable to identify attractive acquisition candidates or negotiate acceptable purchase contracts with them, (2) unable to obtain financing for these acquisitions on economically acceptable terms or at all or (3) outbid by competitors, then our future growth and our ability to increase distributions will be limited.
From time to time, we may evaluate and seek to acquire assets or businesses that we believe complement our existing business and related assets. We may acquire assets or businesses that we plan to use in a manner materially different from their prior owner’s use. Any acquisition involves potential risks, including:
•the inability to integrate the operations of recently acquired businesses or assets, especially if the assets acquired are in a new business segment or geographic area;
•the diversion of management’s attention from other business concerns;
•the failure to realize expected volumes, revenues, profitability, or growth;
•the failure to realize any expected synergies and cost savings;
•the coordination of geographically disparate organizations, systems, and facilities;
•the assumption of unknown liabilities;
•the loss of customers or key employees from the acquired businesses;
•a significant increase in our indebtedness; and
•potential environmental or regulatory liabilities and title problems.
Management’s assessment of these risks is inexact and may not reveal or resolve all existing or potential problems associated with an acquisition. Realization of any of these risks could adversely affect our operations and cash flows. If we consummate any future acquisition, our capitalization and results of operations may change significantly, and you will not have the opportunity to evaluate the economic, financial, and other relevant information that we will consider in determining the application of these funds and other resources.
We intend to enter into new businesses in connection with our strategy to participate in the energy transition. If we are unable to execute on this strategy or operate these new lines of business effectively, our future growth could be limited. These new lines of business may never develop or may present risks that we cannot effectively manage.
As part of our strategy, we intend to build a CCS business, and we may enter into other new lines of business as part of adapting to the energy transition. These are new businesses that have no track record and which, while similar to our existing businesses, may present different challenges and risks. We may be unable to execute on our business plans, demand for these new services may not develop on a large or economic scale, or we may fail to operate these businesses effectively. In addition, we may not be able to compete with companies who also plan to enter into these new lines of business, and who may be larger than us and may have greater financial resources to devote to these businesses. These new businesses may also present novel issues in law, taxation, safety or environmental policy, and other areas that we may not be able to manage effectively. Management’s assessment of the risks in these new lines of business may be inexact and not identify or resolve all the problems that we would face. If we were not able to enter into these new lines of business effectively or at all, it could limit our future growth as lines of business connected to the energy transition grow and become a more important part of the energy business.
We do not own all of the land on which our pipelines, compression, and plant facilities are located, which could disrupt our operations.
We do not own all of the land on which our pipelines, compression, and plant facilities are located, and we are therefore subject to the possibility of more onerous terms and/or increased costs to retain necessary land use if we do not have valid rights-of-way or leases or if such rights-of-way or leases lapse or terminate. We sometimes obtain the rights to land owned by third parties and governmental agencies for a specific period of time. Our loss of these rights, through our inability to renew right-of-way contracts, leases, or otherwise, could cause us to cease operations on the affected land, increase costs related to continuing operations elsewhere, and reduce our revenue.
Our business involves many hazards and operational risks, some of which may not be fully covered by insurance. The occurrence of a significant accident or other event that is not fully insured could adversely affect our operations and financial condition.
Our operations are subject to the many hazards inherent in the gathering, compressing, processing, transporting, fractionating, disposing, and storage of natural gas, NGLs, condensate, crude oil, and brine, including:
•damage to pipelines, facilities, storage caverns, equipment, and surrounding properties caused by hurricanes, floods, sink holes, fires, and other natural disasters and acts of terrorism;
•inadvertent damage to our assets from construction or farm equipment;
•leaks of natural gas, NGLs, crude oil, condensate, and other hydrocarbons;
•induced seismicity;
•rail accidents, barge accidents, and truck accidents;
•equipment failure; and
•fires and explosions.
These risks could result in substantial losses due to personal injury and/or loss of life, severe damage to and destruction of property and equipment, and pollution or other environmental damage and may result in curtailment or suspension of our related operations. We are not fully insured against all risks incident to our business. In accordance with typical industry practice, we have appropriate levels of business interruption and property insurance on our underground pipeline systems. We are not insured against all environmental accidents that might occur. If a significant accident or event occurs that is not fully insured, it could adversely affect our operations and financial condition.
We conduct a portion of our operations through joint ventures, which subjects us to additional risks that could have a material adverse effect on the success of these operations, our financial position, results of operations, or cash flows.
We participate in several joint ventures, and we may enter into other joint venture arrangements in the future. The nature of a joint venture requires us to share control with unaffiliated third parties. If our joint venture partners do not fulfill their contractual and other obligations, the affected joint venture may be unable to operate according to its business plan, and we may be required to increase our level of commitment. If we do not timely meet our financial commitments or otherwise comply with our joint venture agreements, our ownership of and rights with respect to the applicable joint venture may be reduced or otherwise adversely affected. In addition, certain of our joint venture arrangements provide our joint venture partners with the right, under certain circumstances, to cause us to purchase their interest in the joint venture or to seek to sell the entire joint venture. Differences in views among joint venture participants could also result in delays in business decisions or otherwise,
failures to agree on major issues, operational inefficiencies and impasses, litigation, or other issues. Third parties may also seek to hold us liable for the joint ventures’ liabilities. These issues or any other difficulties that cause a joint venture to deviate from its original business plan could have a material adverse effect on our financial condition, results of operations, or cash flows.
If third-party pipelines or other midstream facilities interconnected to our gathering or transportation systems become partially or fully unavailable, or if the volumes we gather, process, or transport do not meet the quality requirements of the pipelines or facilities to which we connect, our adjusted gross margin and cash flow could be adversely affected.
Our gathering, processing, and transportation assets connect to other pipelines or facilities owned and operated by unaffiliated third parties. The continuing operation of, and our continuing access to, such third-party pipelines, processing facilities, and other midstream facilities is not within our control. These pipelines, plants, and other midstream facilities may become unavailable because of testing, turnarounds, line repair, maintenance, reduced operating pressure, lack of operating capacity, regulatory requirements, and curtailments of receipt or deliveries due to insufficient capacity or because of damage from severe weather conditions or other operational issues. Further, these pipelines and facilities connected to our assets impose product quality specifications. We may be unable to access such facilities or transport product along interconnected pipelines if the volumes we gather or transport do not meet their product quality requirements. In addition, if our costs to access and transport on these third-party pipelines significantly increase, our profitability could be reduced. If any such increase in costs occurs, if any of these pipelines or other midstream facilities become unable to receive, transport, or process product, or if the volumes we gather or transport do not meet the product quality requirements of such pipelines or facilities, it will adversely affect our financial condition, results of operations, or cash flows.
Our success depends on key members of our management, the loss or replacement of whom could disrupt our business operations.
We depend on the continued employment and performance of the officers of the Operating Partnership and key operational personnel. If any of these officers or other key personnel resign or become unable to continue in their present roles and are not adequately replaced, our business operations could be materially adversely affected. We do not maintain any “key man” life insurance for any officers.
Failure to attract and retain an appropriately qualified workforce could reduce labor productivity and increase labor costs, which could have a material adverse effect on our business and results of operations.
Gathering and compression services require laborers skilled in multiple disciplines, such as equipment operators, mechanics, and engineers, among others. Our business is dependent on our ability to recruit, retain, and motivate employees. Certain circumstances, such as an aging workforce without appropriate replacements, a mismatch of existing skill sets to future needs, competition for skilled labor, or the unavailability of contract resources, may lead to operating challenges such as a lack of resources, loss of knowledge, or a lengthy time period associated with skill development. Our costs, including costs for contractors to replace employees, productivity costs, and safety costs, may rise. In addition, it has been widely reported in the press and elsewhere that businesses have faced a more challenging hiring environment since the onset of the pandemic and have had to pay higher wages to attract skilled labor. Failure to hire and adequately train replacement employees, including the transfer of significant internal historical knowledge and expertise to the new employees, or the future availability and cost of contract labor may adversely affect our ability to manage and operate our business. If we are unable to successfully attract and retain an appropriately qualified workforce, our results of operations could be negatively affected.
Our use of derivative financial instruments does not eliminate our exposure to fluctuations in commodity prices and interest rates and has in the past and could in the future result in financial losses or reduce our income.
Our operations expose us to fluctuations in commodity prices, and the Consolidated Credit Facility and the AR Facility expose us to fluctuations in interest rates. We use over-the-counter price and basis swaps with other natural gas merchants and financial institutions. Use of these instruments is intended to reduce our exposure to volatility in commodity prices. As of December 31, 2021, we have hedged only portions of our expected exposures to commodity price risk. In addition, to the extent we hedge our commodity price risk using swap instruments, we will forego the benefits of favorable changes in commodity prices.
Even though monitored by management, our hedging activities may fail to protect us and could reduce our earnings and cash flow. Our hedging activity may be ineffective or adversely affect cash flow and earnings because, among other factors, variations in the index we use to price a commodity hedge may not adequately correlate with variations in the index we use to sell the physical commodity (known as basis risk), and we may not produce or process sufficient volumes to cover swap arrangements we enter into for a given period. In addition, our counterparty in any hedging transaction could default on its obligation to pay or otherwise fail to perform. If our actual volumes are lower than the volumes we estimated when entering
into a swap for the period, we might be forced to satisfy all or a portion of our derivative obligation without the benefit of cash flow from our sale or purchase of the underlying physical commodity, which could adversely affect our liquidity.
A failure in our computer systems or a terrorist or cyberattack on us, or third parties with whom we have a relationship, may adversely affect our ability to operate our business.
We are reliant on technology to conduct our business. Our business is dependent upon our operational and financial computer systems and those of our third-party providers with whom we are connected to process the data necessary to conduct almost all aspects of our business, including operating our pipelines, plants, truck fleet, and other facilities, recording and reporting commercial and financial transactions, and receiving and making payments. Dependence on automated systems may increase the risks related to operational systems failures and breaches of critical operational or financial controls, and tampering or deliberate manipulation of such systems may result in losses that are difficult to detect. In addition, any failure of our or our third-party providers’ computer systems, or those of our customers, suppliers, or others with whom we do business, could materially disrupt our ability to operate our business. Some individuals and groups, including criminal organizations and state-sponsored groups, have attempted to gain unauthorized access to computer networks of U.S. businesses and mounted cyberattacks to disable or disrupt computer systems, disrupt operations, and steal funds or data including through phishing schemes, which are attempts to obtain unauthorized access by targeted acts of deception against individuals with legitimate access to physical locations or information. For example, in 2021, a company in the midstream industry suffered a ransomware cyberattack that impacted computerized equipment managing a pipeline and resulted in the halt of the pipeline’s operations in order to contain the attack.
Cyberattacks could also result in the loss of confidential or proprietary data or security breaches of other information technology and pipeline systems that could damage our reputation and disrupt our operations and critical business functions. Due to COVID-19 protocols, many of our employees and those of our service providers, vendors and customers have been accessing computer systems remotely where their cybersecurity protections may be less robust and our cybersecurity procedures and safeguards may be less effective. Our assets may also be targets of vandalism, theft, destructive forms of protests and opposition by extremists, including acts of sabotage and terrorism, that could disrupt our ability to conduct our business and may have a material adverse effect on our business and results of operations. Furthermore the U.S. government has continued to issue public warnings that the nation’s strategic infrastructure, such as energy-related assets, may be at greater risk of future terrorist or cyberattacks than other targets in the United States. Any such terrorist or cyberattack that affects us or our customers, suppliers, or others with whom we do business, or that severely disrupts the markets we serve, could have a material adverse effect on our business, cause us to incur a material financial loss, subject us to possible legal claims and liability, and/or damage our reputation. Our insurance may not protect us against losses relating to such occurrences.
Moreover, as cyberattacks continue to evolve, we may be required to expend significant additional resources to further enhance our digital security or to remediate vulnerabilities. In addition, cyberattacks against us or others in our industry could result in additional regulations, which could lead to increased regulatory compliance costs, insurance coverage cost, or capital expenditures and any failure by us to comply with these additional regulations could result in significant penalties and liability to us. We cannot predict the potential impact to our business or the energy industry resulting from additional regulations.
Environmental, Legal Compliance, and Regulatory Risks
Increased federal, state, and local legislation, and regulatory initiatives, as well as government reviews, relating to hydraulic fracturing could result in increased costs and reductions or delays in natural gas production by our customers, which could adversely impact our revenues and results of operations.
A portion of our suppliers’ and customers’ natural gas production is developed from unconventional sources, such as deep gas shales, that require hydraulic fracturing as part of the completion process. State legislatures and agencies have enacted legislation and promulgated rules to regulate hydraulic fracturing, require disclosure of hydraulic fracturing chemicals, temporarily or permanently ban hydraulic fracturing and impose additional permit requirements and operational restrictions in certain jurisdictions or in environmentally sensitive areas. EPA and the BLM have also issued rules, conducted studies, and made proposals that, if implemented, could either restrict the practice of hydraulic fracturing or subject the process to further regulation. For instance, the EPA has issued final regulations under the federal Clean Air Act establishing performance standards, including standards for the capture of air emissions released during hydraulic fracturing, and adopted rules prohibiting the discharge of wastewater from hydraulic fracturing operations to publicly owned wastewater treatment plants. The EPA announced its intention to reconsider the regulations relating to the capture of air emissions in April 2017 and sought to stay its requirements, however, EPA’s stay of these requirements was vacated by the D.C. Circuit in July 2017. In September 2020, the EPA published two additional final rules, the 2020 Policy Rule and the 2020 Technical Amendments. The 2020 Policy Rule removed sources in the transmission and storage segments from the regulated source category and rescinding the
application of the NSPS and methane-specific requirements to these sources. On January 21, 2021, President Biden issued an Executive Order on “Protecting Public Health and the Environment and Restoring Science to Tackle the Climate Crisis” directing the EPA to consider publishing for notice and comment, by September 2021, a proposed rule suspending, revising, or rescinding the September 2020 NSPS for the oil and natural gas sector, and on June 30, 2021, President Biden signed a joint congressional resolution rescinding the 2020 Policy rule. In November 2021, the EPA proposed a new rule targeting methane and VOC emissions from new and existing oil and gas sources, including sources in the production, processing, transmission, and storage segments. The proposed rule would: (1) update NSPS subpart OOOOa; (2) adopt a new NSPS subpart OOOOb for sources that commence construction, modification, or reconstruction after the date the proposed rule is published in the Federal Register; and (3) adopt a new NSPS subpart OOOOc to establish emissions guidelines, which will inform state plans to establish standards for existing sources. The BLM also adopted new rules, effective on January 17, 2017, to reduce venting, flaring and leaks during oil and natural gas production activities on onshore federal and Indian leases. In September 2018, BLM published a final rule that repealed several of the requirements of the 2016 methane rule. The September 2018 rule was challenged in the U.S. District Court for the Northern District of California almost immediately after issuance. In July 2020, the U.S. District Court for the Northern District of California vacated BLM’s 2018 revision rule. Additionally, in October 2020, a Wyoming federal district judge vacated the 2016 venting and flaring rule. Environmental groups have appealed the October 2020 decision, and litigation is ongoing.
In addition, President Biden has declared that he would support federal government efforts to limit or prohibit hydraulic fracturing. These declarations include threats to take actions banning hydraulic fracturing of crude oil and natural gas wells and banning new leases for production of minerals on federal properties, including onshore lands and offshore waters. On January 20, 2021, the Acting Secretary for the Department of the Interior signed an order suspending new fossil fuel leasing and permitting on federal lands for 60 days, which may cover our offshore pipeline permits. Several states filed lawsuits challenging the suspension and on June 15, 2021, a judge in the U.S. District Court for the Western District of Louisiana issued a nationwide temporary injunction blocking the suspension. The Department of the Interior appealed the U.S. District Court’s ruling, but resumed oil and gas leasing pending resolution of the appeal. In November 2021, the Department of the Interior completed its review and issued a report on the federal oil and gas leasing program. The Department of the Interior’s report recommends several changes to federal leasing practices, including changes to royalty payments, bidding, and bonding requirements. If our customers are unable to secure permits, sustained reductions in exploration or production activity in our areas of operation could lead to reduced utilization of our pipeline and terminal systems or reduced rates under renegotiated transportation or storage agreements. We are still evaluating the effects of the recent order on our operations and our customers’ operations, but our inability and our customers’ inability to secure required permits could adversely affect our business, financial condition, results of operations, or cash flows, including our ability to make cash distributions to our unitholders. The Biden administration could also pursue the imposition of more restrictive requirements for the establishment of pipeline infrastructure or the permitting of LNG export facilities.
State and federal regulatory agencies also have recently focused on a possible connection between the operation of injection wells used for oil and gas waste waters and an observed increase in induced seismicity, which has resulted in some regulation at the state level. For instance, in December 2016 the Oklahoma Corporation Commission released well completion seismicity guidelines for operators in the STACK play that call for hydraulic fracturing operations to be suspended following earthquakes of certain magnitudes in the vicinity. As regulatory agencies continue to study induced seismicity, additional legislative and regulatory initiatives could affect our brine disposal operations and our customers’ injection well operations, which could impact our gathering business.
We cannot predict whether any additional legislation or regulations will be enacted regarding hydraulic fracturing and, if so, what the provisions would be. If additional levels of regulation and permits or a ban on new leases on federal lands were to be implemented through the adoption of new laws and regulations at the federal or state level, that could lead to delays, increased operating costs, process prohibitions and fewer drilling opportunities for our suppliers and customers that could reduce the volumes of natural gas or crude oil that move through our gathering systems, which could materially adversely affect our revenue and results of operations.
Climate change legislation and regulatory initiatives could result in increased operating costs and reduced demand for the natural gas and NGL services we provide.
The United States Congress has from time to time considered adopting legislation to reduce emissions of GHGs, and there has been a wide-ranging policy debate, both nationally and internationally, regarding the impact of these gases and possible means for their regulation. In addition, efforts have been made and continue to be made in the international community toward the adoption of international treaties or protocols that would address global climate change issues. In 2015, the United States participated in the United Nations Conference on Climate Change, which led to the adoption of the Paris Agreement. The Paris Agreement became effective November 4, 2016 and requires countries to review and “represent a progression” in their intended nationally determined contributions, which set GHG emission reduction goals, every five years beginning in 2020. In November 2019, the State Department formally informed the United Nations of the United States’ withdrawal from the Paris
Agreement and withdrew from the agreement in November 2020. However, on January 20, 2021, President Biden signed an instrument that reverses this withdrawal, and the United States formally re-joined the Paris Agreement on February 19, 2021. At the federal regulatory level, both the EPA and the BLM have adopted regulations for the control of methane emissions, which also include leak detection and repair requirements, from the oil and gas industry. Additionally, President Biden has issued an executive order seeking to adopt new regulations and policies to address climate change and suspend, revise, or rescind prior agency actions that are identified as conflicting with the Biden Administration’s climate policies.
Governmental, scientific and public concern over the threat of climate change arising from GHG emissions has resulted in increasing political risks in the U.S.. President Biden declared that he would support federal government efforts to limit or prohibit hydraulic fracturing and ban new leases for production of minerals on federal properties, including onshore lands and offshore waters. In addition, as discussed under “Item 1. Business—Regulation,” on January 20, 2021, the Acting Secretary for the Department of the Interior signed an order suspending new fossil fuel leasing and permitting on federal lands, including offshore pipeline leases, for 60 days. Then on January 27, 2021, President Biden issued an executive order indefinitely suspending new oil and natural gas leases on public lands or in offshore waters pending completion of a comprehensive review and reconsideration of federal oil and gas permitting and leasing practices. Several states filed lawsuits challenging the suspension and on June 15, 2021, a federal judge issued a nationwide temporary injunction blocking the suspension. The Department of the Interior appealed the judge’s ruling but resumed oil and gas leasing pending resolution of the appeal. The Biden administration could also pursue the imposition of more restrictive requirements for the establishment of pipeline infrastructure or the permitting of LNG export facilities.
In addition, many states have already taken legal measures to reduce emissions of GHGs, primarily through the planned development of GHG emission inventories and/or regional GHG cap and trade programs. Most of these cap and trade programs work by requiring either major sources of emissions, such as electric power plants, or major producers of fuels, such as refineries and NGL fractionation plants, to acquire and surrender emission allowances with the number of allowances available for purchase reduced each year until the overall GHG emission reduction goal is achieved.
In addition to the regulatory efforts described above, there have also been efforts in recent years aimed at the investment community, including investment advisors, sovereign wealth funds, public pension funds, universities, and other groups, promoting the divestment of fossil fuel equities as well as pressuring lenders and other financial services companies and their regulators, such as the Federal Reserve, to limit or curtail activities with fossil fuel companies. These efforts could have a material adverse effect on the price of our securities and our ability to access equity capital markets. Members of the investment community have begun to screen companies such as ours for sustainability performance, including practices related to GHGs and climate change, before investing in our securities. In addition, discussions of GHG emissions and their possible impacts have become more widespread generally in society and public sentiment regarding these topics may become more challenging for fossil fuel companies. As a result, we could experience additional costs or financial penalties, delayed or cancelled projects, and/or reduced production and reduced demand for hydrocarbons, which could have a material adverse effect on our earnings, cash flows, and financial condition. Furthermore, recent judicial decisions have allowed certain tort claims brought by government and private plaintiffs alleging property damages due to climate change to proceed against GHG emissions sources, which may increase our litigation risk for such claims. Increasing scrutiny and changing expectations from stakeholders with respect to our environmental, social and governance practices may impose additional costs on us or expose us to new or additional risks.
Although it is not possible at this time to predict whether future legislation or new regulations may be adopted to address GHG emissions or how such measures would impact our business, the adoption of legislation or regulations imposing reporting or permitting obligations on, or limiting emissions of GHGs from, our equipment and operations could require us to incur additional costs to reduce emissions of GHGs associated with our operations, could adversely affect our performance of operations in the absence of any permits that may be required to regulate emission of GHGs, or could adversely affect demand for the natural gas or crude oil we gather, process, or otherwise handle in connection with our services. Moreover, many scientists have concluded that increasing concentrations of GHGs may produce climate changes associated with an increase in severity and frequency of extreme weather conditions which may affect our operations. See “—Our business is subject to a number of weather-related risks. These weather conditions can cause significant damage and disruption to our operations and adversely impact our financial condition, results of operations, or cash flows” for more information regarding risks from extreme weather conditions.
Our operations are dependent on our rights and ability to receive or renew the required permits and other approvals from governmental authorities and other third parties.
Performance of our operations requires that we obtain and maintain numerous environmental and land use permits and other approvals authorizing our business activities. A decision by a governmental authority or other third party to deny, delay,
or restrictively condition the issuance of a new or renewed permit or other approval, or to revoke or substantially modify an existing permit or other approval, could have a material adverse effect on our ability to initiate or continue operations at the affected location or facility. Expansion of our existing operations is also predicated on securing the necessary environmental or land use permits and other approvals, which we may not receive in a timely manner or at all.
In order to obtain permits and renewals of permits and other approvals in the future, we may be required to prepare and present data to governmental authorities pertaining to the potential adverse impact that any proposed activities may have on the environment, individually or in the aggregate, including on public and Indian lands. Certain approval procedures may require preparation of archaeological surveys, endangered species studies, and other studies to assess the environmental impact of new sites or the expansion of existing sites. Compliance with these regulatory requirements is expensive and significantly lengthens the time needed to develop a site or pipeline alignment. Also, obtaining or renewing required permits or other approvals is sometimes delayed or prevented due to community opposition and other factors beyond our control. The denial of a permit or other approvals essential to our operations or the imposition of restrictive conditions with which it is not practicable or feasible to comply could impact our operations or prevent our ability to expand our operations or obtain rights-of-way. Significant opposition to a permit or other approvals by neighboring property owners, members of the public, or non-governmental organizations, or other third parties or delays in the environmental review and permitting process also could impact our operations or prevent our ability to expand our operations or obtain rights-of-way.
Transportation on certain of our natural gas pipelines is subject to federal and state rate and service regulation, which could limit the revenues we collect from our customers and adversely affect the cash available for distribution to our unitholders. The imposition of regulation on our currently unregulated natural gas pipelines also could increase our operating costs and adversely affect the cash available for distribution to our unitholders.
The rates, terms, and conditions of service under which we transport natural gas in our pipeline systems in interstate commerce are subject to regulation by FERC under the NGA and Section 311 of the NGPA and the rules and regulations promulgated under those statutes. Under the NGA, FERC regulation requires that interstate natural gas pipeline rates be filed with FERC and that these rates be “just and reasonable,” not unduly preferential and not unduly discriminatory, although negotiated or settlement rates may be accepted in certain circumstances. Interested persons may challenge proposed new or changed rates, and FERC is authorized to suspend the effectiveness of such rates pending an investigation or hearing. FERC may also investigate, upon complaint or on its own motion, rates that are already in effect and may order a pipeline to change its rates prospectively. Accordingly, action by FERC could adversely affect our ability to establish rates that cover operating costs and allow for a reasonable return. An adverse determination in any future rate proceeding brought by or against us could have a material adverse effect on our business, financial condition, results of operations, and cash available for distribution. Under the NGPA, we are required to justify our rates for interstate transportation service on a cost-of-service basis every five years. In addition, our intrastate natural gas pipeline operations are subject to regulation by various agencies of the states in which they are located. Should FERC or any of these state agencies determine that our rates for transportation service should be lowered, our business could be adversely affected.
Our natural gas gathering and processing activities generally are exempt from FERC regulation under the Natural Gas Act. However, the distinction between FERC-regulated transmission services and federally unregulated gathering services is the subject of substantial, ongoing litigation, so the classification and regulation of our gathering facilities are subject to change based on future determinations by FERC and the courts. Natural gas gathering may receive greater regulatory scrutiny at both the state and federal levels since FERC has less extensively regulated the gathering activities of interstate pipeline transmission companies, and a number of such companies have transferred gathering facilities to unregulated affiliates. Application of FERC jurisdiction to our gathering facilities could increase our operating costs, decrease our rates, and adversely affect our business. Our gathering operations also may be or become subject to safety and operational regulations relating to the design, installation, testing, construction, operation, replacement, and management of gathering facilities. Additional rules and legislation pertaining to these matters are considered or adopted from time to time. We cannot predict what effect, if any, such changes might have on our operations, but the industry could be required to incur additional capital expenditures and increased costs depending on future legislative and regulatory changes.
If we fail to comply with all the applicable FERC-administered statutes, rules, regulations, and orders, we could be subject to substantial penalties and fines. Under the EPAct 2005, FERC has civil penalty authority to impose penalties for current violations of the NGA or NGPA of up to $1.0 million per day for each violation. The maximum penalty authority established by statute has been adjusted to approximately $1.39 million per day and will continue to be adjusted periodically for inflation. FERC also has the power to order disgorgement of profits from transactions deemed to violate the NGA and EPAct 2005.
Other state and local regulations also affect our business. We are subject to some ratable take and common purchaser statutes in the states where we operate. Ratable take statutes generally require gatherers to take, without undue discrimination, natural gas production that may be tendered to the gatherer for handling. Similarly, common purchaser statutes generally require gatherers to purchase without undue discrimination as to source of supply or producer. These statutes have the effect of restricting our right as an owner of gathering facilities to decide with whom we contract to purchase or transport natural gas. Federal law leaves any economic regulation of natural gas gathering to the states, and some of the states in which we operate have adopted complaint-based or other limited economic regulation of natural gas gathering activities. States in which we operate that have adopted some form of complaint-based regulation, like Texas, generally allow natural gas producers and shippers to file complaints with state regulators in an effort to resolve grievances relating to natural gas gathering access and rate discrimination.
Transportation on our liquids pipelines is subject to federal and state rate and service regulation, which could limit the revenues we collect from our customers and adversely affect the cash available for distribution to our unitholders. The imposition of regulation on our currently unregulated liquids pipeline operations also could increase our operating costs and adversely affect the cash available for distribution to our unitholders.
Our interstate liquids transportation pipelines are subject to regulation by FERC under the ICA, the Energy Policy Act of 1992, and the rules and regulations promulgated under those laws. If, upon completion of an investigation, FERC finds that new or changed rates are unlawful, it is authorized to require the pipeline to refund revenues collected in excess of the just and reasonable rates during the term of the investigation. FERC may also investigate, upon complaint or on its own motion, rates that are already in effect and may order a carrier to change its rates prospectively if it determines that the rates are unjust and unreasonable or unduly discriminatory or preferential. Under certain circumstances, FERC could limit our recovery of costs or could require us to reduce our rates and the payment of reparations to complaining shippers for up to two years prior to the date of the complaint. In particular, FERC’s current income tax allowance policy could affect our rates going forward, although we do not currently expect to experience any impact to financial results as a result of this policy. In addition, our rates going forward could be affected by proposed changes to FERC’s annual indexing methodology, including both changes to the methodology to account for the impact of the tax reduction from the Tax Cuts and Jobs Act of 2017 as well as the potential adoption of a policy that would deny proposed index increases for pipelines under certain circumstances where revenues exceed cost-of-service numbers by a certain percentage or where the proposed index increases exceed certain annual cost changes. All of these FERC policies and potential changes could have a material impact on our business and, if accepted, could decrease our rates and adversely affect our business.
As we acquire, construct, and operate new liquids assets and expand our liquids transportation business, the classification and regulation of our liquids transportation services, including services that our marketing companies provide on our FERC-regulated liquids pipelines, are subject to ongoing assessment and change based on the services we provide and determinations by FERC and the courts. Such changes may subject additional services we provide to regulation by FERC, which could increase our operating costs, decrease our rates, and adversely affect our business.
We may incur significant costs and liabilities resulting from compliance with pipeline safety regulations.
The pipelines we own and operate are subject to stringent and complex regulation related to pipeline safety and integrity management. For instance, the Department of Transportation, through PHMSA, has established a series of rules that require pipeline operators to develop and implement integrity management programs for hazardous liquid (including oil) pipeline segments that, in the event of a leak or rupture, could affect HCAs. In October 2019, PHMSA issued three new final rules. One rule, effective in December 2019, establishes procedures to implement the expanded emergency order enforcement authority set forth in an October 2016 interim final rule. Among other things, this rule allows PHMSA to issue an emergency order without advance notice or opportunity for a hearing. The other two rules, effective in July 2020, impose several new requirements on operators of onshore gas transmission systems and hazardous liquids pipelines. The rule concerning gas transmission extends the requirement to conduct integrity assessments beyond HCAs to pipelines in MCAs. It also includes requirements to reconfirm MAOP, report MAOP exceedances, consider seismicity as a risk factor in integrity management, and use certain safety features on in-line inspection equipment. The rule concerning hazardous liquids extends the required use of leak detection systems beyond HCAs to all regulated non-gathering hazardous liquid pipelines, requires reporting for gravity fed lines and unregulated gathering lines, requires periodic inspection of all lines not in HCAs, calls for inspections of lines after extreme weather events, and adds a requirement to make all lines in or affecting HCAs capable of accommodating in-line inspection tools over the next 20 years. Additional action by PHMSA with respect to pipeline integrity management requirements may occur in the future. At this time, we cannot predict the cost of such requirements, but they could be significant. Moreover, violations of pipeline safety regulations can result in the imposition of significant penalties.
Several states have also passed legislation or promulgated rules to address pipeline safety. Compliance with pipeline integrity laws and other pipeline safety regulations issued by state agencies, such as the TRRC, could result in substantial expenditures for testing, repairs, and replacement. For example, TRRC regulations require periodic testing of all intrastate pipelines meeting certain size and location requirements. Our costs relating to compliance with the required testing under the TRRC regulations were approximately $3.2 million, $2.6 million, and $3.1 million for the years ended December 31, 2021, 2020, and 2019, respectively. If our pipelines fail to meet the safety standards mandated by the TRRC or PHMSA regulations, then we may be required to repair or replace sections of such pipelines or operate the pipelines at a reduced operating pressure, the cost of which actions cannot be estimated at this time.
Due to the possibility of new or amended laws and regulations or reinterpretation of existing laws and regulations, there can be no assurance that future compliance with PHMSA or state requirements will not have a material adverse effect on our results of operations or financial positions. Moreover, because certain of our operations are located around urban or more populated areas, such as the Barnett Shale, we may incur additional expenses from compliance with municipal and other local or state regulations that impose various obligations including, among other things, regulating the locations of our facilities; limiting the noise, odor, or light levels of our facilities; and requiring certain other improvements, including to the appearance of our facilities, that result in increased costs for our facilities. We are also subject to claims by neighboring landowners for nuisance related to the construction and operation of our facilities, which could subject us to damages for declines in neighboring property values due to our construction and operation activities.
Failure to comply with existing or new environmental laws or regulations or an accidental release of hazardous substances, hydrocarbons, or wastes into the environment may cause us to incur significant costs and liabilities.
Many of the operations and activities of our pipelines, gathering systems, processing plants, fractionators, brine disposal operations, and other facilities are subject to significant federal, state, and local environmental laws and regulations, the violation of which can result in administrative, civil, and criminal penalties, including civil fines, injunctions, or both. The obligations imposed by these laws and regulations include obligations related to air emissions and discharge of pollutants from our pipelines and other facilities and the cleanup of hazardous substances and other wastes that are or may have been released at properties currently or previously owned or operated by us or locations to which we have sent wastes for treatment or disposal. These laws impose strict, joint and several liability for the remediation of contaminated areas. Private parties, including the owners of properties near our facilities or upon or through which our gathering systems traverse, may also have the right to pursue legal actions to enforce compliance and to seek damages for non-compliance with environmental laws for releases of contaminants or for personal injury or property damage.
Our business may be adversely affected by increased costs due to stricter pollution control requirements or liabilities resulting from non-compliance with required operating or other regulatory permits. New environmental laws or regulations, including, for example, legislation relating to the control of greenhouse gas emissions, or changes in existing environmental laws or regulations might adversely affect our products and activities, including processing, storage, and transportation, as well as waste management and air emissions. Federal and state agencies could also impose additional safety requirements, any of which could affect our profitability. Changes in laws or regulations could also limit our production or the operation of our assets or adversely affect our ability to comply with applicable legal requirements or the demand for crude oil, brine disposal services, or natural gas, which could adversely affect our business and our profitability.
Recent rules under the Clean Air Act imposing more stringent requirements on the oil and gas industry could cause our customers and us to incur increased capital expenditures and operating costs as well as reduce the demand for our services.
We are subject to stringent and complex regulation under the federal Clean Air Act, implementing regulations, and state and local equivalents, including regulations related to controls for oil and natural gas production, pipelines, and processing operations. For instance, the EPA finalized new rules, effective August 2, 2016, to regulate emissions of methane and VOCs from new and modified sources in the oil and gas sector. In September 2020, the EPA published two additional final rules, the 2020 Policy Rule and the 2020 Technical Amendments. The 2020 Policy Rule removed sources in the transmission and storage segment from the regulated source category of the 2016 NSPS, rescinded the NSPS (including both VOC and methane requirements) applicable to those sources, and rescinded the methane-specific requirements of the NSPS applicable to sources in the production and processing segments. In June 2020, President Biden signed a joint congressional resolution rescinding the 2020 Policy Rule, and in November 2021, the EPA proposed a new rule targeting methane and VOC emissions from new and existing oil and gas sources, including sources in the production, processing, transmission, and storage segments. The proposed rule would: (1) update NSPS subpart OOOOa; (2) adopt a new NSPS subpart OOOOb for sources that commence construction, modification, or reconstruction after the date the proposed rule is published in the Federal Register; and (3) adopt a new NSPS subpart OOOOc to establish emissions guidelines, which will inform state plans to establish standards for existing sources. The
EPA also finalized a rule regarding the alternative criteria for aggregating multiple small surface sites into a single source for air quality permitting purposes. This rule could cause small facilities, on an aggregate basis, to be deemed a major source if within one quarter-mile of one another, thereby triggering more stringent air permitting processes and requirements across the oil and gas industry.
The BLM also adopted new rules, effective January 17, 2017, to reduce venting, flaring, and leaks during oil and natural gas production activities on onshore federal and Indian leases. Certain provisions of the BLM rule went into effect in January 2017, while others were scheduled to go into effect in January 2018. In December 2017, BLM published a final rule delaying the 2018 provisions until 2019. In September 2018, BLM published a final rule to repeal certain requirements of the 2016 methane rule. The September 2018 rule was challenged in the U.S. District Court for the Northern District of California almost immediately after issuance. In July 2020, the U.S. District Court for the Northern District of California vacated BLM’s 2018 revision rule. Additionally, in October 2020, a Wyoming federal district judge vacated the 2016 venting and flaring rule.
Additional regulation of GHG emissions from the oil and gas industry remains a possibility. These regulations could require a number of modifications to our operations, and our natural gas exploration and production suppliers’ and customers’ operations, including the installation of new equipment, which could result in significant costs, including increased capital expenditures and operating costs. The incurrence of such expenditures and costs by our suppliers and customers could result in reduced production by those suppliers and customers and thus translate into reduced demand for our services. Responding to rule challenges, the EPA has since revised certain aspects of its April 2012 rules and has indicated that it may reconsider other aspects of the rules.
The ESA and MBTA govern our operations and additional restrictions may be imposed in the future, which could have an adverse impact on our operations.
The ESA and analogous state laws restrict activities that may affect endangered or threatened species or their habitats. Similar protections are offered to migratory birds under the MBTA. The U.S. Fish and Wildlife Service and state agencies may designate critical or suitable habitat areas that they believe are necessary for the survival of threatened or endangered species, which could materially restrict use of or access to federal, state, and private lands. Some of our operations may be located in areas that are designated as habitats for endangered or threatened species or that may attract migratory birds. In these areas, we may be obligated to develop and implement plans to avoid potential adverse impacts to protected species, and we may be prohibited from conducting operations in certain locations or during certain seasons, such as breeding and nesting seasons, when our operations could have an adverse effect on the species. It is also possible that a federal or state agency could order a complete halt to our activities in certain locations if it is determined that such activities may have a serious adverse effect on a protected species. In addition, the U.S. Fish and Wildlife Service and state agencies regularly review species that are listing candidates, and designations of additional endangered or threatened species, or critical or suitable habitat, under the ESA could cause us to incur additional costs or become subject to operating restrictions or bans in the affected areas.
Our business is subject to complex and evolving U.S. laws and regulations regarding privacy and data protection (“data protection laws”). Many of these laws and regulations are subject to change and uncertain interpretation, and could result in claims, increased cost of operations, or otherwise harm our business.
The regulatory environment surrounding data privacy and protection is constantly evolving and can be subject to significant change. New data protection laws pose increasingly complex compliance challenges and potentially elevate our costs. Complying with varying jurisdictional requirements could increase the costs and complexity of compliance, and violations of applicable data protection laws can result in significant penalties. Any failure, or perceived failure, by us to comply with applicable data protection laws could result in proceedings or actions against us by governmental entities or others, subject us to significant fines, penalties, judgments, and negative publicity, require us to change our business practices, increase the costs and complexity of compliance, and adversely affect our business. As noted above, we are also subject to the possibility of cyberattacks, which themselves may result in a violation of these laws. Additionally, if we acquire a company that has violated or is not in compliance with applicable data protection laws, we may incur significant liabilities and penalties as a result.
Item 1B. Unresolved Staff Comments
We do not have any unresolved staff comments.
Item 2. Properties
A description of our properties is contained in “Item 1. Business.”
Title to Properties
Substantially all of our pipelines are constructed on rights-of-way granted by the apparent record owners of the property. Lands over which pipeline rights-of-way have been obtained may be subject to prior liens that have not been subordinated to the right-of-way grants. We have obtained, where necessary, easement agreements from public authorities and railroad companies to cross over or under, or to lay facilities in or along, watercourses, county roads, municipal streets, railroad properties, and state highways, as applicable. In some cases, property on which our pipeline was built was purchased in fee. Our processing plants are located on land that we lease or own in fee.
We believe that we have satisfactory title to all of our rights-of-way and land assets. Title to these assets may be subject to encumbrances or defects. We believe that none of such encumbrances or defects should materially detract from the value of our assets or from our interest in these assets or should materially interfere with their use in the operation of the business.
Item 3. Legal Proceedings
Our operations are subject to a variety of risks and disputes normally incident to our business. As a result, at any given time we may be a defendant in various legal proceedings and litigation arising in the ordinary course of business, including litigation on disputes related to contracts, property rights, property use or damage, and personal injury. We may continue to see claims brought by landowners, such as nuisance claims and other claims based on property rights. We may also be involved in lawsuits with landowners in which a court determines the value to be paid for a pipeline easement or other property right as a result of our exercise of eminent domain or common carrier rights. Except as otherwise set forth herein, we do not believe that any pending or threatened claim or dispute is material to our financial condition, results of operations, or cash flows. We maintain insurance policies with insurers in amounts and with coverage and deductibles that our Managing Member believes are reasonable and prudent. However, we cannot assure you that this insurance will be adequate to protect us from all material expenses related to potential future claims for personal and property damage or that these levels of insurance will be available in the future at economical prices.
See “Item 8. Financial Statements and Supplementary Data—Note 14” for more information on litigation proceedings and contingencies.
We (or our subsidiaries) are defending lawsuits filed by owners of property located near processing facilities or compression facilities that we own or operate as part of our systems. The suits generally allege that the facilities create a private nuisance and have damaged the value of surrounding property. Claims of this nature have arisen as a result of the industrial development of natural gas gathering, processing, and treating facilities in urban and occupied rural areas.
Item 4. Mine Safety Disclosures
Not applicable.
PART II
Item 5. Market for Registrant’s Common Equity, Related Unitholder Matters, and Issuer Purchases of Equity Securities
Our common units are listed on the NYSE under the symbol “ENLC.” On January 31, 2022, there were approximately 30,873 record holders and beneficial owners (held in street name) of ENLC common units. For equity compensation plan information, see the discussion under “Item 12. Security Ownership of Certain Beneficial Owners and Management and Related Unitholder Matters—Equity Compensation Plan Information.”
Unless restricted by the terms of the Consolidated Credit Facility, we intend to pay distributions to our unitholders on a quarterly basis from our available cash less reserves for expenses, future distributions, and other uses of cash, including:
•provisions for the proper conduct of our business;
•paying federal income taxes, which we are required to pay because we are taxed as a corporation; and
•maintaining cash reserves the board of directors of the Managing Member believes are prudent to maintain.
Purchases of Equity Securities
During the three months ended December 31, 2021, we re-acquired ENLC common units from certain employees in order to satisfy the employees’ tax liability in connection with the vesting of restricted incentive units, and we repurchased common units in open market transactions in connection with a common unit repurchase program.
| | | | | | | | | | | | | | | | | | | | | | | | | | |
| Period | | Total Number of Units Purchased (1) | | Average Price Paid Per Unit | | Total Number of Units Purchased as Part of Publicly Announced Plans or Programs (2) | | Maximum Dollar Value of Units that May Yet Be Purchased under the Plans or Programs (in millions) (2) |
| October 1, 2021 to October 31, 2021 | | 1,919 | | | $ | 6.82 | | | — | | | $ | 84.3 | |
| November 1, 2021 to November 30, 2021 | | 1,679,243 | | | $ | 7.24 | | | 1,679,243 | | | $ | 72.2 | |
| December 1, 2021 to December 31, 2021 | | 2,028,069 | | | $ | 6.69 | | | 2,017,462 | | | $ | 58.7 | |
| Total | | 3,709,231 | | | $ | 6.94 | | | 3,696,705 | | | |
____________________________
(1)The total number of units purchased shown in the table includes 12,526 units received by us from employees for the payment of personal income tax withholding on vesting transactions.
(2)On November 4, 2020, we announced a $100.0 million common unit repurchase program. As of December 31, 2021, we had repurchased a total of 6.5 million common units for an aggregate cost of $41.3 million, or an average of $6.38 per common unit under such program. In December 2021, we announced that our Board had reauthorized our common unit repurchase program and reset the amount available for repurchase of outstanding common units at up to $100.0 million effective January 1, 2022. Future repurchases under the program may be made from time to time in open market or private transactions and may be made pursuant to a trading plan meeting the requirements of Rule 10b5-1 under the Securities Exchange Act of 1934, as amended. The repurchases will depend on market conditions and may be discontinued at any time. On February 15, 2022, we and GIP entered into an agreement pursuant to which we will repurchase, on a quarterly basis, a pro rata portion of the ENLC common units held by GIP, based upon the number of common units purchased by us during the applicable quarter from public unitholders under our common unit repurchase program. The number of ENLC common units held by GIP that we repurchase in any quarter will be calculated such that GIP’s then-existing economic ownership percentage of our outstanding common units is maintained after our repurchases of common units from public unitholders are taken into account, and the per unit price we pay to GIP will be the average per unit price paid by us for the common units repurchased from public unitholders. For more information about our repurchase agreement with GIP, see Item 9B of this Report.
Item 6. [Reserved]
Item 7. Management’s Discussion and Analysis of Financial Condition and Results of Operations
Please read the following discussion of our financial condition and results of operations in conjunction with the financial statements and notes thereto included elsewhere in this report. In addition, please refer to the Definitions page set forth in this report prior to Item 1—Business. Certain items related to the year ended December 31, 2020 and 2019 and year-to-year comparisons of the year ended December 31, 2020 and the year ended December 31, 2019 have been recast to conform to current period presentation, and therefore are shown below. Items that remain unchanged from the discussion in our prior year’s Annual Report on Form 10-K can be found in “Management’s Discussion and Analysis of Financial Condition and Results of Operations” in Part II, Item 7 of ENLC’s Annual Report on Form 10-K for the year ended December 31, 2020.
In this report, the terms “Company” or “Registrant,” as well as the terms “ENLC,” “our,” “we,” “us,” or like terms, are sometimes used as abbreviated references to EnLink Midstream, LLC itself or EnLink Midstream, LLC together with its consolidated subsidiaries, including ENLK and its consolidated subsidiaries. References in this report to “EnLink Midstream Partners, LP,” the “Partnership,” “ENLK,” or like terms refer to EnLink Midstream Partners, LP itself or EnLink Midstream Partners, LP together with its consolidated subsidiaries, including the Operating Partnership.
Overview
ENLC is a Delaware limited liability company formed in October 2013. ENLC’s assets consist of all of the outstanding common units of ENLK and all of the membership interests of the General Partner. All of our midstream energy assets are owned and operated by ENLK and its subsidiaries. We primarily focus on providing midstream energy services, including:
•gathering, compressing, treating, processing, transporting, storing, and selling natural gas;
•fractionating, transporting, storing, and selling NGLs; and
•gathering, transporting, stabilizing, storing, trans-loading, and selling crude oil and condensate, in addition to brine disposal services.
Our midstream energy asset network includes approximately 12,100 miles of pipelines, 22 natural gas processing plants with approximately 5.5 Bcf/d of processing capacity, seven fractionators with approximately 320,000 Bbls/d of fractionation capacity, barge and rail terminals, product storage facilities, purchasing and marketing capabilities, brine disposal wells, a crude oil trucking fleet, and equity investments in certain joint ventures. We manage and report our activities primarily according to the nature of activity and geography.
Starting in the first quarter of 2021, we began evaluating the financial performance of our segments by including realized and unrealized gains and losses resulting from commodity swaps activity in the Permian, Louisiana, Oklahoma, and North Texas segments. Commodity swaps activity was previously reported in the Corporate segment. We have recast segment information for all presented periods prior to the first quarter of 2021 to conform to current period presentation. Identification of the majority of our operating segments is based principally upon geographic regions served:
•Permian Segment. The Permian segment includes our natural gas gathering, processing, and transmission activities and our crude oil operations in the Midland and Delaware Basins in West Texas and Eastern New Mexico;
•Louisiana Segment. The Louisiana segment includes our natural gas and NGL pipelines, natural gas processing plants, natural gas and NGL storage facilities, and fractionation facilities located in Louisiana and our crude oil operations in ORV;
•Oklahoma Segment. The Oklahoma segment includes our natural gas gathering, processing, and transmission activities, and our crude oil operations in the Cana-Woodford, Arkoma-Woodford, northern Oklahoma Woodford, STACK, and CNOW shale areas;
•North Texas Segment. The North Texas segment includes our natural gas gathering, processing, and transmission activities in North Texas; and
•Corporate Segment. The Corporate segment includes our unconsolidated affiliate investments in the Cedar Cove JV in Oklahoma, our ownership interest in GCF in South Texas, and our general corporate assets and expenses.
We manage our consolidated operations by focusing on adjusted gross margin because our business is generally to gather, process, transport, or market natural gas, NGLs, crude oil, and condensate using our assets for a fee. We earn our fees through various fee-based contractual arrangements, which include stated fee-only contract arrangements or arrangements with fee-based components where we purchase and resell commodities in connection with providing the related service and earn a net margin as our fee. We earn our net margin under our purchase and resell contract arrangements primarily as a result of stated service-related fees that are deducted from the price of the commodity purchase. While our transactions vary in form, the essential element of most of our transactions is the use of our assets to transport a product or provide a processed product to an end-user or marketer at the tailgate of the plant, pipeline, or barge, truck, or rail terminal. Adjusted gross margin is a non-GAAP financial measure and is explained in greater detail under “Non-GAAP Financial Measures” below. Approximately 89% of our adjusted gross margin was derived from fee-based contractual arrangements with minimal direct commodity price exposure for the year ended December 31, 2021.
Our revenues and adjusted gross margins are generated from eight primary sources:
•gathering and transporting natural gas, NGLs, and crude oil on the pipeline systems we own;
•processing natural gas at our processing plants;
•fractionating and marketing recovered NGLs;
•providing compression services;
•providing crude oil and condensate transportation and terminal services;
•providing condensate stabilization services;
•providing brine disposal services; and
•providing natural gas, crude oil, and NGL storage.
The following customers individually represented greater than 10% of our consolidated revenues during 2021, 2020, or 2019. These customers represented a significant percentage of our consolidated revenues, and the loss of these customers would have a material adverse impact on our results of operations because the revenues and adjusted gross margin received from transactions with these customers is material to us. No other customers represented greater than 10% of our consolidated revenues during the periods presented.
| | | | | | | | | | | | | | | | | |
| Year Ended December 31, |
| 2021 | | 2020 | | 2019 |
| Devon | 6.7 | % | | 14.4 | % | | 10.5 | % |
| Dow Hydrocarbons and Resources LLC | 14.5 | % | | 13.2 | % | | 10.0 | % |
| Marathon Petroleum Corporation | 13.4 | % | | 12.2 | % | | 13.8 | % |
We gather, transport, or store gas owned by others under fee-only contract arrangements based either on the volume of gas gathered, transported, or stored or, for firm transportation arrangements, a stated monthly fee for a specified monthly quantity with an additional fee based on actual volumes. We also buy natural gas from producers or shippers at a market index less a fee-based deduction subtracted from the purchase price of the natural gas. We then gather or transport the natural gas and sell the natural gas at a market index, thereby earning a margin through the fee-based deduction. We attempt to execute substantially all purchases and sales concurrently, or we enter into a future delivery obligation, thereby establishing the basis for the fee we will receive for each natural gas transaction. We are also party to certain long-term gas sales commitments that we satisfy through supplies purchased under long-term gas purchase agreements. When we enter into those arrangements, our sales obligations generally match our purchase obligations. However, over time, the supplies that we have under contract may decline due to reduced drilling or other causes, and we may be required to satisfy the sales obligations by buying additional gas at prices that may exceed the prices received under the sales commitments. In our purchase/sale transactions, the resale price is generally based on the same index at which the gas was purchased.
We typically buy mixed NGLs from our suppliers to our gas processing plants at a fixed discount to market indices for the component NGLs with a deduction for our fractionation fee. We subsequently sell the fractionated NGL products based on the same index-based prices. To a lesser extent, we transport and fractionate or store NGLs owned by others for a fee based on the volume of NGLs transported and fractionated or stored. The operating results of our NGL fractionation business are largely dependent upon the volume of mixed NGLs fractionated and the level of fractionation fees charged. With our fractionation business, we also have the opportunity for product upgrades for each of the discrete NGL products. We realize higher adjusted gross margins from product upgrades during periods with higher NGL prices.
We gather or transport crude oil and condensate owned by others by rail, truck, pipeline, and barge facilities under fee-only contract arrangements based on volumes gathered or transported. We also buy crude oil and condensate on our own gathering systems, third-party systems, and trucked from producers at a market index less a stated transportation deduction. We then transport and resell the crude oil and condensate through a process of basis and fixed price trades. We execute substantially all purchases and sales concurrently, thereby establishing the net margin we will receive for each crude oil and condensate transaction.
We realize adjusted gross margins from our gathering and processing services primarily through different contractual arrangements: processing margin (“margin”) contracts, POL contracts, POP contracts, fixed-fee based contracts, or a combination of these contractual arrangements. See “Item 7A. Quantitative and Qualitative Disclosures about Market Risk—Commodity Price Risk” for a detailed description of these contractual arrangements. Under any of these gathering and processing arrangements, we may earn a fee for the services performed, or we may buy and resell the gas and/or NGLs as part of the processing arrangement and realize a net margin as our fee. Under margin contract arrangements, our adjusted gross margins are higher during periods of high NGL prices relative to natural gas prices. Adjusted gross margin results under POL contracts are impacted only by the value of the liquids produced with margins higher during periods of higher liquids prices. Adjusted gross margin results under POP contracts are impacted only by the value of the natural gas and liquids produced with margins higher during periods of higher natural gas and liquids prices. Under fixed-fee based contracts, our adjusted gross margins are driven by throughput volume.
Operating expenses are costs directly associated with the operations of a particular asset. Among the most significant of these costs are those associated with direct labor and supervision, property insurance, property taxes, repair and maintenance expenses, contract services, and utilities. These costs are normally fairly stable across broad volume ranges and therefore do not normally increase or decrease significantly in the short term with increases or decreases in the volume of gas, liquids, crude oil, and condensate moved through or by our assets.
CCS Business
We are currently developing an integrated offering to bring CCS services to businesses along the Mississippi River corridor in Louisiana, one of the highest CO2 emitting regions in the United States. We believe our existing asset footprint, including our extensive network of natural gas pipelines in Louisiana, our operating expertise and our customer relationships, provide EnLink an advantage in building a CCS business.
Recent Developments Affecting Industry Conditions and Our Business
Current Market Environment
The midstream energy business environment and our business are affected by the level of production of natural gas and oil in the areas in which we operate and the various factors that affect this production, including commodity prices, capital markets trends, competition, and regulatory changes. We believe these factors will continue to affect production and therefore the demand for midstream services and our business in the future. To the extent these factors vary from our underlying assumptions, our business and actual results could vary materially from market expectations and from the assumptions discussed in this section.
Production levels by our exploration and production customers are driven in large part by the level of oil and natural gas prices. New drilling activity is necessary to maintain or increase production levels as oil and natural gas wells experience production declines over time. New drilling activity generally moves in the same direction as crude oil and natural gas prices as those prices drive investment returns and cash flow available for reinvestment by exploration and production companies. Accordingly, our operations are affected by the level of crude, natural gas, and NGL prices, the relationship among these prices, and related activity levels from our customers.
There has been, and we believe there will continue to be, volatility in commodity prices and in the relationships among NGL, crude oil, and natural gas prices. Although commodity markets have recovered from the reduction in global demand and low market prices experienced in 2020 due to the COVID-19 pandemic, oil and natural gas prices continue to remain volatile. Natural gas prices, in particular, have risen quickly during 2021, and at the date of this report, the market price is at a level higher than it has traded in many years.
Capital markets and the demands of public investors also affect producer behavior, production levels, and our business. Over the last several years, public investors have exerted pressure on oil and natural gas producers to increase capital discipline
and focus on higher investment returns even if it means lower growth. In addition, the ability of companies in the oil and gas industry to access the capital markets on favorable terms has been somewhat negatively impacted. This demand by investors for increased capital discipline from energy companies, as well as the difficulties in accessing capital markets, has led to more modest capital investment by producers, curtailed drilling and production activity, and, accordingly, slower growth for us and other midstream companies during the past few years. This trend was amplified in 2020 by the COVID-19 pandemic, which reduced demand for commodities. Although volumes have now recovered to pre-pandemic levels, global capital investments by oil and natural gas producers remain at relatively low levels compared to historical levels and producers remain cautious, even as crude oil and natural gas prices increased during 2021.
Producers generally focus their drilling activity on certain producing basins depending on commodity price fundamentals and favorable drilling economics. In the last few years, many producers have increasingly focused their activities in the Permian Basin, because of the availability of higher investment returns. Currently, a large percentage of all drilling rigs operating in the United States are operating in the Permian Basin. As a result of this concentration of drilling activity in the Permian Basin, other basins, including those in which we operate in Oklahoma and North Texas, have experienced reduced investment and declines in volumes produced. In contrast, we continue to experience an increase in volumes in our Permian segment as our operations in that basin are in a favorable position relative to producer activity.
Our Louisiana segment, while subject to commodity price trends, is less dependent on gathering and processing activities and more affected by industrial demand for the natural gas and NGLs that we supply. Industrial demand along the Gulf Coast region has remained strong throughout 2021, supported by regional industrial activity and export markets. Our activities and, in turn, our financial performance in the Louisiana segment are highly dependent on the availability of natural gas and NGLs produced by our upstream gathering and processing business and by other market participants. To date, the supply of natural gas and NGLs has remained at levels sufficient for us to supply our customers, and maintaining such supply is a key business focus.
For additional discussion regarding these factors, see “Item 1A—Risk Factors—Business and Industry Risks.”
Extreme Weather Events
From time to time our operations may be affected by extreme weather events. In February 2021, certain areas in which we operate experienced a severe winter storm, with extreme cold, ice, and snow occurring over an unprecedented period of approximately 10 days (“Winter Storm Uri”). Winter Storm Uri adversely affected the Company’s facilities and activities across the Company’s footprint, as it did for producers and other midstream companies located in these areas. The severe cold temperatures caused production freeze-offs and also led some producers to proactively shut-in their wells to preserve well integrity. As a result, the Company’s gathering and processing volumes were significantly reduced during this period, with peak volume declines ranging between 44% and 92%, depending on the region. The Company responded to the challenges presented by the storm by taking active steps to ensure the resiliency of the Company’s assets and the protection of the health and well-being of its employees. The Company’s operations and its gathering and processing volumes returned to normal levels by the end of the first quarter of 2021.
Because of the magnitude and unprecedented nature of Winter Storm Uri, we cannot predict the full impact that the storm may have on our future results of operations. The ultimate impacts will depend on future developments, including, among other factors, the outcome of pending billing disputes or litigation with customers and regulatory actions by state legislatures and other entities responsible for the regulation and pricing of electricity and the electrical grid.
During the third quarter of 2021, we experienced a temporary loss of some processing volumes in our Louisiana operations due to the effects of Hurricane Ida, which forced a temporary shut-down of some of our operations and those of our downstream customers. All of our affected operations and those of our downstream customers have now returned to normal levels.
COVID-19 Update
On March 11, 2020, the World Health Organization declared the ongoing coronavirus (COVID-19) outbreak a pandemic and recommended containment and mitigation measures worldwide.
Since the outbreak began, our first priority has been the health and safety of our employees and those of our customers and other business counterparties. Beginning in March 2020, we implemented preventative measures and developed a response plan to minimize unnecessary risk of exposure and prevent infection, while supporting our customers’ operations, and we continue to follow these plans. We also continue to promote heightened awareness and vigilance, hygiene, and implementation of more
stringent cleaning protocols across our facilities and operations and we continue to evaluate and adjust our preventative measures, response plans and business practices with the evolving impacts of COVID-19 and its variants. Since the inception of the pandemic, we have not experienced any significant COVID-19 related operational disruptions.
There remains considerable uncertainty regarding how long the COVID-19 pandemic (including variants of the virus) will persist and affect economic conditions and the extent and duration of changes in consumer behavior.
We cannot predict the full impact that the COVID-19 pandemic or the related volatility in oil and natural gas markets will have on our business, liquidity, financial condition, results of operations, and cash flows (including our ability to make distributions to unitholders) at this time due to numerous uncertainties. The ultimate impacts will depend on future developments, including, among others, the ultimate duration and persistence of the pandemic, the impact of the Delta and Omicron variants of the virus, the speed at which the population is vaccinated against the virus and the efficacy of the vaccines, the emergence of any new variants of the virus against which vaccines are less effective, the effect of the pandemic on economic, social, and other aspects of everyday life, the consequences of governmental and other measures designed to prevent the spread of the virus, actions taken by members of OPEC+ and other foreign, oil-exporting countries, actions taken by governmental authorities, customers, suppliers, and other third parties, and the timing and extent to which normal economic, social, and operating conditions fully resume. Although crude oil and natural gas prices and production activities have recovered to pre-pandemic levels, producers remain cautious and a decline in commodity prices could affect producers’ exploration and production activities. A sustained significant decline in oil and natural gas exploration and production activities and related reduced demand for our services by our customers, whether due to decreases in consumer demand or reduction in the prices for crude oil, condensate, natural gas, and NGLs or otherwise, would have a material adverse effect on our business, liquidity, financial condition, results of operations, and cash flows (including our ability to make distributions to our unitholders).
For additional discussion regarding risks associated with the COVID-19 pandemic, see “Item 1A—Risk Factors—The ongoing coronavirus (COVID-19) pandemic has adversely affected and could continue to adversely affect our business, financial condition, and results of operations.”
Regulatory Developments
On January 20, 2021, the Biden Administration came into office and immediately issued a number of executive orders related to climate change and the production of oil and gas that could affect our operations and those of our customers. On his first day in office, President Biden signed an instrument reentering the United States into the Paris Agreement, effective February 19, 2021, and issued an executive order on “Protecting Public Health and the Environment and Restoring Science to Tackle the Climate Crisis” seeking to adopt new regulations and policies to address climate change and suspend, revise, or rescind prior agency actions that are identified as conflicting with the Biden Administration’s climate policies. In addition, on January 27, 2021, President Biden issued an executive order indefinitely suspending new oil and natural gas leases on public lands or in offshore waters pending completion of an ongoing comprehensive review and reconsideration of federal oil and gas permitting and leasing practices. On June 15, 2021, however, a judge in the U.S. District Court for the Western District of Louisiana issued a nationwide temporary injunction blocking the suspension. The Department of the Interior appealed the U.S. District Court’s ruling but resumed oil and gas leasing pending resolution of the appeal. In November 2021, the Department of the Interior completed its review and issued a report on the federal oil and gas leasing program. The Department of the Interior’s report recommends several changes to federal leasing practices, including changes to royalty payments, bidding, and bonding requirements. Furthermore, on April 22, 2021, at a global summit on climate change, President Biden committed the United States to target emissions reductions of 50-52% of 2005 levels by 2030. Lastly, on June 30, 2021, President Biden signed into law a reinstatement of regulations put in place during the Obama administration regarding methane emissions. The Company had previously complied with these regulations during the Obama administration and does not expect the reinstatement to have a material effect on the Company or its operations. The Biden Administration could also seek, in the future, to put into place additional executive orders, policy and regulatory reviews, or seek to have Congress pass legislation that could adversely affect the production of oil and natural gas, and our operations and those of our customers.
Only a small percentage of our operations are derived from customers operating on public land, mainly in the Delaware Basin. Our operations in the Delaware Basin are expected to represent only approximately 6% of our total segment profit, net to EnLink, during 2022. In addition, we have a robust program to monitor and prevent methane emissions in our operations and we maintain a comprehensive environmental program that is embedded in our operations. However, our activities that take place on public lands require that we and our producer customers obtain leases, permits, and other approvals from the federal government. While the status of recent and future rules and rulemaking initiatives under the Biden Administration remain uncertain, the regulations that might result from such initiatives, could lead to increased costs for us or our customers, difficulties in obtaining leases, permits, and other approvals for us and our customers, reduced utilization of our gathering, processing and pipeline systems or reduced rates under renegotiated transportation or storage agreements in affected regions. These impacts could, in turn, adversely affect our business, financial condition, results of operations, or cash flows, including our ability to make cash distributions to our unitholders.
For more information, see our risk factors under “Environmental, Legal Compliance and Regulatory Risk” in Section 1A “Risk Factors.”
Other Recent Developments
CCS—Talos Alliance. In February 2022, we signed a memorandum of understanding with Talos Energy Inc. (“Talos”) to provide a complete CCS offering for industrial-scale emitters in Louisiana, utilizing our midstream assets combined with Talos’ subsurface assets. Talos has secured approximately 26,000 acres in Louisiana, providing sequestration capacity of over 500 million metric tonnes.
Bridgeport CO2 Project. In November 2021, we entered into an agreement with Continental Carbonic Products, Inc., a wholly owned subsidiary of Matheson Tri-Gas, Inc., and member of the Nippon Sanso Holdings Corporation group of companies, to capture and sell CO2 emitted from our Bridgeport processing plant in North Texas. The CO2 will be sold on a firm basis for 15 years and will be converted into food-grade products. This project is expected to be in service in early 2024. The project makes meaningful progress toward our goal of a 30% reduction in total CO2-equivalent emissions intensity by 2030, while being modestly profitable.
Amarillo Rattler Acquisition. On April 30, 2021, we completed the acquisition of Amarillo Rattler, LLC, the owner of a gathering and processing system located in the Midland Basin. In connection with the purchase, we entered into an amended and restated gas gathering and processing agreement with Diamondback Energy, strengthening our dedicated acreage position with that entity. We acquired the system with an upfront payment of $50.0 million, which was paid with cash-on-hand, with an additional $10.0 million to be paid on April 30, 2022, and contingent consideration capped at $15.0 million and payable between 2024 and 2026 based on Diamondback Energy’s drilling activity above historical levels.
Organic Growth
Phantom Processing Plant. In November 2021, we began moving equipment and facilities associated with the Thunderbird processing plant in Central Oklahoma to the Midland Basin. This processing plant relocation is expected to increase the processing capacity of our Permian Basin processing facilities by approximately 200 MMcf/d. We expect to complete the relocation in the second half of 2022.
War Horse Processing Plant. In December 2020, we began moving equipment and facilities previously associated with the Battle Ridge processing plant in Central Oklahoma to the Permian Basin. The move has been completed and the War Horse processing plant began operations in August 2021. In November 2021, we completed an expansion to the War Horse processing plant, which increased the processing capacity to 95 MMcf/d.
Riptide Processing Plant. The Riptide processing plant is a gas processing plant located in the Midland Basin. In March 2020, we completed an expansion to the Riptide processing plant, which increased the processing capacity to 240 MMcf/d.
Tiger processing plant. The Tiger processing plant is a gas processing plant located in the Delaware Basin. This processing plant is owned by the Delaware Basin JV. In August 2020, we completed the construction of the Tiger processing plant, which expanded our Delaware Basin processing capacity by an additional 240 MMcf/d, to handle expected future processing volume growth.
Long-Term Debt Issuances, Repurchases, and Repayments
Term Loan. In December 2020, May 2021, and September 2021, we repaid $500.0 million, $100.0 million, and $100.0 million, respectively, of the borrowings under the Term Loan. The remaining $150.0 million of the Term Loan was repaid at maturity on December 10, 2021.
AR Facility. On October 21, 2020, EnLink Midstream Funding, LLC, a bankruptcy-remote special purpose entity that is an indirect subsidiary of ENLC (the “SPV”) entered into the AR Facility to borrow up to $250.0 million. In connection with the AR Facility, certain subsidiaries of ENLC sold and contributed, and will continue to sell or contribute, their accounts receivable to the SPV to be held as collateral for borrowings under the AR Facility. The SPV’s assets are not available to satisfy the obligations of ENLC or any of its affiliates.
On February 26, 2021, the SPV entered into the first amendment to the AR Facility that, among other things: (i) increased the AR Facility limit and lender commitments by $50.0 million to $300.0 million, (ii) reduced the Adjusted LIBOR and LMIR
(each as defined in the AR Facility) minimum floor to zero, rather than the previous 0.375%, and (iii) reduced the effective drawn fee to 1.25% rather than the previous 1.625%.
On September 24, 2021, the SPV entered into the second amendment to the AR Facility that, among other things: (i) increased the AR Facility limit and lender commitments by $50.0 million to $350.0 million, (ii) extended the scheduled termination date of the facility from October 20, 2023 to September 24, 2024, and (iii) reduced the effective drawn fee to 1.10% rather than the previous 1.25%.
Senior Unsecured Notes. On December 14, 2020, ENLC issued $500.0 million in aggregate principal amount of ENLC’s 5.625% senior unsecured notes due January 15, 2028 (the “2028 Notes”) at a price to the public of 100% of their face value. Interest payments on the 2028 Notes are payable on January 15 and July 15 of each year. The 2028 Notes are fully and unconditionally guaranteed by ENLK. Net proceeds of approximately $494.7 million were used to repay a portion of the borrowings under the Term Loan, which matured in December 2021.
For the year ended December 31, 2020, we and ENLK made aggregate payments to partially repurchase the 2024, 2025, 2026, and 2029 Notes in open market transactions. For the year ended December 31, 2021, we and ENLK did not repurchase any senior notes. Activity related to the 2020 partial repurchases of our outstanding debt consisted of the following (in millions):
| | | | | |
| Year Ended December 31, 2020 |
| Debt repurchased | $ | 67.7 | |
| Aggregate payments | (36.0) | |
| Net discount on repurchased debt | (0.3) | |
| Accrued interest on repurchased debt | 0.6 | |
| Gain on extinguishment of debt | $ | 32.0 | |
See “Item 8. Financial Statements and Supplementary Data—Note 6” for more information regarding the Term Loan, the AR Facility, and the senior unsecured notes.
Common Unit Repurchase Program
In November 2020, the board of directors of the Managing Member authorized a common unit repurchase program for the repurchase of up to $100.0 million of outstanding ENLC common units and reauthorized such program in April 2021. The Board reauthorized ENLC’s common unit repurchase program and reset the amount available for repurchases of outstanding common units at up to $100.0 million effective January 1, 2022.
For the year ended December 31, 2021, ENLC repurchased 6,091,001 outstanding ENLC common units for an aggregate cost, including commissions, of $40.1 million, or an average of $6.59 per common unit. For the year ended December 31, 2020, ENLC repurchased 383,614 outstanding ENLC common units for an aggregate cost, including commissions, of $1.2 million, or an average of $3.02 per common unit.
Redemption of Series B Preferred Units
In December 2021, we redeemed 3,300,330 Series B Preferred Units for total consideration of $50.0 million plus accrued distributions. In addition, upon such redemption, a corresponding number of ENLC Class C Common Units were automatically cancelled. In January 2022, we redeemed an additional 3,333,334 Series B Preferred Units for total consideration of $50.5 million plus accrued distributions and, upon such redemption, a corresponding number of ENLC Class C Common Units were automatically cancelled. The redemption price for both the December 2021 and January 2022 redemptions was 101% of the preferred units’ par value. In connection with these Series B Preferred Unit redemptions, we have agreed with the holders of the Series B Preferred Units that we will pay cash in lieu of making a quarterly PIK distribution through the distribution declared for the fourth quarter of 2022. See “Item 8. Financial Statements and Supplementary Data—Note 8” for more information regarding distributions with respect to the Series B Preferred Units.
Non-GAAP Financial Measures
To assist management in assessing our business, we use the following non-GAAP financial measures: adjusted gross margin; adjusted earnings before interest, taxes, and depreciation and amortization (“adjusted EBITDA”); and free cash flow after distributions.
Adjusted Gross Margin
We define adjusted gross margin as revenues less cost of sales, exclusive of operating expenses and depreciation and amortization. We present adjusted gross margin by segment in “Results of Operations.” We disclose adjusted gross margin in addition to gross margin as defined by GAAP because it is the primary performance measure used by our management to evaluate consolidated operations. We believe adjusted gross margin is an important measure because, in general, our business is to gather, process, transport, or market natural gas, NGLs, condensate, and crude oil for a fee or to purchase and resell natural gas, NGLs, condensate, and crude oil for a margin. Operating expense is a separate measure used by our management to evaluate the operating performance of field operations. Direct labor and supervision, property insurance, property taxes, repair and maintenance, utilities, and contract services comprise the most significant portion of our operating expenses. We exclude all operating expenses and depreciation and amortization from adjusted gross margin because these expenses are largely independent of the volumes we transport or process and fluctuate depending on the activities performed during a specific period. The GAAP measure most directly comparable to adjusted gross margin is gross margin. Adjusted gross margin should not be considered an alternative to, or more meaningful than, gross margin as determined in accordance with GAAP. Adjusted gross margin has important limitations because it excludes all operating expenses and depreciation and amortization that affect gross margin. Our adjusted gross margin may not be comparable to similarly titled measures of other companies because other entities may not calculate these amounts in the same manner.
The following table reconciles total revenues and gross margin to adjusted gross margin (in millions):
| | | | | | | | | | | |
| Year Ended December 31, |
| 2021 | | 2020 |
| Total revenues | $ | 6,685.9 | | | $ | 3,893.8 | |
| Cost of sales, exclusive of operating expenses and depreciation and amortization | (5,189.9) | | | (2,388.5) | |
| Operating expenses | (362.9) | | | (373.8) | |
| Depreciation and amortization | (607.5) | | | (638.6) | |
| Gross margin | 525.6 | | | 492.9 | |
| Operating expenses | 362.9 | | | 373.8 | |
| Depreciation and amortization | 607.5 | | | 638.6 | |
| Adjusted gross margin | $ | 1,496.0 | | | $ | 1,505.3 | |
Adjusted EBITDA
We define adjusted EBITDA as net income (loss) plus (less) interest expense, net of interest income; depreciation and amortization; impairments; (income) loss from unconsolidated affiliate investments; distributions from unconsolidated affiliate investments; (gain) loss on disposition of assets; (gain) loss on extinguishment of debt; unit-based compensation; income tax expense (benefit); unrealized (gain) loss on commodity swaps; costs associated with the relocation of processing facilities; accretion expense associated with asset retirement obligations; transaction costs; (non-cash rent); and (non-controlling interest share of adjusted EBITDA from joint ventures). Adjusted EBITDA is one of the primary metrics used in our short-term incentive program for compensating employees. In addition, adjusted EBITDA is used as a supplemental liquidity and performance measure by our management and by external users of our financial statements, such as investors, commercial banks, research analysts, and others, to assess:
•the financial performance of our assets without regard to financing methods, capital structure, or historical cost basis;
•the ability of our assets to generate cash sufficient to pay interest costs, support our indebtedness, and make cash distributions to our unitholders;
•our operating performance and return on capital as compared to those of other companies in the midstream energy sector, without regard to financing methods or capital structure; and
•the viability of acquisitions and capital expenditure projects and the overall rates of return on alternative investment opportunities.
The GAAP measures most directly comparable to adjusted EBITDA are net income (loss) and net cash provided by operating activities. Adjusted EBITDA should not be considered an alternative to, or more meaningful than, net income (loss), operating income (loss), net cash provided by operating activities, or any other measure of financial performance presented in accordance with GAAP. Adjusted EBITDA may not be comparable to similarly titled measures of other companies because other companies may not calculate adjusted EBITDA in the same manner.
Adjusted EBITDA does not include interest expense, net of interest income; income tax expense (benefit); and depreciation and amortization. Because we have borrowed money to finance our operations, interest expense is a necessary element of our costs and our ability to generate cash available for distribution. Because we have capital assets, depreciation and amortization are also necessary elements of our costs. Therefore, any measures that exclude these elements have material limitations. To compensate for these limitations, we believe that it is important to consider net income (loss) and net cash provided by operating activities as determined under GAAP, as well as adjusted EBITDA, to evaluate our overall performance.
The following table reconciles net income (loss) to adjusted EBITDA (in millions):
| | | | | | | | | | | |
| Year Ended December 31, |
| 2021 | | 2020 |
| Net income (loss) | $ | 142.9 | | | $ | (315.6) | |
| Interest expense, net of interest income | 238.7 | | | 223.3 | |
| Depreciation and amortization | 607.5 | | | 638.6 | |
| Impairments | 0.8 | | | 362.8 | |
| (Income) loss from unconsolidated affiliate investments | 11.5 | | | (0.6) | |
| Distributions from unconsolidated affiliate investments | 3.9 | | | 2.1 | |
| (Gain) loss on disposition of assets | (1.5) | | | 8.8 | |
| Gain on extinguishment of debt | — | | | (32.0) | |
| Unit-based compensation | 25.3 | | | 28.4 | |
| Income tax expense | 25.4 | | | 143.2 | |
| Unrealized loss on commodity swaps | 12.4 | | | 10.5 | |
| Costs associated with the relocation of processing facilities (1) | 28.3 | | | 0.8 | |
| Other (2) | (0.6) | | | (1.1) | |
| Adjusted EBITDA before non-controlling interest | 1,094.6 | | | 1,069.2 | |
| Non-controlling interest share of adjusted EBITDA from joint ventures (3) | (44.9) | | | (30.7) | |
| Adjusted EBITDA, net to ENLC | $ | 1,049.7 | | | $ | 1,038.5 | |
____________________________
(1)Represents cost incurred related to the relocation of equipment and facilities from the Thunderbird processing plant and Battle Ridge processing plant, in the Oklahoma segment, to the Permian segment that are not part of our ongoing operations. The relocation of equipment and facilities from the Battle Ridge processing plant was completed in the third quarter of 2021 and we expect to complete the relocation of equipment and facilities from the Thunderbird processing plant in 2022.
(2)Includes accretion expense associated with asset retirement obligations; transaction costs; and non-cash rent, which relates to lease incentives pro-rated over the lease term.
(3)Non-controlling interest share of adjusted EBITDA from joint ventures includes NGP’s 49.9% share of adjusted EBITDA from the Delaware Basin JV, Marathon Petroleum Corporation’s 50% share of adjusted EBITDA from the Ascension JV, and other minor non-controlling interests.
Free Cash Flow After Distributions
We define free cash flow after distributions as adjusted EBITDA, net to ENLC, plus (less) (growth and maintenance capital expenditures, excluding capital expenditures that were contributed by other entities and relate to the non-controlling interest share of our consolidated entities); (interest expense, net of interest income); (distributions declared on common units); (accrued cash distributions on Series B Preferred Units and Series C Preferred Units paid or expected to be paid); (costs associated with the relocation of processing facilities); non-cash interest (income)/expense; (payments to terminate interest rate swaps); (current income taxes); and proceeds from the sale of equipment and land.
Free cash flow after distributions is the principal cash flow metric used by the Company. Free cash flow after distributions is one of the metrics used in our short-term incentive program for compensating employees. It is also used as a supplemental liquidity measure by our management and by external users of our financial statements, such as investors, commercial banks, research analysts, and others, to assess the ability of our assets to generate cash sufficient to pay interest costs, pay back our indebtedness, make cash distributions, and make capital expenditures.
Growth capital expenditures generally include capital expenditures made for acquisitions or capital improvements that we expect will increase our asset base, operating income, or operating capacity over the long-term. Examples of growth capital expenditures include the acquisition of assets and the construction or development of additional pipeline, storage, well connections, gathering, or processing assets, in each case, to the extent such capital expenditures are expected to expand our asset base, operating capacity, or our operating income.
Maintenance capital expenditures include capital expenditures made to replace partially or fully depreciated assets in order to maintain the existing operating capacity of the assets and to extend their useful lives. Examples of maintenance capital expenditures are expenditures to refurbish and replace pipelines, gathering assets, well connections, compression assets, and processing assets up to their original operating capacity, to maintain pipeline and equipment reliability, integrity, and safety, and to address environmental laws and regulations.
The GAAP measure most directly comparable to free cash flow after distributions is net cash provided by operating activities. Free cash flow after distributions should not be considered an alternative to, or more meaningful than, net income (loss), operating income (loss), net cash provided by operating activities, or any other measure of liquidity presented in accordance with GAAP. Free cash flow after distributions has important limitations because it excludes some items that affect net income (loss), operating income (loss), and net cash provided by operating activities. Free cash flow after distributions may not be comparable to similarly titled measures of other companies because other companies may not calculate this non-GAAP metric in the same manner. To compensate for these limitations, we believe that it is important to consider net cash provided by operating activities determined under GAAP, as well as free cash flow after distributions, to evaluate our overall liquidity.
The following table reconciles net cash provided by operating activities to adjusted EBITDA and free cash flow after distributions (in millions):
| | | | | | | | | | | |
| Year Ended December 31, |
| 2021 | | 2020 |
| Net cash provided by operating activities | $ | 857.3 | | | $ | 731.1 | |
| Interest expense (1) | 221.0 | | | 218.2 | |
| Utility credits, net of usage (2) | 32.6 | | | — | |
| Payments to terminate interest rate swaps (3) | 1.8 | | | 10.9 | |
| Accruals for settled commodity swap transactions | 2.1 | | | (4.3) | |
| Distributions from unconsolidated affiliate investment in excess of earnings | 3.9 | | | 0.5 | |
| Costs associated with the relocation of processing facilities (4) | 28.3 | | | 0.8 | |
| Other (5) | 2.4 | | | 0.8 | |
| Changes in operating assets and liabilities which (provided) used cash: | | | |
| Accounts receivable, accrued revenues, inventories, and other | 273.5 | | | 6.4 | |
| Accounts payable, accrued product purchases, and other accrued liabilities | (328.3) | | | 104.8 | |
| Adjusted EBITDA before non-controlling interest | 1,094.6 | | | 1,069.2 | |
| Non-controlling interest share of adjusted EBITDA from joint ventures (6) | (44.9) | | | (30.7) | |
| Adjusted EBITDA, net to ENLC | 1,049.7 | | | 1,038.5 | |
| Interest expense, net of interest income | (238.7) | | | (223.3) | |
| Growth capital expenditures, net to ENLC (7) | (165.3) | | | (187.2) | |
| Maintenance capital expenditures, net to ENLC (7) | (26.1) | | | (32.1) | |
| Distributions declared on common units | (195.2) | | | (186.0) | |
| ENLK preferred unit accrued cash distributions (8) | (94.3) | | | (91.4) | |
| Costs associated with the relocation of processing facilities (4) | (28.3) | | | (0.8) | |
| Non-cash interest expense | 9.5 | | | 0.2 | |
| Payments to terminate interest rate swaps (3) | (1.8) | | | (10.9) | |
| Other (9) | 4.1 | | | 3.5 | |
| Free cash flow after distributions | $ | 313.6 | | | $ | 310.5 | |
____________________________
(1)Net of amortization of debt issuance costs, net discount of senior unsecured notes, and designated cash flow hedge, which are included in interest expense but not included in net cash provided by operating activities, and non-cash interest income, which is netted against interest expense but not included in adjusted EBITDA.
(2)Under our utility agreements, we are entitled to a base load of electricity and pay or receive credits, based on market pricing, when we exceed or do not use the base load amounts. Due to Winter Storm Uri, we received credits from our utility providers based on market rates for our unused electricity. These utility credits are recorded as “Other current assets” or “Other assets, net” on our consolidated balance sheets depending on the timing of their expected usage, and amortized as we incur utility expenses.
(3)Represents cash paid for the early terminations of our interest rate swaps due to the partial repayments of the Term Loan in May and September 2021 and December 2020. See “Item 8. Financial Statements and Supplementary Data—Note 12” for information on the partial terminations of our interest rate swaps.
(4)Represents cost incurred related to the relocation of equipment and facilities from the Thunderbird processing plant and Battle Ridge processing plant, in the Oklahoma segment, to the Permian segment that are not part of our ongoing operations. The relocation of equipment and facilities from the Battle Ridge processing plant was completed in the third quarter of 2021 and we expect to complete the relocation of equipment and facilities from the Thunderbird processing plant in 2022.
(5)Includes current income tax expense; transaction costs; and non-cash rent, which relates to lease incentives pro-rated over the lease term.
(6)Non-controlling interest share of adjusted EBITDA from joint ventures includes NGP’s 49.9% share of adjusted EBITDA from the Delaware Basin JV, Marathon Petroleum Corporation’s 50% share of adjusted EBITDA from the Ascension JV, and other minor non-controlling interests.
(7)Excludes capital expenditures that were contributed by other entities and relate to the non-controlling interest share of our consolidated entities.
(8)Represents the cash distributions earned by the Series B Preferred Units and Series C Preferred Units. See “Item 8. Financial Statements and Supplementary Data—Note 8” for information on the cash distributions earned by holders of the Series B Preferred Units and Series C Preferred Units. Cash distributions to be paid to holders of the Series B Preferred Units and Series C Preferred Units are not available to common unitholders.
(9)Includes current income tax expense and proceeds from the sale of surplus or unused equipment and land, which occurred in the normal operation of our business.
Results of Operations
The tables below set forth certain financial and operating data for the periods indicated. We evaluate the performance of our consolidated operations by focusing on adjusted gross margin, while we evaluate the performance of our operating segments based on segment profit and adjusted gross margin, as reflected in the tables below (in millions, except volumes):
| | | | | | | | | | | | | | | | | | | | | | | | | | | | | | | | | | | |
| Permian | | Louisiana | | Oklahoma | | North Texas | | Corporate | | Totals |
| Year Ended December 31, 2021 | | | | | | | | | | | |
| Gross margin | $ | 89.8 | | | $ | 183.9 | | | $ | 123.3 | | | $ | 136.6 | | | $ | (8.0) | | | $ | 525.6 | |
| Depreciation and amortization | 139.9 | | | 141.0 | | | 204.3 | | | 114.3 | | | 8.0 | | | 607.5 | |
| Segment profit | 229.7 | | | 324.9 | | | 327.6 | | | 250.9 | | | — | | | 1,133.1 | |
| Operating expenses | 81.5 | | | 123.7 | | | 80.0 | | | 77.7 | | | — | | | 362.9 | |
| Adjusted gross margin | $ | 311.2 | | | $ | 448.6 | | | $ | 407.6 | | | $ | 328.6 | | | $ | — | | | $ | 1,496.0 | |
| | | | | | | | | | | | | | | | | | | | | | | | | | | | | | | | | | | |
| Permian | | Louisiana | | Oklahoma | | North Texas | | Corporate | | Totals |
| Year Ended December 31, 2020 | | | | | | | | | | | |
| Gross margin | $ | 44.9 | | | $ | 139.8 | | | $ | 188.5 | | | $ | 127.0 | | | $ | (7.3) | | | $ | 492.9 | |
| Depreciation and amortization | 125.2 | | | 145.8 | | | 216.9 | | | 143.4 | | | 7.3 | | | 638.6 | |
| Segment profit | 170.1 | | | 285.6 | | | 405.4 | | | 270.4 | | | — | | | 1,131.5 | |
| Operating expenses | 94.2 | | | 120.0 | | | 82.2 | | | 77.4 | | | — | | | 373.8 | |
| Adjusted gross margin | $ | 264.3 | | | $ | 405.6 | | | $ | 487.6 | | | $ | 347.8 | | | $ | — | | | $ | 1,505.3 | |
| | | | | | | | | | | | | | | | | | | | | | | | | | | | | | | | | | | |
| Permian | | Louisiana | | Oklahoma | | North Texas | | Corporate | | Totals |
| Year Ended December 31, 2019 | | | | | | | | | | | |
| Gross margin | $ | 36.6 | | | $ | 143.1 | | | $ | 255.2 | | | $ | 149.8 | | | $ | (8.4) | | | $ | 576.3 | |
| Depreciation and amortization | 119.8 | | | 154.1 | | | 194.9 | | | 139.8 | | | 8.4 | | | 617.0 | |
| Segment profit | 156.4 | | | 297.2 | | | 450.1 | | | 289.6 | | | — | | | 1,193.3 | |
| Operating expenses | 112.9 | | | 147.3 | | | 104.0 | | | 102.9 | | | — | | | 467.1 | |
| Adjusted gross margin | $ | 269.3 | | | $ | 444.5 | | | $ | 554.1 | | | $ | 392.5 | | | $ | — | | | $ | 1,660.4 | |
| | | | | | | | | | | | | | | | | |
| Year Ended December 31, |
| 2021 | | 2020 | | 2019 |
| Midstream Volumes: | | | | | |
| Permian Segment | | | | | |
| Gathering and Transportation (MMbtu/d) | 1,067,000 | | | 890,800 | | | 723,400 | |
| Processing (MMbtu/d) | 1,010,000 | | | 899,000 | | | 771,400 | |
| Crude Oil Handling (Bbls/d) | 134,600 | | | 116,200 | | | 132,000 | |
| Louisiana Segment | | | | | |
| Gathering and Transportation (MMbtu/d) | 2,160,800 | | | 1,993,900 | | | 2,050,000 | |
| Crude Oil Handling (Bbls/d) | 15,900 | | | 16,900 | | | 18,900 | |
| NGL Fractionation (Gals/d) | 7,455,600 | | | 7,597,800 | | | 7,341,700 | |
| Brine Disposal (Bbls/d) | 2,700 | | | 1,300 | | | 2,700 | |
| Oklahoma Segment | | | | | |
| Gathering and Transportation (MMbtu/d) | 992,400 | | | 1,116,500 | | | 1,302,200 | |
| Processing (MMbtu/d) | 1,010,300 | | | 1,105,900 | | | 1,276,700 | |
| Crude Oil Handling (Bbls/d) | 20,200 | | | 28,700 | | | 47,300 | |
| North Texas Segment | | | | | |
| Gathering and Transportation (MMbtu/d) | 1,377,400 | | | 1,478,200 | | | 1,651,900 | |
| Processing (MMbtu/d) | 631,500 | | | 671,000 | | | 750,500 | |
Year Ended December 31, 2021 Compared to Year Ended December 31, 2020
Gross Margin. Gross margin was $525.6 million for the year ended December 31, 2021 compared to $492.9 million for the year ended December 31, 2020, an increase of $32.7 million. The primary contributors to the total increase were as follows:
•Permian Segment. Gross margin was $89.8 million for the year ended December 31, 2021 compared to $44.9 million for the year ended December 31, 2020, an increase of $44.9 million primarily due to the following:
◦Adjusted gross margin in the Permian segment increased $46.9 million, which was primarily driven by:
•A $44.1 million increase to adjusted gross margin associated with our Permian gas assets. Adjusted gross margin, excluding derivative activity, increased $127.9 million, which was primarily due to higher volumes and significantly favorable commodity prices on gas sales during Winter Storm Uri. Derivative activity associated with our Permian gas assets decreased margin by $83.8 million, which included $81.5 million from increased realized losses, primarily due to Winter Storm Uri, and $2.3 million from increased unrealized losses.
•A $2.8 million increase to adjusted gross margin associated with our Permian crude assets. Adjusted gross margin, excluding derivative activity, increased $2.3 million, which was primarily due to higher volumes from existing customers and was partially offset by weather disruptions from Winter Storm Uri and storage fees earned in April of 2020, but not in 2021. Derivative activity associated with our Permian crude assets increased margin by $0.5 million, which included $7.0 million from increased realized gains and was partially offset by $6.5 million from increased unrealized losses.
◦Operating expenses in the Permian segment decreased $12.7 million primarily due to lower utility costs as a result of approximately $46.5 million of utility credits that we received because our electricity usage was below our contractual base load amounts during Winter Storm Uri, which entitled us to credits based on market rates for our unused electricity. These credits can and have been used to offset future utility payments. Operating expenses also decreased due to lower labor and benefits expense as a result of reductions in workforce in April 2020. These decreases were partially offset by $24.9 million of increases in construction fees and services related to the relocation of the War Horse and Phantom processing plants, increases in materials and supplies expense and compressor rentals due to higher volumes, and increases in sales and use taxes as a result of tax refunds in the first half of 2020.
◦Depreciation and amortization in the Permian segment increased $14.7 million primarily due to new assets placed into service, including the Tiger processing plant in August 2020 and acquisition of the Amarillo Rattler, LLC gathering and processing system in April 2021.
•Louisiana Segment. Gross margin was $183.9 million for the year ended December 31, 2021 compared to $139.8 million for the year ended December 31, 2020, an increase of $44.1 million primarily due to the following:
◦Adjusted gross margin in the Louisiana segment increased $43.0 million, resulting from:
•A $39.3 million increase to adjusted gross margin associated with our Louisiana NGL transmission and fractionation assets. Adjusted gross margin, excluding derivative activity, increased $56.4 million, which was primarily due to favorable market prices on NGL sales. Derivative activity associated with our Louisiana NGL transmission and fractionation assets decreased margin by $17.1 million, which included $27.1 million from increased realized losses partially offset by $10.0 million from decreased unrealized losses.
•A $5.8 million increase to adjusted gross margin associated with our Louisiana gas assets. Adjusted gross margin, excluding derivative activity, increased $21.3 million, which was primarily due to increased gathering and transportation fees as a result of higher volumes transported in addition to increased storage and hub fees following the acquisition of the Jefferson Island storage facility in December 2020. Derivative activity associated with our Louisiana gas assets decreased margin by $15.5 million, which included $11.6 million from increased realized losses and $3.9 million from increased unrealized losses.
•A $2.1 million decrease to adjusted gross margin associated with our ORV crude assets. Adjusted gross margin, excluding derivative activity, decreased $5.6 million, which was primarily due to lower volumes. Derivative activity associated with our ORV crude assets increased margin by $3.5 million due to $2.4 million from decreased realized losses and $1.1 million from increased unrealized gains.
◦Operating expenses in the Louisiana segment increased $3.7 million primarily due to increased materials and supplies expense and utilities. This increase was partially offset by lower labor and benefits expense as a result of reductions in workforce in April 2020 and ad valorem taxes.
◦Depreciation and amortization in the Louisiana segment decreased $4.8 million primarily due to the impairment of assets in the first quarter of 2020.
•Oklahoma Segment. Gross margin was $123.3 million for the year ended December 31, 2021 compared to $188.5 million for the year ended December 31, 2020, a decrease of $65.2 million primarily due to the following:
◦Adjusted gross margin in the Oklahoma segment decreased $80.0 million, resulting from:
•A $79.0 million decrease to adjusted gross margin associated with our Oklahoma gas assets. Adjusted gross margin, excluding derivative activity, decreased $61.7 million, which was primarily due to lower volumes from our existing customers, including weather disruptions from Winter Storm Uri, and a $56.2 million decrease in adjusted gross margin resulting from the expiration of the MVC provision of a gathering and processing contract at the end of 2020. Derivative activity associated with our Oklahoma gas assets decreased margin by $17.3 million, which included $19.3 million from increased realized losses and was partially offset by $2.0 million from decreased unrealized losses.
•A $1.0 million decrease to adjusted gross margin associated with our Oklahoma crude assets. Adjusted gross margin, excluding derivative activity, decreased $4.6 million, which was primarily due to lower volumes from our existing customers and partially as a result of weather disruptions from Winter Storm Uri. Derivative activity associated with our Oklahoma crude assets increased margin by $3.6 million, which included $1.1 million from increased realized gains and $2.5 million from increased unrealized gains.
◦Operating expenses in the Oklahoma segment decreased $2.2 million primarily due to reductions in compressor rentals and lower labor and benefits expense as a result of reductions in workforce in April 2020. These decreases were partially offset by higher costs in 2021 to decommission equipment from the Battle Ridge processing plant to move to the War Horse processing plant.
◦Depreciation and amortization in the Oklahoma segment decreased $12.6 million primarily due to the relocation of the Battle Ridge processing plant to the War Horse processing plant.
•North Texas Segment. Gross margin was $136.6 million for the year ended December 31, 2021 compared to $127.0 million for the year ended December 31, 2020, an increase of $9.6 million primarily due to the following:
◦Adjusted gross margin in the North Texas segment decreased $19.2 million. Adjusted gross margin, excluding derivative activity, decreased $8.2 million, which was primarily due to lower volumes from our existing customers. Derivative activity associated with our North Texas segment decreased margin by $11.0 million, which included $6.2 million from increased realized losses and $4.8 million from increased unrealized losses.
◦Operating expenses in the North Texas segment increased $0.3 million primarily due to reductions in compressor rentals, reductions to labor and benefits expense as a result of reductions in workforce in April 2020 and reductions to utility costs. These decreases were partially offset by increases in materials and supplies expense, operation and maintenance costs, and increases in sales and use taxes as a result of tax refunds in the first half of 2020.
◦Depreciation and amortization in the North Texas segment decreased $29.1 million primarily due to a change in the estimated useful lives of certain non-core assets that were fully depreciated at the end of 2020.
•Corporate Segment. Gross margin was negative $8.0 million for the year ended December 31, 2021 compared to negative $7.3 million for the year ended December 31, 2020, a decrease of $0.7 million. Corporate gross margin consists of depreciation and amortization of corporate assets.
Impairments. Impairment expense is composed of the following amounts (in millions):
| | | | | | | | | | | | | | |
| | Year Ended December 31, |
| | 2021 | | 2020 |
| Goodwill impairment | | $ | — | | | $ | 184.6 | |
| Property and equipment impairment | | 0.6 | | | 168.0 | |
| Lease right-of-use asset impairment | | 0.2 | | | 6.8 | |
| Cancelled projects | | — | | | 3.4 | |
| Total impairments | | $ | 0.8 | | | $ | 362.8 | |
Gain (loss) on disposition of assets. For the year ended December 31, 2021, we recorded an $1.5 million gain on disposition of assets primarily related to the sale of various non-core assets. For the year ended December 31, 2020, we recorded a $8.8 million loss on disposition of assets primarily related to the sale of our non-core crude pipeline assets in South Texas.
General and administrative expenses. General and administrative expenses were $107.8 million for the year ended December 31, 2021 compared to $103.3 million for the year ended December 31, 2020, an increase of $4.5 million. The increase was primarily due to labor and benefits costs, which increased $3.4 million; transaction and transition costs, which increased $1.0 million primarily due to the Amarillo Rattler, LLC acquisition in April 2021; franchise taxes, which increased $0.6 million primarily due to franchise tax refunds in the first half of 2020; and consulting fees and services, which increased $1.8 million. These increases were partially offset by a $2.6 million decrease to unit-based compensation costs.
Interest Expense. Interest expense was $238.7 million for the year ended December 31, 2021 compared to $223.3 million for the year ended December 31, 2020, an increase of $15.4 million, or 6.9%. Net interest expense consisted of the following (in millions):
| | | | | | | | | | | |
| Year Ended December 31, |
| 2021 | | 2020 |
| ENLK and ENLC Senior Notes | $ | 201.1 | | | $ | 175.0 | |
| Term Loan | 4.2 | | | 17.5 | |
| Consolidated Credit Facility | 5.8 | | | 13.9 | |
| AR Facility | 4.1 | | | 0.9 | |
| Capitalized interest | (0.3) | | | (3.4) | |
| Amortization of debt issuance costs and net discount of senior unsecured notes | 5.2 | | | 4.6 | |
| Interest rate swaps - realized | 18.3 | | | 14.5 | |
| Other | 0.3 | | | 0.3 | |
| Total interest expense, net of interest income | $ | 238.7 | | | $ | 223.3 | |
Gain on Extinguishment of Debt. We recognized a gain on extinguishment of debt of $32.0 million for the year ended December 31, 2020 due to repurchases of the 2024, 2025, 2026, and 2029 Notes in open market transactions. For the year ended December 31, 2021, we and ENLK did not repurchase any senior notes. See “Item 8. Financial Statements and Supplementary Data—Note 6” for additional information.
Income (Loss) from Unconsolidated Affiliate Investments. Loss from unconsolidated affiliate investments was $11.5 million for the year ended December 31, 2021 compared to income of $0.6 million for the year ended December 31, 2020, a decrease in income of $12.1 million. The decrease was attributable to a reduction of income of $12.1 million from our GCF investment, as a result of the GCF assets being temporarily idled beginning in January 2021. See “Item 8. Financial Statements and Supplementary Data—Note 10” for additional information.
Income Tax Benefit (Expense). Income tax expense was $25.4 million for the year ended December 31, 2021 compared to income tax expense of $143.2 million for the year ended December 31, 2020, a decrease of tax expense of $117.8 million primarily due to a change in the valuation allowance recorded on our deferred tax assets. See “Item 8. Financial Statements and Supplementary Data—Note 7” for additional information.
Net Income (Loss) Attributable to Non-Controlling Interest. Net income attributable to non-controlling interest was $120.5 million for the year ended December 31, 2021 compared to net income of $105.9 million for the year ended December 31, 2020, an increase of $14.6 million. ENLC’s non-controlling interest is comprised of Series B Preferred Units, Series C Preferred Units, NGP’s 49.9% share of the Delaware Basin JV, and Marathon Petroleum Corporation’s 50% share of the Ascension JV. The increase in income was primarily due to a $7.1 million increase attributable to NGP’s 49.9% share of the Delaware Basin JV, a $4.1 million increase from the Series B Preferred Units, and a $3.4 million increase attributable to Marathon Petroleum Corporation’s 50% share of the Ascension JV.
Year Ended December 31, 2020 Compared to Year Ended December 31, 2019
Gross Margin. Gross margin was $492.9 million for the year ended December 31, 2020 compared to $576.3 million for the year ended December 31, 2019, a decrease of $83.4 million. The primary contributors to the decrease were as follows:
•Permian Segment. Gross margin was $44.9 million for the year ended December 31, 2020 compared to $36.6 million for the year ended December 31, 2019, an increase of $8.3 million primarily due to the following:
◦Adjusted gross margin in the Permian segment decreased $5.0 million, which was primarily driven by:
•A $17.2 million decrease to adjusted gross margin associated with our Permian crude assets. Adjusted gross margin, excluding derivative activity, decreased $9.8 million, which was primarily due to a $15.8 million decrease on our South Texas assets primarily due to the expiration of an MVC provision in one of our contracts in July 2019 and the sale of the VEX assets in October 2020. This decrease was partially offset by a $5.9 million increase due to volume growth in our Delaware Basin crude assets. Derivative activity associated with our Permian crude assets decreased margin by $7.4
million, which included $10.8 million from decreased realized gains and was partially offset by $3.4 million from increased unrealized gains.
•A $12.2 million increase to adjusted gross margin associated with our Permian gas assets. Adjusted gross margin, excluding derivative activity, increased $15.7 million, which was primarily due to volume growth from additional well connects. Derivative activity associated with our Permian gas assets decreased margin by $3.5 million, which included $3.8 million from increased unrealized losses and $0.3 million from decreased realized losses.
◦Operating expenses in the Permian segment decreased $18.7 million primarily due to decreased labor and benefits expense as a result of reductions in workforce and reductions in materials and supplies expense, construction fees and services, vehicle expenses, and sales and use tax.
◦Depreciation and amortization in the Permian segment increased $5.4 million primarily due to new assets placed into service, including the expansion to our Riptide processing plant and the completed construction of our Tiger processing plant.
•Louisiana Segment. Gross margin was $139.8 million for the year ended December 31, 2020 compared to $143.1 million for the year ended December 31, 2019, a decrease of $3.3 million primarily due to the following:
◦Adjusted gross margin in the Louisiana segment decreased $38.9 million, resulting from:
•A $20.2 million decrease to adjusted gross margin associated with our ORV crude assets. Adjusted gross margin, excluding derivative activity, decreased $16.9 million, which was primarily due to lower volumes. Realized losses on derivative activity associated with our ORV crude assets decreased margin by $3.3 million.
•A $14.8 million decrease to adjusted gross margin associated with our Louisiana gas assets. Adjusted gross margin, excluding derivative activity, decreased $12.8 million, which was primarily due to the expiration of certain firm transportation contracts, and decreased gathering and transportation volumes. Derivative activity associated with our Louisiana gas assets decreased margin by $2.0 million, which included $1.8 million from increased unrealized losses and $0.2 million from increased realized losses.
•A $3.9 million decrease to adjusted gross margin associated with our Louisiana NGL transmission and fractionation assets. Adjusted gross margin, excluding derivative activity, increased $6.6 million, which was primarily due to higher volumes that resulted from the completion of the Cajun-Sibon pipeline expansion in April 2019 and a settlement payment received as the result of a contract dispute in the amount of $5.5 million. Derivative activity associated with our Louisiana NGL transmission and fractionation assets decreased margin by $10.5 million, which included $7.6 million from increased realized losses and $2.9 million from increased unrealized losses.
◦Operating expenses in the Louisiana segment decreased $27.3 million primarily due to decreased labor and benefits expense as a result of reductions in workforce and reductions in materials and supplies expense, utilities, construction fees and services, compressor rentals, and vehicle expenses.
◦Depreciation and amortization in the Louisiana segment decreased $8.3 million primarily due to the impairment of Louisiana segment assets in the first quarter of 2020.
•Oklahoma Segment. Gross margin was $188.5 million for the year ended December 31, 2020 compared to $255.2 million for the year ended December 31, 2019, a decrease of $66.7 million primarily due to the following:
◦Adjusted gross margin in the Oklahoma segment decreased $66.5 million, resulting from:
•A $59.7 million decrease to adjusted gross margin associated with our Oklahoma gas assets. Adjusted gross margin, excluding derivative activity, decreased $51.7 million, which was primarily due to volume decline in our Oklahoma gas assets resulting from lower volumes from our existing customers. Derivative activity associated with our Oklahoma gas assets decreased margin by $8.0 million, which included $4.5 million from increased unrealized losses and $3.5 million from increased realized losses.
•A $6.8 million decrease to adjusted gross margin associated with our Oklahoma crude assets. Adjusted gross margin, excluding derivative activity, decreased $5.9 million, which was primarily due to volume decline in our Oklahoma crude assets primarily due to lower volumes from our existing customers. Realized losses on derivative activity associated with our Oklahoma crude assets decreased margin by $0.9 million.
◦Operating expenses in the Oklahoma segment decreased $21.8 million primarily due to decreased labor and benefits expense as a result of reductions in workforce and reductions in materials and supplies expense, construction fees and services, and compressor rentals.
◦Depreciation and amortization in the Oklahoma segment increased $22.0 million primarily due to the Thunderbird processing plant, which was operational in June 2019, as well as a change in the estimated useful lives of certain non-core assets.
•North Texas Segment. Gross margin was $127.0 million for the year ended December 31, 2020 compared to $149.8 million for the year ended December 31, 2019, a decrease of $22.8 million primarily due to the following:
◦Adjusted gross margin in the North Texas segment decreased $44.7 million. Adjusted gross margin, excluding derivative activity, decreased $43.9 million, which was primarily due to volume declines resulting from limited new drilling in the region. Unrealized losses on derivative activity associated with our North Texas segment decreased margin by $0.8 million.
◦Operating expenses in the North Texas segment decreased $25.5 million primarily due to decreased labor and benefits expense as a result of reductions in workforce and reductions in materials and supplies expense, operations and maintenance, fees and services, sales and use tax, ad valorem taxes, and compressor rentals.
◦Depreciation and amortization in the North Texas segment increased $3.6 million primarily due to a change in the estimated useful lives of certain non-core assets and the conclusion of a finance lease in 2019.
•Corporate Segment. Gross margin was negative $7.3 million for the year ended December 31, 2020 compared to negative $8.4 million for the year ended December 31, 2019. Corporate gross margin consists of depreciation and amortization of corporate assets.
Critical Accounting Policies
The selection and application of accounting policies is an important process that has developed as our business activities have evolved and as the accounting rules have developed. Accounting rules generally do not involve a selection among alternatives but involve an interpretation and implementation of existing rules and the use of judgment to the specific set of circumstances existing in our business. Compliance with the rules involves reducing a number of very subjective judgments to a quantifiable accounting entry or valuation. We make every effort to properly comply with all applicable rules on or before their adoption, and we believe the proper implementation and consistent application of the accounting rules is critical.
Our critical accounting policies are discussed below. See “Item 8. Financial Statements and Supplementary Data—Note 2” for further details on our accounting policies and future accounting standards to be adopted.
Impairment of Long-Lived Assets
We evaluate long-lived assets, including property and equipment, intangible assets, equity method investments, and lease right-of-use assets, for potential impairment whenever events or changes in circumstances indicate that their carrying value may not be recoverable. The carrying amount of a long-lived asset is not recoverable when it exceeds the undiscounted sum of the future cash flows expected to result from the use and eventual disposition of the asset. Estimates of expected future cash flows represent management’s best estimate based on reasonable and supportable assumptions. Management’s estimate of future cash flows are subject to uncertainty due to the changing business environment, volatility of commodity prices, and a number of other factors that are beyond our ability to consistently predict. Management updates their estimated future cash flows throughout the year and a potential impairment is highly sensitive to unfavorable changes in the underlying estimated cash flows. When the carrying amount of a long-lived asset is not recoverable, an impairment is recognized equal to the excess of the asset’s carrying value over its fair value, which is based on inputs that are not observable in the market, and thus represent Level 3 inputs. For additional information about our long-lived asset impairment tests, refer to “Item 8. Financial Statements and Supplementary Data—Note 2.”
Property and Equipment Impairments. For the year ended December 31, 2021, we recognized a $0.6 million impairment on property and equipment.
Right-of-Use Asset Impairment. During the fourth quarter of 2021, we entered into a sublease agreement for a portion of our Houston office that will be effective in 2022. We evaluated the related right-of-use asset for impairment by comparing the estimated fair value of the right-of-use asset to its carrying value. The estimated fair value was calculated using a discounted cash flow analysis that utilized Level 3 inputs, which included future cash flows based on the terms of the sublease and a discount rate derived from market data. As the carrying value of the right-of-use asset exceeded the estimated fair value, we have recognized impairment expense of $0.2 million for the year ended December 31, 2021.
To the extent conditions further deteriorate in the current worldwide economic and commodity price environment, we may identify additional triggering events that may require future evaluations of the recoverability of the carrying value of our long-lived assets, which could result in further impairment charges.
Liquidity and Capital Resources
Cash Flows from Operating Activities. Net cash provided by operating activities was $857.3 million for the year ended December 31, 2021 compared to $731.1 million for the year ended December 31, 2020. Operating cash flows and changes in working capital for comparative periods were as follows (in millions):
| | | | | | | | | | | | | |
| Year Ended December 31, | | |
| 2021 | | 2020 | | |
| Operating cash flows before working capital | $ | 802.5 | | | $ | 842.3 | | | |
| Changes in working capital | 54.8 | | | (111.2) | | | |
| | | | | |
Operating cash flows before changes in working capital decreased $39.8 million for the year ended December 31, 2021 compared to the year ended December 31, 2020. The primary contributors to the decrease in operating cash flows were as follows:
•Gross margin; excluding depreciation and amortization; non-cash commodity swap activity; utility credits, net of usage; and unit-based compensation, decreased $36.0 million. For more information regarding the changes in gross margin for the year ended December 31, 2021 compared to the year ended December 31, 2020, see “Results of Operations.”
•General and administrative expenses, excluding unit-based compensation, increased $7.1 million. For more information, see “Results of Operations.”
•Interest expense, excluding amortization of debt issuance costs, net discount of senior unsecured notes, and designated cash flow hedge, increased $2.8 million.
•Distribution of earnings from unconsolidated affiliates, excluding distributions in excess of earnings which are classified as investing cash flows, decreased $1.6 million.
These changes to operating cash flows were offset by the following:
•Cash payments for the early termination of our interest rate swaps, due to the partial repayments of the Term Loan, decreased $9.1 million.
The changes in working capital for the years ended December 31, 2021 and 2020 were primarily due to fluctuations in trade receivable and payable balances due to timing of collection and payments, changes in inventory balances attributable to normal operating fluctuations, and fluctuations in accrued revenue and accrued cost of sales.
Historically, we have had net operating losses that eliminated substantially all of our taxable income, and thus, we have not historically paid significant amounts of income taxes. We anticipate generating net operating losses for tax purposes during 2022, and as a result, do not expect to incur material amounts of federal and state income tax liabilities. In the event that we do generate taxable income that exceeds our utilizable net operating loss carryforwards, federal and state income tax liabilities will increase cash taxes paid. Refer to “Item 8. Financial Statements and Supplementary Data—Note 7” for additional information.
Cash Flows from Investing Activities. Net cash used in investing activities was $231.4 million for the year ended December 31, 2021 compared to $317.7 million for the year ended December 31, 2020. Our primary investing activities consisted of the following (in millions):
| | | | | | | | | | | | | |
| Year Ended December 31, | | |
| 2021 | | 2020 | | |
| Additions to property and equipment (1) | $ | (184.0) | | | $ | (302.2) | | | |
| Acquisition of assets (2) | (56.7) | | | (32.3) | | | |
| Proceeds from sale of property (3) | 4.8 | | | 17.6 | | | |
____________________________
(1)The decrease in capital expenditures was primarily due to the completion of major projects in 2020.
(2)Acquisition of assets for the year ended December 31, 2020 included the acquisition of the Jefferson Island storage facility. Acquisition of assets for the year ended December 31, 2021 included the acquisition of Amarillo Rattler assets and other minor acquisitions.
(3)Proceeds from the sale of assets related to the sale of non-core assets.
Cash Flows from Financing Activities. Net cash used in financing activities was $639.3 million for the year ended December 31, 2021 compared to $451.2 million for the year ended December 31, 2020. Our primary financing activities consisted of the following (in millions):
| | | | | | | | | | | | | |
| Year Ended December 31, | | |
| 2021 | | 2020 | | |
| Net repayments on the Term Loan (1) | $ | (350.0) | | | $ | (500.0) | | | |
| Net borrowings on the AR Facility (1) | 100.0 | | | 250.0 | | | |
| Net borrowings (repayments) on the Consolidated Credit Facility (1) | 15.0 | | | (350.0) | | | |
| Net borrowings on ENLC senior unsecured notes (1) | — | | | 499.2 | | | |
| Net repurchases on ENLK’s senior unsecured notes (1) | — | | | (35.2) | | | |
| Distributions to members | (186.8) | | | (232.7) | | | |
| Distributions to Series B and Series C Preferred unitholders (2) | (92.9) | | | (91.3) | | | |
| Distributions to joint venture partners (3) | (37.9) | | | (29.9) | | | |
| Redemption of Series B Preferred units (2) | (50.0) | | | — | | | |
| Common unit repurchases (4) | (40.1) | | | (1.2) | | | |
| Contributions by non-controlling interest (5) | 3.2 | | | 52.6 | | | |
| Conversion of restricted units, net of units withheld for taxes | (2.0) | | | (4.7) | | | |
| Debt financing costs | (0.3) | | | (7.7) | | | |
____________________________
(1)See “Item 8. Financial Statements and Supplementary Data—Note 6” for more information regarding the Term Loan, the AR Facility, the Consolidated Credit Facility, and the senior unsecured notes.
(2)See “Item 8. Financial Statements and Supplementary Data—Note 8” for information on distributions to holders of the Series B Preferred Units and Series C Preferred Units and information on the partial redemption of Series B Preferred Units.
(3)Represents distributions to NGP for its ownership in the Delaware Basin JV, distributions to Marathon Petroleum Corporation for its ownership in the Ascension JV, and distributions to other non-controlling interests.
(4)See “Item 8. Financial Statements and Supplementary Data—Note 9” for more information regarding the ENLC common unit repurchase program.
(5)Represents contributions from NGP to the Delaware Basin JV.
Capital Requirements. We expect our total capital expenditures and expenses related to the relocation of equipment and facilities, which are recorded as operating expenses, to range between $285 million to $325 million for 2022. Our primary capital projects for 2022 include the relocation of the Phantom processing plant, continued development of our existing systems through well connects, and other low-cost development projects. We expect to fund our remaining 2022 capital expenditures from operating cash flows and capital contributions by joint venture partners that relate to the non-controlling interest share of our consolidated entities.
It is possible that not all of our planned projects will be commenced or completed. Our ability to pay distributions to our unitholders, to fund planned capital expenditures, and to make acquisitions will depend upon our future operating performance, which will be affected by prevailing economic conditions in the industry, financial, business, and other factors, some of which are beyond our control.
In August 2021, we received a $4.4 million grant from the Texas Commission on Environmental Quality (“TCEQ”) as a result of the TCEQ Emissions Reduction Incentive Grant Program. This grant will allow us to seek reimbursements for costs associated with upgrading compressor units that will result in reduced nitrogen oxide levels.
Off-Balance Sheet Arrangements. We had no off-balance sheet arrangements as of December 31, 2021 and 2020.
Total Contractual Cash Obligations. A summary of our total contractual cash obligations as of December 31, 2021 is as follows (in millions):
| | | | | | | | | | | | | | | | | | | | | | | | | | | | | | | | | | | | | | | | | |
| Payments Due by Period |
| Total | | 2022 | | 2023 | | 2024 | | 2025 | | 2026 | | Thereafter |
| ENLC’s & ENLK’s senior unsecured notes | $ | 4,032.3 | | | $ | — | | | $ | — | | | $ | 521.8 | | | $ | 720.8 | | | $ | 491.0 | | | $ | 2,298.7 | |
| Consolidated Credit Facility (1) | 15.0 | | | — | | | — | | | 15.0 | | | — | | | — | | | — | |
| AR Facility (2) | 350.0 | | | — | | | — | | | 350.0 | | | — | | | — | | | — | |
| Acquisition installment payable (3) | 10.0 | | | 10.0 | | | — | | | — | | | — | | | — | | | — | |
| Acquisition contingent consideration (4) | 6.9 | | | — | | | — | | | 2.3 | | | 2.4 | | | 2.2 | | | — | |
| Interest payable on fixed long-term debt obligations | 2,334.9 | | | 201.2 | | | 201.2 | | | 189.7 | | | 163.3 | | | 148.3 | | | 1,431.2 | |
| Operating lease obligations | 115.6 | | | 21.1 | | | 15.3 | | | 10.1 | | | 9.8 | | | 8.9 | | | 50.4 | |
| Purchase obligations | 4.9 | | | 4.9 | | | — | | | — | | | — | | | — | | | — | |
| Pipeline and trucking capacity and deficiency agreements (5) | 316.0 | | | 50.9 | | | 54.6 | | | 50.9 | | | 39.4 | | | 30.9 | | | 89.3 | |
| Inactive easement commitment (6) | 10.0 | | | 10.0 | | | — | | | — | | | — | | | — | | | — | |
| Total contractual obligations | $ | 7,195.6 | | | $ | 298.1 | | | $ | 271.1 | | | $ | 1,139.8 | | | $ | 935.7 | | | $ | 681.3 | | | $ | 3,869.6 | |
____________________________
(1)The Consolidated Credit Facility will mature on January 25, 2024.
(2)The AR Facility will terminate on September 24, 2024, unless extended or earlier terminated in accordance with its terms.
(3)Amount related to the consideration of the Amarillo Rattler, LLC acquisition due on April 30, 2022.
(4)The estimated fair value of the Amarillo Rattler, LLC contingent consideration was calculated in accordance with the fair value guidance contained in ASC 820. There are a number of assumptions and estimates factored into these fair values and actual contingent consideration payments could differ from these estimated fair values. See “Item 8. Financial Statements and Supplementary Data—Note 13” for additional information.
(5)Consists of pipeline capacity payments for firm transportation and deficiency agreements.
(6)Amount related to inactive easements paid as utilized by us with the balance due in August 2022 if not utilized.
The above table does not include any physical or financial contract purchase commitments for natural gas and NGLs due to the nature of both the price and volume components of such purchases, which vary on a daily or monthly basis. Additionally, we do not have contractual commitments for fixed price and/or fixed quantities of any material amount that is not already disclosed in the table above.
The interest payable related to the Consolidated Credit Facility and the AR Facility are not reflected in the above table because such amounts depend on the outstanding balances and interest rates of the Consolidated Credit Facility and the AR Facility, which vary from time to time.
Our contractual cash obligations for 2022 are expected to be funded from cash flows generated from our operations and the available capacity under the Consolidated Credit Facility or other debt sources.
Indebtedness
In October 2020, we entered into the AR Facility, which was originally a three-year committed accounts receivable securitization facility in the amount of up to $250.0 million. During 2021, we entered into two amendments to the Receivables Financing Agreement, which amended the AR Facility to, among other things, increase the facility limit and lender commitments to $350.0 million and extend the scheduled termination date to September 24, 2024. As of December 31, 2021, the AR Facility had a borrowing base of $350.0 million and there was $350.0 million in outstanding borrowings under the AR Facility.
In addition, as of December 31, 2021, we have $4.0 billion in aggregate principal amount of outstanding unsecured senior notes maturing from 2024 to 2047. There was $15.0 million in outstanding borrowings under the Consolidated Credit Facility and $41.3 million outstanding letters of credit as of December 31, 2021.
Guarantees. The amounts outstanding on our senior unsecured notes and the Consolidated Credit Facility are guaranteed in full by our subsidiary ENLK, including 105% of any letters of credit outstanding on the Consolidated Credit Facility. ENLK’s guarantees of these amounts are full, irrevocable, unconditional, and absolute, and cover all payment obligations arising under the senior unsecured notes and the Consolidated Credit Facility. Liabilities under the guarantees rank equally in right of payment with all existing and future senior unsecured indebtedness of ENLK.
ENLC’s assets consist of all of the outstanding common units of ENLK and all of the membership interests of the General Partner. Other than these equity interests, all of our assets and operations are held by our non-guarantor operating subsidiaries. ENLK, directly and indirectly, owns all of these non-guarantor operating subsidiaries, which in some cases are joint ventures that are partially owned by a third party. As a result, the assets, liabilities, and results of operations of ENLK are not materially different than the corresponding amounts presented in our consolidated financial statements.
As of December 31, 2021, ENLC records, on a stand-alone basis, transactions that do not occur at ENLK, which are primarily related to taxation of ENLC and the elimination of intercompany borrowings.
See “Item 8. Financial Statements and Supplementary Data—Note 6” for more information on our outstanding debt.
Credit Risk
Risks of nonpayment and nonperformance by our customers are a major concern in our business. We are subject to risks of loss resulting from nonpayment or nonperformance by our customers and other counterparties, such as our lenders and hedging counterparties. Any increase in the nonpayment and nonperformance by our customers could adversely affect our results of operations and reduce our ability to make distributions to our unitholders.
Inflation
Inflation in the United States has been relatively low in recent years. However, the annual U.S. inflation rate has accelerated throughout 2021 and this trend is expected to continue in 2022. In addition, base interest rates are expected to rise in 2022. Although we do not expect inflation to have a material effect on our results, the increased inflation may increase the cost to acquire or replace property and equipment and the costs of labor and supplies. To the extent permitted by competition, regulation, and our existing agreements, we have and will continue to pass along increased costs to our customers in the form of higher fees. Additionally, certain of our revenue generating contracts contain clauses that increase our fees based on changes in inflation metrics.
Environmental
Our operations are subject to environmental laws and regulations adopted by various governmental authorities in the jurisdictions in which these operations are conducted. We believe we are in material compliance with all applicable laws and regulations. For a more complete discussion of the environmental laws and regulations that impact us, see “Item 1. Business—Environmental Matters.”
Contingencies
See “Item 8. Financial Statements and Supplementary Data—Note 14.”
Recent Accounting Pronouncements
See “Item 8. Financial Statements and Supplementary Data—Note 2” in our Annual Report on Form 10-K for the year ended December 31, 2020 filed with the Commission on February 17, 2021 for information on recently issued and adopted accounting pronouncements.
Disclosure Regarding Forward-Looking Statements
This Annual Report on Form 10-K contains forward-looking statements within the meaning of the federal securities laws. Although these statements reflect the current views, assumptions and expectations of our management, the matters addressed herein involve certain assumptions, risks and uncertainties that could cause actual activities, performance, outcomes and results to differ materially from those indicated herein. Therefore, you should not rely on any of these forward-looking statements. All statements, other than statements of historical fact, included in this Annual Report constitute forward-looking statements, including, but not limited to, statements identified by the words “forecast,” “may,” “believe,” “will,” “should,” “plan,”
“predict,” “anticipate,” “intend,” “estimate,” “expect,” “continue,” and similar expressions. Such forward-looking statements include, but are not limited to, statements about when additional capacity will be operational, timing for completion of construction or expansion projects, results in certain basins, profitability, financial or leverage metrics, future cost savings or operational initiatives, our future capital structure and credit ratings, objectives, strategies, expectations, and intentions, the impact of the COVID-19 pandemic, Winter Storm Uri, and other weather related events on us and our financial results and operations, and other statements that are not historical facts. Factors that could result in such differences or otherwise materially affect our financial condition, results of operations, or cash flows, include, without limitation, (a) the impact of the ongoing coronavirus (COVID-19) pandemic (including the impact of any new variants of the virus) on our business, financial condition, and results of operations, (b) potential conflicts of interest of GIP with us and the potential for GIP to favor GIP’s own interests to the detriment of our unitholders, (c) GIP’s ability to compete with us and the fact that it is not required to offer us the opportunity to acquire additional assets or businesses, (d) a default under GIP’s credit facility could result in a change in control of us, could adversely affect the price of our common units, and could result in a default or prepayment event under our credit facility and certain of our other debt, (e) the dependence on Devon for a substantial portion of the natural gas and crude that we gather, process, and transport, (f) developments that materially and adversely affect Devon or other customers, (g) adverse developments in the midstream business that may reduce our ability to make distributions, (h) competition for crude oil, condensate, natural gas, and NGL supplies and any decrease in the availability of such commodities, (i) decreases in the volumes that we gather, process, fractionate, or transport, (j) increasing scrutiny and changing expectations from stakeholders with respect to our environment, social, and governance practices, (k) our ability to receive or renew required permits and other approvals, (l) increased federal, state, and local legislation, and regulatory initiatives, as well as government reviews relating to hydraulic fracturing resulting in increased costs and reductions or delays in natural gas production by our customers, (m) climate change legislation and regulatory initiatives resulting in increased operating costs and reduced demand for the natural gas and NGL services we provide, (n) changes in the availability and cost of capital, including as a result of a change in our credit rating, (o) volatile prices and market demand for crude oil, condensate, natural gas, and NGLs that are beyond our control, (p) our debt levels could limit our flexibility and adversely affect our financial health or limit our flexibility to obtain financing and to pursue other business opportunities, (q) operating hazards, natural disasters, weather-related issues or delays, casualty losses, and other matters beyond our control, (r) reductions in demand for NGL products by the petrochemical, refining, or other industries or by the fuel markets, (s) impairments to goodwill, long-lived assets and equity method investments, and (t) the effects of existing and future laws and governmental regulations, including environmental and climate change requirements and other uncertainties. In addition to the specific uncertainties, factors, and risks discussed above and elsewhere in this Annual Report, the risk factors set forth in “Item 1A. Risk Factors” may affect our performance and results of operations. Should one or more of these risks or uncertainties materialize, or should underlying assumptions prove incorrect, actual results may differ materially from those in the forward-looking statements. We disclaim any intention or obligation to update or review any forward-looking statements or information, whether as a result of new information, future events, or otherwise.
Item 7A. Quantitative and Qualitative Disclosures about Market Risk
Market risk is the risk of loss arising from adverse changes in market rates and prices. Our primary market risk is the risk related to changes in the prices of natural gas, NGLs, condensate, and crude oil. In addition, we are also exposed to the risk of changes in interest rates on floating rate debt.
Comprehensive financial reform legislation was signed into law by the President on July 21, 2010. The legislation calls for the CFTC to regulate certain markets for derivative products, including OTC derivatives. The CFTC has issued several relevant regulations, and other rulemakings are pending at the CFTC, the product of which would be rules that implement the mandates in the legislation to cause significant portions of derivatives markets to clear through clearinghouses. While some of these rules have been finalized, some have not, and, as a result, the final form and timing of the implementation of the regulatory regime affecting commodity derivatives remains uncertain.
The legislation and potential new regulations may also require counterparties to our derivative instruments to spin off or result in such counterparties spinning off some of their derivatives activities to separate entities, which may not be as creditworthy as the current counterparties. The legislation and any new regulations could significantly increase the cost of derivative contracts, materially alter the terms of derivative contracts, reduce the availability of derivatives to protect against risks we encounter, reduce our ability to monetize or restructure our existing derivative contracts, and increase our exposure to less creditworthy counterparties. If we reduce our use of derivatives as a result of the legislation and regulations, our results of operations may become more volatile and our cash flows may be less predictable, which could adversely affect our ability to plan for and fund capital expenditures and to generate sufficient cash flow to pay quarterly distributions at current levels or at all. Our revenues could be adversely affected if a consequence of the legislation and regulations is to lower commodity prices. Any of these consequences could have a material, adverse effect on us, our financial condition, and our results of operations.
On January 14, 2021, the CFTC published final rules under the Dodd-Frank Act establishing position limit levels for certain energy commodity futures contracts, options and contracts on futures contracts directly or indirectly linked to core
referenced futures contracts, and economically equivalent swaps. The position limit levels set the maximum position that a trader may own or control separately or in combination, net long or short, subject to exceptions for certain bona fide hedging transactions. These rules came into effect on March 15, 2021 with compliance dates starting from January 1, 2022. We do not expect these position limit rules will have a material effect on us.
Commodity Price Risk
Commodity prices were volatile during 2021. Crude oil prices increased 58%, weighted average NGL prices increased 77%, and natural gas prices increased 45% from January 1, 2021 to December 31, 2021. We expect continued volatility in these commodity prices. For example, see the table below for the range of closing prices for crude oil, NGL, and natural gas during 2021.
| | | | | | | | | | | | | | |
| Commodity | | Closing Price | | Date |
| Crude oil (high) (1) | | $ | 84.65 | | | October 26, 2021 |
| Crude oil (low) (1) | | $ | 47.62 | | | January 4, 2021 |
| Crude oil (average) (1)(4) | | $ | 68.11 | | | Not applicable |
| NGL (high) (2) | | $ | 1.02 | | | November 1, 2021 |
| NGL (low) (2) | | $ | 0.46 | | | January 4, 2021 |
| NGL (average) (2)(4) | | $ | 0.71 | | | Not applicable |
| Natural gas (high) (3) | | $ | 6.31 | | | October 5, 2021 |
| Natural gas (low) (3) | | $ | 2.45 | | | January 22, 2021 |
| Natural gas (average) (3)(4) | | $ | 3.72 | | | Not applicable |
____________________________
(1)Crude oil closing prices based on the NYMEX futures daily close prices.
(2)Weighted average NGL gas closing prices based on the Oil Price Information Service Napoleonville daily average spot liquids prices.
(3)Natural gas closing prices based on Gas Daily Henry Hub closing prices.
(4)The average closing price was computed by taking the sum of the closing prices of each trading day divided by the number of trading days during the period presented.
Changes in commodity prices may indirectly impact our profitability by influencing drilling activity and well operations, and thus the volume of gas, NGLs, crude oil, and condensate connected to or near our assets and on our fees earned for transportation between certain market centers. Low prices for these products could reduce the demand for our services and volumes in our systems. The volatility in commodity prices may cause our adjusted gross margin and cash flows to vary widely from period to period. Our hedging strategies may not be sufficient to offset price volatility risk and, in any event, do not cover all of our throughput volumes.
We are also subject to direct risks due to fluctuations in commodity prices. While approximately 89% of our adjusted gross margin for the year ended December 31, 2021 was generated from arrangements with fee-based structures with minimal direct commodity price exposure, the remainder is subject to more direct commodity price exposure. Our exposure to these commodity price fluctuations is primarily in the gas processing component of our business. We currently earn adjusted gross margin under four main types of contractual arrangements (or a combination of these types of contractual arrangements) as summarized below.
1.Fee-based contracts: Under fee-based contracts, we earn our fees through (1) stated fixed-fee arrangements in which we are paid a fixed fee per unit of volume or (2) arrangements where we purchase and resell commodities in connection with providing the related service and earn a net margin through a fee-like deduction subtracted from the purchase price of the commodities. We may also purchase and resell commodities in arrangements under which we are subject to commodity price fluctuations. Although historically this has not been a material component of our adjusted gross margin, Winter Storm Uri caused sudden and significant price and volume fluctuations that resulted in increased adjusted gross margin that is exposed to commodity price fluctuations. For more information on Winter Storm Uri and its impact on the Company, see the discussion at “Item 7. Management’s Discussion and Analysis of Financial Condition and Results of Operations—Recent Developments Affecting Industry Conditions and Our Business—Extreme Weather Events” in this Report. For the year ended December 31, 2021, approximately 5% of our adjusted gross margin was generated from purchase and resell arrangements under which we are subject to commodity price fluctuations. This amount was substantially offset by derivative losses.
2.Processing margin contracts: Under these contracts, we pay the producer for the full amount of inlet gas to the plant, and we make a margin based on the difference between the value of liquids recovered from the processed natural gas as compared to the value of the natural gas volumes lost and the cost of fuel used in processing. The shrink and fuel losses are referred to as plant thermal reduction, or PTR. Our margins from these contracts are high during periods of high liquids prices relative to natural gas prices and can be negative during periods of high natural gas prices relative to liquids prices. However, we mitigate our risk of processing natural gas when margins are negative primarily through our ability to bypass processing when it is not profitable for us or by contracts that revert to a minimum fee for processing if the natural gas must be processed to meet pipeline quality specifications. For the year ended December 31, 2021, less than 1% of our adjusted gross margin was generated from processing margin contracts.
3.POL contracts: Under these contracts, we receive a fee in the form of a percentage of the liquids recovered, and the producer bears all the cost of the natural gas shrink. Therefore, our margins from these contracts are greater during periods of high liquids prices. Our margins from processing cannot become negative under POL contracts, but they do decline during periods of low liquids prices.
4.POP contracts: Under these contracts, we receive a fee in the form of a portion of the proceeds of the sale of natural gas and liquids. Therefore, our margins from these contracts are greater during periods of high natural gas and liquids prices. Our margins from processing cannot become negative under POP contracts, but they do decline during periods of low natural gas and liquids prices.
For the year ended December 31, 2021, approximately 6% of our adjusted gross margin was generated from POL or POP contracts.
Our primary commodity risk management objective is to reduce volatility in our cash flows. We maintain a risk management committee, including members of senior management, which oversees all hedging activity. We enter into hedges for natural gas, crude and condensate, and NGLs using OTC derivative financial instruments with only certain well-capitalized counterparties, which have been approved in accordance with our commodity risk management policy.
We have hedged our exposure to fluctuations in prices for natural gas, NGLs, and crude oil volumes produced for our account. We have tailored our hedges to generally match the product composition and the delivery points to those of our physical equity volumes. The hedges cover specific products based upon our expected equity composition.
The following table sets forth certain information related to derivative instruments outstanding at December 31, 2021. These derivative instruments mitigate the risks associated with the gas processing and fractionation components of our business. The relevant payment index price for liquids is the monthly average of the daily closing price for deliveries of commodities into Mont Belvieu, Texas as reported by Oil Price Information Service. The relevant index price for natural gas is Henry Hub Gas Daily as defined by the pricing dates in the swap contracts. | | | | | | | | | | | | | | | | | | | | | | | | | | | | | | | | |
| Period | | Underlying | | Notional Volume | | We Pay | | We Receive (1) | | Net Fair Value
Asset/(Liability)
(In millions) |
| January 2022 - September 2022 | | Propane | | 1,235 (MBbls) | | Index | | $1.063/Gal | | $ | (8.1) | |
| January 2022 - September 2022 | | Normal butane | | 265 (MBbls) | | Index | | $1.248/Gal | | (2.5) | |
| January 2022 - October 2022 | | Natural gas | | 56,625 (MMbtu/d) | | Index | | $3.8406/MMbtu | | (5.1) | |
| January 2022 - January 2023 | | Crude and condensate | | 7,715 (MBbls) | | Index | | $75.82/Bbl | | 1.2 | |
| | | | | | | | | | $ | (14.5) | |
____________________________ (1)Weighted average.
Another price risk we face is the risk of mismatching volumes of gas bought or sold on a monthly price versus volumes bought or sold on a daily price. We enter each month with a balanced book of natural gas bought and sold on the same basis. However, it is normal to experience fluctuations in the volumes of natural gas bought or sold under either basis, which leaves us with short or long positions that must be covered. We use financial swaps to mitigate the exposure at the time it is created to maintain a balanced position.
The use of financial instruments may expose us to the risk of financial loss in certain circumstances, including instances when (1) sales volumes are less than expected requiring market purchases to meet commitments or (2) counterparties fail to purchase the contracted quantities of natural gas or otherwise fail to perform. To the extent that we engage in hedging activities,
we may be prevented from realizing the benefits of favorable price changes in the physical market. However, we are similarly insulated against unfavorable changes in such prices.
As of December 31, 2021, outstanding natural gas swap agreements, NGL swap agreements, swing swap agreements, storage swap agreements, and other derivative instruments had a net fair value liability of $14.5 million. The aggregate effect of a hypothetical 10% change, increase or decrease, in gas, crude and condensate, and NGL prices would result in a change of approximately $4.5 million in the net fair value of these contracts as of December 31, 2021.
Interest Rate Risk
We are exposed to interest rate risk on the Consolidated Credit Facility and the AR Facility. At December 31, 2021, we had $15.0 million and $350.0 million in outstanding borrowings under the Consolidated Credit Facility and the AR Facility, respectively. A 1.0% increase or decrease in interest rates would change our annualized interest expense by approximately $0.2 million and $3.5 million for the Consolidated Credit Facility and the AR Facility, respectively.
Amounts drawn on the Consolidated Credit Facility and the AR Facility currently bear interest at rates based on LIBOR, which is beginning to be phased out. Both the Consolidated Credit Facility and the AR Facility include mechanisms to amend the facilities to reflect the establishment of an alternative to LIBOR, and the AR Facility has been amended to include a specific replacement reference rate alternative. However, the replacement rate for the AR Facility could result in a higher interest rate than LIBOR. If no such contractual alternative is established for the Consolidated Credit Facility before the LIBOR phase out is complete, it would bear interest at the prime rate, which would be higher than LIBOR, until a contractual alternative is established.
We are not exposed to changes in interest rates with respect to ENLK’s senior unsecured notes due in 2024, 2025, 2026, 2044, 2045, or 2047 or our senior unsecured notes due in 2028 and 2029 as these are fixed-rate obligations. As of December 31, 2021, the estimated fair value of the senior unsecured notes was approximately $4,155.0 million, based on the market prices of ENLK’s and our publicly traded debt at December 31, 2021. Market risk is estimated as the potential decrease in fair value of our long-term debt resulting from a hypothetical increase of 1.0% in interest rates. Such an increase in interest rates would result in an approximate $255.4 million decrease in fair value of the senior unsecured notes at December 31, 2021. See “Item 8. Financial Statements and Supplementary Data—Note 6” for more information on our outstanding indebtedness.
Beginning on December 15, 2022, distributions on ENLK’s Series C Preferred Units will be based on a floating rate tied to LIBOR rather than a fixed rate and, therefore, the amount paid by ENLK as a distribution will be more sensitive to changes in interest rates.
Item 8. Financial Statements and Supplementary Data
INDEX TO FINANCIAL STATEMENTS
| | | | | |
| EnLink Midstream, LLC and Subsidiaries Financial Statements: | |
| |
| Management’s Report on Internal Control Over Financial Reporting | |
| |
Report of Independent Registered Public Accounting Firm (KPMG LLP, Dallas, TX, Auditor Firm ID: 185) | |
| |
| Consolidated Balance Sheets as of December 31, 2021 and 2020 | |
| |
| Consolidated Statements of Operations for the years ended December 31, 2021, 2020, and 2019 | |
| |
| Consolidated Statements of Comprehensive Income (Loss) for the years ended December 31, 2021, 2020, and 2019 | |
| |
| Consolidated Statements of Changes in Members’ Equity for the years ended December 31, 2021, 2020, and 2019 | |
| |
| Consolidated Statements of Cash Flows for the years ended December 31, 2021, 2020, and 2019 | |
| |
| Notes to Consolidated Financial Statements | |
MANAGEMENT’S REPORT ON
INTERNAL CONTROL OVER FINANCIAL REPORTING
Management of EnLink Midstream Manager, LLC, the Managing Member, is responsible for establishing and maintaining adequate internal control over financial reporting and for the assessment of the effectiveness of internal control over financial reporting for EnLink Midstream, LLC (the “Company”). As defined by the Securities and Exchange Commission (Rule 13a-15(f) under the Securities Exchange Act of 1934, as amended), internal control over financial reporting is a process designed by, or under the supervision of EnLink Midstream Manager, LLC’s principal executive and principal financial officers and effected by its Board of Directors, management and other personnel, to provide reasonable assurance regarding the reliability of financial reporting and the preparation of the consolidated financial statements in accordance with GAAP.
The Company’s internal control over financial reporting is supported by written policies and procedures that (1) pertain to the maintenance of records that, in reasonable detail, accurately and fairly reflect the Company’s transactions and dispositions of the Company’s assets; (2) provide reasonable assurance that transactions are recorded as necessary to permit preparation of the consolidated financial statements in accordance with GAAP, and that receipts and expenditures of the Company are being made only in accordance with authorization of EnLink Midstream Manager, LLC’s management and directors; and (3) provide reasonable assurance regarding prevention or timely detection of unauthorized acquisition, use or disposition of the Company’s assets that could have a material effect on the consolidated financial statements.
Because of its inherent limitations, internal control over financial reporting may not prevent or detect misstatements. Also, projections of any evaluation of effectiveness to future periods are subject to the risk that controls may become inadequate because of changes in conditions, or that the degree of compliance with the policies or procedures may deteriorate.
In connection with the preparation of the Company’s annual consolidated financial statements, management has undertaken an assessment of the effectiveness of the Company’s internal control over financial reporting as of December 31, 2021, based on criteria established in Internal Control—Integrated Framework (2013) issued by the Committee of Sponsoring Organizations of the Treadway Commission (the COSO Framework). Management’s assessment included an evaluation of the design of the Company’s internal control over financial reporting and testing of the operational effectiveness of those controls.
Based on this assessment, management has concluded that as of December 31, 2021, the Company’s internal control over financial reporting was effective to provide reasonable assurance regarding the reliability of financial reporting and the preparation of financial statements for external purposes in accordance with GAAP.
KPMG LLP, the independent registered public accounting firm that audited the Company’s consolidated financial statements included in this report, has issued an attestation report on the Company’s internal control over financial reporting, a copy of which appears on the following page of this Annual Report on Form 10-K.
Report of Independent Registered Public Accounting Firm
To the Members of EnLink Midstream, LLC
and Board of Directors of EnLink Midstream Manager, LLC:
Opinions on the Consolidated Financial Statements and Internal Control Over Financial Reporting
We have audited the accompanying consolidated balance sheets of EnLink Midstream, LLC and subsidiaries (the Company) as of December 31, 2021 and December 31, 2020, the related consolidated statements of operations, comprehensive income (loss), changes in members’ equity, and cash flows for each of the years in the three-year period ended December 31, 2021, and the related notes (collectively, the consolidated financial statements). We also have audited the Company’s internal control over financial reporting as of December 31, 2021, based on criteria established in Internal Control – Integrated Framework (2013) issued by the Committee of Sponsoring Organizations of the Treadway Commission.
In our opinion, the consolidated financial statements referred to above present fairly, in all material respects, the financial position of the Company as of December 31, 2021 and December 31, 2020, and the results of its operations and its cash flows for each of the years in the three-year period ended December 31, 2021, in conformity with U.S. generally accepted accounting principles. Also in our opinion, the Company maintained, in all material respects, effective internal control over financial reporting as of December 31, 2021 based on criteria established in Internal Control – Integrated Framework (2013) issued by the Committee of Sponsoring Organizations of the Treadway Commission.
Basis for Opinions
The Company’s management is responsible for these consolidated financial statements, for maintaining effective internal control over financial reporting, and for its assessment of the effectiveness of internal control over financial reporting, included in the accompanying Management’s Report on Internal Control Over Financial Reporting. Our responsibility is to express an opinion on the Company’s consolidated financial statements and an opinion on the Company’s internal control over financial reporting based on our audits. We are a public accounting firm registered with the Public Company Accounting Oversight Board (United States) (PCAOB) and are required to be independent with respect to the Company in accordance with the U.S. federal securities laws and the applicable rules and regulations of the Securities and Exchange Commission and the PCAOB.
We conducted our audits in accordance with the standards of the PCAOB. Those standards require that we plan and perform the audits to obtain reasonable assurance about whether the consolidated financial statements are free of material misstatement, whether due to error or fraud, and whether effective internal control over financial reporting was maintained in all material respects.
Our audits of the consolidated financial statements included performing procedures to assess the risks of material misstatement of the consolidated financial statements, whether due to error or fraud, and performing procedures that respond to those risks. Such procedures included examining, on a test basis, evidence regarding the amounts and disclosures in the consolidated financial statements. Our audits also included evaluating the accounting principles used and significant estimates made by management, as well as evaluating the overall presentation of the consolidated financial statements. Our audit of internal control over financial reporting included obtaining an understanding of internal control over financial reporting, assessing the risk that a material weakness exists, and testing and evaluating the design and operating effectiveness of internal control based on the assessed risk. Our audits also included performing such other procedures as we considered necessary in the circumstances. We believe that our audits provide a reasonable basis for our opinions.
Definition and Limitations of Internal Control Over Financial Reporting
A company’s internal control over financial reporting is a process designed to provide reasonable assurance regarding the reliability of financial reporting and the preparation of financial statements for external purposes in accordance with generally accepted accounting principles. A company’s internal control over financial reporting includes those policies and procedures that (1) pertain to the maintenance of records that, in reasonable detail, accurately and fairly reflect the transactions and dispositions of the assets of the company; (2) provide reasonable assurance that transactions are recorded as necessary to permit preparation of financial statements in accordance with generally accepted accounting principles, and that receipts and expenditures of the company are being made only in accordance with authorizations of management and directors of the company; and (3) provide reasonable assurance regarding prevention or timely detection of unauthorized acquisition, use, or disposition of the company’s assets that could have a material effect on the financial statements.
Because of its inherent limitations, internal control over financial reporting may not prevent or detect misstatements. Also, projections of any evaluation of effectiveness to future periods are subject to the risk that controls may become inadequate because of changes in conditions, or that the degree of compliance with the policies or procedures may deteriorate.
Critical Audit Matter
The critical audit matter communicated below is a matter arising from the current period audit of the consolidated financial statements that was communicated or required to be communicated to the audit committee and that: (1) relates to accounts or disclosures that are material to the consolidated financial statements and (2) involved our especially challenging, subjective, or complex judgments. The communication of a critical audit matter does not alter in any way our opinion on the consolidated financial statements, taken as a whole, and we are not, by communicating the critical audit matter below, providing a separate opinion on the critical audit matter or on the accounts or disclosures to which it relates.
Evaluation of long-lived assets for impairment triggering events
As discussed in Note 2 to the consolidated financial statements, the Company evaluates property, plant, and equipment and intangible assets (collectively, long-lived assets) for potential impairment whenever events or changes in circumstances indicate that their carrying value may not be recoverable (triggering events). Triggering events include significant changes in the use of the asset group, current and/or historical operating results that are significantly less than forecasted results, negative industry or economic trends including changes in commodity prices, significant adverse changes in legal or regulatory factors, or an expectation that it is more likely than not that an asset group will be sold before the end of its useful life. The carrying value of property, plant, and equipment and intangible assets as of December 31, 2021 was $6.39 billion and $1.05 billion, respectively.
We identified the evaluation of long-lived assets for impairment triggering events as a critical audit matter. A higher degree of subjective auditor judgment was required to evaluate the impact of forecasted prices for oil, natural gas, and natural gas liquids (NGL) on the recoverability of the Company’s long-lived assets as sustained declines in commodity prices could result in decreases in volumes gathered, processed, fractionated, and transported by the Company.
The following are the primary procedures we performed to address this critical audit matter. We evaluated the design and tested the operating effectiveness of certain internal controls over the Company’s process to evaluate triggering events related to the impairment of long-lived assets. This included controls related to the Company’s selection of forecasted prices for oil, natural gas, and NGL and the identification and assessment of the potential impacts of such prices on oil, natural gas, and NGL volumes available to the Company. We examined the Company’s analysis of potential triggering events for long-lived assets and evaluated the Company’s responses to the factors identified by inspecting publicly available information regarding rig counts and producer drilling outlook. We involved valuation professionals with specialized skills and knowledge, who assisted in evaluating the forecasted prices for oil, natural gas, and NGL used in the Company’s analysis by comparing such prices to commodity price curves prepared by third parties.
We have served as the Company’s auditor since 2013.
Dallas, Texas
February 16, 2022
ENLINK MIDSTREAM, LLC AND SUBSIDIARIES
Consolidated Balance Sheets
(In millions, except unit data)
| | | | | | | | | | | |
| December 31, 2021 | | December 31, 2020 |
| ASSETS | | | |
| Current assets: | | | |
| Cash and cash equivalents | $ | 26.2 | | | $ | 39.6 | |
| Accounts receivable: | | | |
Trade, net of allowance for bad debt of $0.3 and $0.5, respectively | 94.9 | | | 80.6 | |
| Accrued revenue and other | 693.3 | | | 447.5 | |
| Fair value of derivative assets | 22.4 | | | 25.0 | |
| Other current assets | 83.6 | | | 58.7 | |
| Total current assets | 920.4 | | | 651.4 | |
Property and equipment, net of accumulated depreciation of $4,332.0 and $3,863.0, respectively | 6,388.3 | | | 6,652.1 | |
Intangible assets, net of accumulated amortization of $795.1 and $668.8, respectively | 1,049.7 | | | 1,125.4 | |
| Investment in unconsolidated affiliates | 28.0 | | | 41.6 | |
| Fair value of derivative assets | 0.2 | | | 4.9 | |
| Other assets, net | 96.6 | | | 75.5 | |
| Total assets | $ | 8,483.2 | | | $ | 8,550.9 | |
LIABILITIES AND MEMBERS’ EQUITY | | | |
| Current liabilities: | | | |
| Accounts payable and drafts payable | $ | 139.6 | | | $ | 60.5 | |
| Accrued gas, NGLs, condensate, and crude oil purchases (1) | 521.5 | | | 291.5 | |
| Fair value of derivative liabilities | 34.9 | | | 37.1 | |
| Current maturities of long-term debt | — | | | 349.8 | |
| Other current liabilities | 202.9 | | | 149.1 | |
| Total current liabilities | 898.9 | | | 888.0 | |
| Long-term debt | 4,363.7 | | | 4,244.0 | |
| Other long-term liabilities | 93.9 | | | 94.8 | |
| Deferred tax liability, net | 137.5 | | | 108.6 | |
| Fair value of derivative liabilities | 2.2 | | | 2.5 | |
| | | |
| Members’ equity: | | | |
Members’ equity (484,277,258 and 489,381,149 units issued and outstanding, respectively) | 1,325.8 | | | 1,508.8 | |
| Accumulated other comprehensive loss | (1.4) | | | (15.3) | |
| Non-controlling interest | 1,662.6 | | | 1,719.5 | |
| Total members’ equity | 2,987.0 | | | 3,213.0 | |
| Commitments and contingencies (Note 14) | | | |
| Total liabilities and members’ equity | $ | 8,483.2 | | | $ | 8,550.9 | |
____________________________
(1)Includes related party accounts payable balances of $1.6 million and $1.0 million at December 31, 2021 and December 31, 2020, respectively.
See accompanying notes to consolidated financial statements.
ENLINK MIDSTREAM, LLC AND SUBSIDIARIES
Consolidated Statements of Operations
(In millions, except per unit data)
| | | | | | | | | | | | | | | | | |
| Year Ended December 31, |
| 2021 | | 2020 | | 2019 |
| Revenues: | | | | | |
| Product sales | $ | 5,994.0 | | | $ | 2,977.5 | | | $ | 5,030.1 | |
| Midstream services | 851.0 | | | 938.3 | | | 1,008.4 | |
| Gain (loss) on derivative activity | (159.1) | | | (22.0) | | | 14.4 | |
| Total revenues | 6,685.9 | | | 3,893.8 | | | 6,052.9 | |
| Operating costs and expenses: | | | | | |
| Cost of sales, exclusive of operating expenses and depreciation and amortization (1) | 5,189.9 | | | 2,388.5 | | | 4,392.5 | |
| Operating expenses | 362.9 | | | 373.8 | | | 467.1 | |
| Depreciation and amortization | 607.5 | | | 638.6 | | | 617.0 | |
| Impairments | 0.8 | | | 362.8 | | | 1,133.5 | |
| (Gain) loss on disposition of assets | (1.5) | | | 8.8 | | | (1.9) | |
| General and administrative | 107.8 | | | 103.3 | | | 152.6 | |
| Loss on secured term loan receivable | — | | | — | | | 52.9 | |
| | | | | |
| Total operating costs and expenses | 6,267.4 | | | 3,875.8 | | | 6,813.7 | |
| Operating income (loss) | 418.5 | | | 18.0 | | | (760.8) | |
| Other income (expense): | | | | | |
| Interest expense, net of interest income | (238.7) | | | (223.3) | | | (216.0) | |
| Gain on extinguishment of debt | — | | | 32.0 | | | — | |
| Income (loss) from unconsolidated affiliates | (11.5) | | | 0.6 | | | (16.8) | |
| Other income | — | | | 0.3 | | | 0.9 | |
| Total other expense | (250.2) | | | (190.4) | | | (231.9) | |
| Income (loss) before non-controlling interest and income taxes | 168.3 | | | (172.4) | | | (992.7) | |
| Income tax expense | (25.4) | | | (143.2) | | | (6.9) | |
| Net income (loss) | 142.9 | | | (315.6) | | | (999.6) | |
| Net income attributable to non-controlling interest | 120.5 | | | 105.9 | | | 119.7 | |
| Net income (loss) attributable to ENLC | $ | 22.4 | | | $ | (421.5) | | | $ | (1,119.3) | |
| Net income (loss) attributable to ENLC per unit: | | | | | |
| Basic common unit | $ | 0.05 | | | $ | (0.86) | | | $ | (2.41) | |
| Diluted common unit | $ | 0.05 | | | $ | (0.86) | | | $ | (2.41) | |
____________________________
(1)Includes related party cost of sales of $17.9 million, $8.7 million, and $21.7 million for the years ended December 31, 2021, 2020, and 2019, respectively.
See accompanying notes to consolidated financial statements.
ENLINK MIDSTREAM, LLC AND SUBSIDIARIES
Consolidated Statements of Comprehensive Income (Loss)
(In millions)
| | | | | | | | | | | | | | | | | |
| Year Ended December 31, |
| 2021 | | 2020 | | 2019 |
| Net income (loss) | $ | 142.9 | | | $ | (315.6) | | | $ | (999.6) | |
| Unrealized gain (loss) on designated cash flow hedge (1) | 13.9 | | | (4.3) | | | (9.0) | |
| Comprehensive income (loss) | 156.8 | | | (319.9) | | | (1,008.6) | |
| Comprehensive income attributable to non-controlling interest | 120.5 | | | 105.9 | | | 119.7 | |
| Comprehensive income (loss) attributable to ENLC | $ | 36.3 | | | $ | (425.8) | | | $ | (1,128.3) | |
____________________________
(1)Includes a tax expense of $4.3 million for the year ended December 31, 2021 and a tax benefit of $1.3 million and $3.4 million for the years ended December 31, 2020 and 2019, respectively.
See accompanying notes to consolidated financial statements.
ENLINK MIDSTREAM, LLC AND SUBSIDIARIES
Consolidated Statements of Changes in Members’ Equity
(In millions)
| | | | | | | | | | | | | | | | | | | | | | | | | | | | | | | | | | | | | | |
| | Common Units | | Accumulated Other Comprehensive Loss | | Non-Controlling Interest | | Total | | Redeemable Non-controlling interest (Temporary Equity) |
| | $ | | Units | | $ | | $ | | $ | | $ |
| Balance, December 31, 2018 | | $ | 1,730.9 | | | 181.3 | | | $ | (2.0) | | | $ | 3,245.3 | | | $ | 4,974.2 | | | $ | 9.3 | |
| Adoption of ASC 842 | | 0.3 | | | — | | | — | | | — | | | 0.3 | | | — | |
| Balance, January 1, 2019 | | 1,731.2 | | | 181.3 | | | (2.0) | | | 3,245.3 | | | 4,974.5 | | | 9.3 | |
| Issuance of common units for ENLK public common units related to the Merger | | 1,958.1 | | | 304.9 | | | — | | | (1,559.1) | | | 399.0 | | | — | |
| Conversion of restricted units for common units, net of units withheld for taxes | | (7.8) | | | 1.6 | | | — | | | (2.8) | | | (10.6) | | | — | |
| Unit-based compensation | | 37.5 | | | — | | | — | | | 1.4 | | | 38.9 | | | — | |
| Contributions from non-controlling interests | | — | | | — | | | — | | | 97.5 | | | 97.5 | | | — | |
| Distributions | | (467.2) | | | — | | | — | | | (220.2) | | | (687.4) | | | (0.3) | |
| Unrealized loss on designated cash flow hedge (1) | | — | | | — | | | (9.0) | | | — | | | (9.0) | | | — | |
| Fair value adjustment related to redeemable non-controlling interest | | 3.0 | | | — | | | — | | | — | | | 3.0 | | | (4.0) | |
| Net income (loss) | | (1,119.3) | | | — | | | — | | | 119.5 | | | (999.8) | | | 0.2 | |
| Balance, December 31, 2019 | | 2,135.5 | | | 487.8 | | | (11.0) | | | 1,681.6 | | | 3,806.1 | | | 5.2 | |
| Conversion of restricted units for common units, net of units withheld for taxes | | (4.7) | | | 2.0 | | | — | | | — | | | (4.7) | | | — | |
| Unit-based compensation | | 33.0 | | | — | | | — | | | — | | | 33.0 | | | — | |
| Contributions from non-controlling interests | | — | | | — | | | — | | | 52.6 | | | 52.6 | | | — | |
| Distributions | | (232.7) | | | — | | | — | | | (120.6) | | | (353.3) | | | (0.6) | |
| Unrealized loss on designated cash flow hedge (2) | | — | | | — | | | (4.3) | | | — | | | (4.3) | | | — | |
| Fair value adjustment related to redeemable non-controlling interest | | 0.4 | | | — | | | — | | | — | | | 0.4 | | | (0.6) | |
| Redemption of non-controlling interest | | — | | | — | | | — | | | — | | | — | | | (4.0) | |
| Common units repurchased | | (1.2) | | | (0.4) | | | — | | | — | | | (1.2) | | | — | |
| Net income (loss) | | (421.5) | | | — | | | — | | | 105.9 | | | (315.6) | | | — | |
| Balance, December 31, 2020 | | $ | 1,508.8 | | | 489.4 | | | $ | (15.3) | | | $ | 1,719.5 | | | $ | 3,213.0 | | | $ | — | |
____________________________
(1)Includes a tax benefit of $3.4 million.
(2)Includes a tax benefit of $1.3 million.
See accompanying notes to consolidated financial statements.
ENLINK MIDSTREAM, LLC AND SUBSIDIARIES
Consolidated Statements of Changes in Members’ Equity (Continued)
(In millions)
| | | | | | | | | | | | | | | | | | | | | | | | | | | | | | | | | | | | | | |
| | Common Units | | Accumulated Other Comprehensive Loss | | Non-Controlling Interest | | Total | | Redeemable Non-controlling interest (Temporary Equity) |
| | $ | | Units | | $ | | $ | | $ | | $ |
| Balance, December 31, 2020 | | $ | 1,508.8 | | | 489.4 | | | $ | (15.3) | | | $ | 1,719.5 | | | $ | 3,213.0 | | | $ | — | |
| Conversion of restricted units for common units, net of units withheld for taxes | | (2.0) | | | 1.0 | | | — | | | — | | | (2.0) | | | — | |
| Unit-based compensation | | 23.6 | | | — | | | — | | | — | | | 23.6 | | | — | |
| Contributions from non-controlling interests | | — | | | — | | | — | | | 3.2 | | | 3.2 | | | — | |
| Distributions | | (186.8) | | | — | | | — | | | (130.6) | | | (317.4) | | | (0.2) | |
| Unrealized gain on designated cash flow hedge (1) | | — | | | — | | | 13.9 | | | — | | | 13.9 | | | — | |
| Fair value adjustment related to redeemable non-controlling interest | | (0.1) | | | — | | | — | | | — | | | (0.1) | | | 0.2 | |
| Redemption of Series B Preferred Units | | — | | | — | | | — | | | (50.0) | | | (50.0) | | | — | |
| Common units repurchased | | (40.1) | | | (6.1) | | | — | | | — | | | (40.1) | | | — | |
| Net income | | 22.4 | | | — | | | — | | | 120.5 | | | 142.9 | | | — | |
| Balance, December 31, 2021 | | $ | 1,325.8 | | | 484.3 | | | $ | (1.4) | | | $ | 1,662.6 | | | $ | 2,987.0 | | | $ | — | |
____________________________
(1)Includes a tax expense of $4.3 million.
See accompanying notes to consolidated financial statements.
ENLINK MIDSTREAM, LLC AND SUBSIDIARIES
Consolidated Statements of Cash Flows
(In millions)
| | | | | | | | | | | | | | | | | |
| Year Ended December 31, |
| 2021 | | 2020 | | 2019 |
| Cash flows from operating activities: | | | | | |
| Net income (loss) | $ | 142.9 | | | $ | (315.6) | | | $ | (999.6) | |
| Adjustments to reconcile net income (loss) to net cash provided by operating activities: | | | | | |
| Depreciation and amortization | 607.5 | | | 638.6 | | | 617.0 | |
| Impairments | 0.8 | | | 362.8 | | | 1,133.5 | |
| (Gain) loss on disposition of assets | (1.5) | | | 8.8 | | | (1.9) | |
| Loss on secured term loan receivable | — | | | — | | | 52.9 | |
| Non-cash unit-based compensation | 25.3 | | | 28.4 | | | 39.4 | |
| Utility credits, net of usage | (32.6) | | | — | | | — | |
| Non-cash loss on derivatives recognized in net income (loss) | 10.3 | | | 14.8 | | | 2.5 | |
| Gain on extinguishment of debt | — | | | (32.0) | | | — | |
| Amortization of debt issuance costs and net discount of senior unsecured notes | 5.2 | | | 4.6 | | | 4.9 | |
| Amortization of designated cash flow hedge | 12.5 | | | 0.5 | | | 0.1 | |
| Payments to terminate interest rate swaps | (1.8) | | | (10.9) | | | — | |
| Deferred income tax expense | 24.6 | | | 142.1 | | | 6.9 | |
| Distribution of earnings from unconsolidated affiliates | — | | | 1.6 | | | 16.5 | |
| (Income) loss from unconsolidated affiliates | 11.5 | | | (0.6) | | | 16.8 | |
| Other operating activities | (2.2) | | | (0.8) | | | (2.3) | |
| Changes in assets and liabilities: | | | | | |
| Accounts receivable, accrued revenue, and other | (259.9) | | | (21.5) | | | 337.1 | |
| Natural gas and NGLs inventory, prepaid expenses, and other | (13.6) | | | 15.1 | | | 13.6 | |
| Accounts payable, accrued product purchases, and other accrued liabilities | 328.3 | | | (104.8) | | | (245.5) | |
| Net cash provided by operating activities | 857.3 | | | 731.1 | | | 991.9 | |
| Cash flows from investing activities: | | | | | |
| Additions to property and equipment | (184.0) | | | (302.2) | | | (754.9) | |
| Acquisition of assets | (56.7) | | | (32.3) | | | — | |
| Proceeds from sale of property | 4.8 | | | 17.6 | | | 14.3 | |
| Distribution from unconsolidated affiliates in excess of earnings | 3.9 | | | 0.5 | | | 3.7 | |
| Other investing activities | 0.6 | | | (1.3) | | | (4.6) | |
| Net cash used in investing activities | (231.4) | | | (317.7) | | | (741.5) | |
| Cash flows from financing activities: | | | | | |
| Proceeds from borrowings | 1,234.5 | | | 1,650.0 | | | 3,310.0 | |
| Payments on borrowings | (1,469.5) | | | (1,786.0) | | | (2,971.4) | |
| Distribution to members | (186.8) | | | (232.7) | | | (467.2) | |
| Distributions to non-controlling interests | (130.8) | | | (121.2) | | | (220.5) | |
| Redemption of Series B Preferred Units | (50.0) | | | — | | | — | |
| Common unit repurchases | (40.1) | | | (1.2) | | | — | |
| Contributions by non-controlling interests | 3.2 | | | 52.6 | | | 97.5 | |
| Conversion of restricted units, net of units withheld for taxes | (2.0) | | | (4.7) | | | (7.8) | |
| Debt financing costs | (0.3) | | | (7.7) | | | (10.0) | |
| Other financing activities | 2.5 | | | (0.3) | | | (4.0) | |
| Net cash used in financing activities | (639.3) | | | (451.2) | | | (273.4) | |
| Net decrease in cash and cash equivalents | (13.4) | | | (37.8) | | | (23.0) | |
| Cash and cash equivalents, beginning of period | 39.6 | | | 77.4 | | | 100.4 | |
| Cash and cash equivalents, end of period | $ | 26.2 | | | $ | 39.6 | | | $ | 77.4 | |
See accompanying notes to consolidated financial statements.
ENLINK MIDSTREAM, LLC AND SUBSIDIARIES
Notes to Consolidated Financial Statements
(1) Organization and Nature of Business
(a) Organization of Business
ENLC is a Delaware limited liability company formed in October 2013. The Company’s common units are traded on the New York Stock Exchange under the symbol “ENLC.” ENLC owns all of ENLK’s common units and also owns all of the membership interests of the General Partner. The General Partner manages ENLK’s operations and activities.
Devon Transaction
In 2014, we completed a series of transactions with Devon pursuant to which Devon contributed certain subsidiaries and assets to us in exchange for a majority interest in us (the “Devon Transaction”).
GIP Transaction
On July 18, 2018, subsidiaries of Devon closed a transaction to sell all of their equity interests in ENLK, ENLC, and the Managing Member to GIP. As a result of the transaction:
•GIP, through GIP III Stetson I, L.P., acquired all of the equity interests held by subsidiaries of Devon in ENLK and the Managing Member, which, as of the closing date, amounted to 100% of the outstanding limited liability company interests in the Managing Member and approximately 23.1% of the outstanding limited partner interests in ENLK;
•GIP, through GIP III Stetson II, L.P., acquired all of the equity interests held by subsidiaries of Devon in ENLC, which, as of the closing date, amounted to approximately 63.8% of the outstanding limited liability company interests in ENLC; and
•Through this transaction, GIP acquired control of (i) the Managing Member, (ii) ENLC, and (iii) ENLK, as a result of ENLC’s ownership of the General Partner.
Simplification of the Corporate Structure
On January 25, 2019, we completed the Merger, an internal reorganization pursuant to which ENLC owns all of the outstanding common units of ENLK. As a result of the Merger:
•Each issued and outstanding ENLK common unit (except for ENLK common units held by ENLC and its subsidiaries) was converted into 1.15 ENLC common units, which resulted in the issuance of 304,822,035 ENLC common units.
•The General Partner’s incentive distribution rights in ENLK were eliminated.
•Certain terms of the Series B Preferred Units were modified pursuant to an amended partnership agreement of ENLK. See “Note 8—Certain Provisions of the Partnership Agreement” for additional information regarding the modified terms of the Series B Preferred Units.
•ENLC issued to the holder of the Series B Preferred Units, for no additional consideration, ENLC Class C Common Units equal to the number of Series B Preferred Units held immediately prior to the effective time of the Merger, in order to provide Series B Preferred Unit holders with certain voting rights with respect to ENLC. ENLC also agreed to issue an additional ENLC Class C Common Unit to the applicable holder of each Series B Preferred Unit for each additional Series B Preferred Unit issued by ENLK in quarterly in-kind distributions. In addition, for each Series B Preferred Unit that is exchanged into an ENLC common unit or repurchased, an ENLC Class C Common Unit will be canceled.
•Each unit-based award issued and outstanding immediately prior to the effective time of the Merger under the GP Plan was converted into 1.15 awards with respect to ENLC common units with substantially similar terms as were in effect immediately prior to the effective time.
ENLINK MIDSTREAM, LLC AND SUBSIDIARIES
Notes to Consolidated Financial Statements (continued)
•Each unit-based award with performance-based vesting conditions issued and outstanding immediately prior to the effective time of the Merger under the GP Plan and the 2014 Plan was modified such that the performance metric for any then outstanding performance award relates (on a weighted average basis) to (i) the combined performance of ENLC and ENLK for periods preceding the effective time of the Merger and (ii) the performance of ENLC for periods on and after the effective time of the Merger.
•ENLC assumed the outstanding debt under the Term Loan and ENLK became a guarantor thereof. See “Note 6—Long-Term Debt” for additional information regarding the Term Loan.
•We refinanced our existing revolving credit facilities at ENLK and ENLC. In connection with the Merger, we entered into the Consolidated Credit Facility, with respect to which ENLK is a guarantor. See “Note 6—Long-Term Debt” for additional information regarding the Consolidated Credit Facility.
•We were required to allocate the goodwill in our Corporate reporting unit previously associated with the incentive distribution rights in ENLK granted to the General Partner which were created in connection with the Devon Transaction, to the Permian, Louisiana, Oklahoma, and North Texas reporting units.
•We reduced our deferred tax liability by $399.0 million related to ENLC’s step-up in basis of ENLK’s underlying assets with the offsetting credit in members’ equity. See “Note 7—Income Taxes” for more information on the deferred tax liabilities.
(b) Nature of Business
We primarily focus on providing midstream energy services, including:
•gathering, compressing, treating, processing, transporting, storing, and selling natural gas;
•fractionating, transporting, storing, and selling NGLs; and
•gathering, transporting, stabilizing, storing, trans-loading, and selling crude oil and condensate, in addition to brine disposal services.
Our midstream energy asset network includes approximately 12,100 miles of pipelines, 22 natural gas processing plants with approximately 5.5 Bcf/d of processing capacity, seven fractionators with approximately 320,000 Bbls/d of fractionation capacity, barge and rail terminals, product storage facilities, purchasing and marketing capabilities, brine disposal wells, a crude oil trucking fleet, and equity investments in certain joint ventures. Our operations are based in the United States, and our sales are derived primarily from domestic customers.
Our natural gas business includes connecting the wells of producers in our market areas to our gathering systems. Our gathering systems consist of networks of pipelines that collect natural gas from points at or near producing wells and transport it to our processing plants or to larger pipelines for further transmission. We operate processing plants that remove NGLs from the natural gas stream that is transported to the processing plants by our own gathering systems or by third-party pipelines. In conjunction with our gathering and processing business, we may purchase natural gas and NGLs from producers and other supply sources and sell that natural gas or NGLs to utilities, industrial consumers, marketers, and pipelines. Our transmission pipelines receive natural gas from our gathering systems and from third-party gathering and transmission systems and deliver natural gas to industrial end-users, utilities, and other pipelines.
Our fractionators separate NGLs into separate purity products, including ethane, propane, iso-butane, normal butane, and natural gasoline. Our fractionators receive NGLs primarily through our transmission lines that transport NGLs from East Texas and from our South Louisiana processing plants. Our fractionators also have the capability to receive NGLs by truck or rail terminals. We also have agreements pursuant to which third parties transport NGLs from our West Texas and Central Oklahoma operations to our NGL transmission lines that then transport the NGLs to our fractionators. In addition, we have NGL storage capacity to provide storage for customers.
Our crude oil and condensate business includes the gathering and transmission of crude oil and condensate via pipelines, barges, rail, and trucks, in addition to condensate stabilization and brine disposal. We also purchase crude oil and condensate from producers and other supply sources and sell that crude oil and condensate through our terminal facilities to various markets.
ENLINK MIDSTREAM, LLC AND SUBSIDIARIES
Notes to Consolidated Financial Statements (continued)
Across our businesses, we primarily earn our fees through various fee-based contractual arrangements, which include stated fee-only contract arrangements or arrangements with fee-based components where we purchase and resell commodities in connection with providing the related service and earn a net margin as our fee. We earn our net margin under our purchase and resell contract arrangements primarily as a result of stated service-related fees that are deducted from the price of the commodities purchased.
(2) Significant Accounting Policies
(a)Basis of Presentation
The accompanying consolidated financial statements have been prepared in accordance with GAAP. All significant intercompany balances and transactions have been eliminated in consolidation. Certain reclassifications were made to the financial statements for the prior period to conform to current period presentation. The effect of these reclassifications had no impact on previously reported members’ equity or net income (loss).
(b)Management’s Use of Estimates
The preparation of financial statements in accordance with GAAP requires our management to make estimates and assumptions that affect the reported amounts of assets and liabilities and disclosure of contingent assets and liabilities at the date of the financial statements and the reported amounts of revenues and expenses during the period. Actual results could differ from these estimates.
(c)Revenue Recognition
We generate the majority of our revenues from midstream energy services, including gathering, transmission, processing, fractionation, storage, condensate stabilization, brine services, and marketing, through various contractual arrangements, which include fee-based contract arrangements or arrangements where we purchase and resell commodities in connection with providing the related service and earn a net margin for our fee. While our transactions vary in form, the essential element of most of our transactions is the use of our assets to transport a product or provide a processed product to an end-user or marketer at the tailgate of the plant, pipeline, or barge, truck, or rail terminal. Revenues from both “Product sales” and “Midstream services” represent revenues from contracts with customers and are reflected on the consolidated statements of operations as follows:
•Product sales—Product sales represent the sale of natural gas, NGLs, crude oil, and condensate where the product is purchased and resold in connection with providing our midstream services as outlined above.
•Midstream services—Midstream services represent all other revenue generated as a result of performing our midstream services outlined above.
Evaluation of Our Contractual Performance Obligations
Performance obligations in our contracts with customers include:
•promises to perform midstream services for our customers over a specified contractual term and/or for a specified volume of commodities; and
•promises to sell a specified volume of commodities to our customers.
The identification of performance obligations under our contracts requires a contract-by-contract evaluation of when control, including the economic benefit, of commodities transfers to and from us (if at all). For contracts where control of commodities transfers to us before we perform our services, we generally have no performance obligation for our services, and accordingly, we do not consider these revenue-generating contracts. Based on the control determination, all contractually-stated fees that are deducted from our payments to producers or other suppliers for commodities purchased are reflected as a reduction in the cost of such commodity purchases. Alternatively, for contracts where control of commodities transfers to us after we perform our services, we consider these contracts to contain performance obligations for our services. Accordingly, we consider the satisfaction of these performance obligations as revenue-generating and recognize the fees received for satisfying them as
ENLINK MIDSTREAM, LLC AND SUBSIDIARIES
Notes to Consolidated Financial Statements (continued)
midstream services revenues over time as we satisfy our performance obligations. For contracts where control of commodities never transfers to us and we simply earn a fee for our services, we recognize these fees as midstream services revenues over time as we satisfy our performance obligations.
We also evaluate our contractual arrangements that contain a purchase and sale of commodities under the principal/agent provisions in ASC 606. For contracts where we possess control of the commodity and act as principal in the purchase and sale, we record product sales revenue at the price at which the commodities are sold, with a corresponding cost of sales equal to the cost of the commodities when purchased. For contracts in which we do not possess control of the commodity and are acting as an agent, our consolidated statements of operations only reflect midstream services revenues that we earn based on the fees contained in the applicable contract.
Accounting Methodology for Certain Contracts
For NGL contracts in which we purchase raw mix NGLs and subsequently transport, fractionate, and market the NGLs, we consider the contractually-stated fees to serve as pricing mechanisms that reduce the cost of the commodities purchased. We account for the contractually-stated fees on the consolidated statements of operations as a reduction of cost of sales of such commodities purchased upon receipt of the raw mix NGLs, because we determined that the control, including the economic benefit, of commodities has passed to us once the raw mix NGLs have been purchased from the customer. Upon sale of the NGLs to a third-party customer, we record product sales revenue at the price at which the commodities are sold, with a corresponding cost of sales equal to the cost of the commodities purchased.
For our crude oil and condensate service contracts in which we purchase the commodity, we utilize a similar approach under as outlined above for NGL contracts.
For our natural gas gathering and processing contracts in which we perform midstream services and also purchase the natural gas, we determine if economic control of the commodities has passed from the producer to us before or after we perform our services (if at all). Control is assessed on a contract-by-contract basis by analyzing each contract’s provisions, which can include provisions for: the customer to take its residue gas and/or NGLs in-kind; fixed or actual NGL or keep-whole recovery; commodity purchase prices at weighted average sales price or market index-based pricing; and various other contract-specific considerations. Based on this control assessment, our gathering and processing contracts fall into two primary categories:
•For gathering and processing contracts in which there is a commodity purchase and analysis of the contract provisions indicates that control, including the economic benefit, of the natural gas passes to us when the natural gas is brought into our system, we do not consider these contracts to contain performance obligations for our services. As control of the natural gas passes to us prior to performing our gathering and processing services, we are, in effect, performing our services for our own benefit. Based on this control determination, we consider the contractually-stated fees to serve as pricing mechanisms that reduce the cost of such commodity purchased upon receipt of the natural gas, rather than being recorded as midstream services revenue. Upon sale of the residue gas and/or NGLs to a third-party customer, we record product sales revenue at the price at which the commodities are sold, with a corresponding cost of sales equal to the cost of the commodities purchased, net of fees.
•For gathering and processing contracts in which there is a commodity purchase and analysis of the contract provisions indicates that control, including the economic benefit, of the natural gas does not pass to us until after the natural gas has been gathered and processed, we consider these contracts to contain performance obligations for our services. Accordingly, we consider the satisfaction of these performance obligations as revenue-generating, and we recognize the fees received for satisfying these performance obligations as midstream services revenues over time as we satisfy our performance obligations.
For midstream service contracts related to NGL, crude oil, or natural gas gathering and processing in which there is no commodity purchase or control of the commodity never passes to us and we simply earn a fee for our services, we consider these contracts to contain performance obligations for our services. Accordingly, we consider the satisfaction of these performance obligations as revenue-generating, and we recognize the fees received for satisfying these performance obligations as midstream services revenue over time as we satisfy our performance obligations.
ENLINK MIDSTREAM, LLC AND SUBSIDIARIES
Notes to Consolidated Financial Statements (continued)
For our natural gas transmission contracts, we determined that control of the natural gas never transfers to us and we simply earn a fee for our services. Therefore, we recognize these fees as midstream services revenue over time as we satisfy our performance obligations.
We also evaluate our commodity marketing contracts, under which we purchase and sell commodities in connection with our gas, NGL, and crude and condensate midstream services, pursuant to ASC 606, including the principal/agent provisions. For contracts in which we possess control of the commodity and act as principal in the purchase and sale of commodities, we record product sales revenue at the price at which the commodities are sold, with a corresponding cost of sales equal to the cost of the commodities when purchased. For contracts in which we do not possess control of the commodity and are acting as agent, our consolidated statements of operations only reflect midstream services revenues that we earn based on the fees contained in the applicable contract.
Satisfaction of Performance Obligations and Recognition of Revenue
For our commodity sales contracts, we satisfy our performance obligations at the point in time at which the commodity transfers from us to the customer. This transfer pattern aligns with our billing methodology. Therefore, we recognize product sales revenue at the time the commodity is delivered and in the amount to which we have the right to invoice the customer. For our midstream service contracts that contain revenue-generating performance obligations, we satisfy our performance obligations over time as we perform the midstream service and as the customer receives the benefit of these services over the term of the contract. We recognize revenue in the amount to which the entity has a right to invoice, since we have a right to consideration from our customer in an amount that corresponds directly with the value to the customer of our performance completed to date. Accordingly, we continue to recognize revenue over time as our midstream services are performed.
We generally accrue one month of sales and the related natural gas, NGL, condensate, and crude oil purchases and reverse these accruals when the sales and purchases are invoiced and recorded in the subsequent month. Actual results could differ from the accrual estimates. We typically receive payment for invoiced amounts within one month, depending on the terms of the contract. Prior to issuing our financial statements, we review our revenue and purchases estimates based on available information to determine if adjustments are required. We account for taxes collected from customers attributable to revenue transactions and remitted to government authorities on a net basis (excluded from revenues).
Minimum Volume Commitments and Firm Transportation Contracts
The following table summarizes the contractually committed fees (in millions) that we expect to recognize in our consolidated statements of operations, in either revenue or reductions to cost of sales, from MVC and firm transportation contractual provisions. Under these agreements, our customers or suppliers agree to transport or process a minimum volume of commodities on our system over an agreed period. If a customer or supplier fails to meet the minimum volume specified in such agreement, the customer or supplier is obligated to pay a contractually determined fee based upon the shortfall between actual volumes and the contractually stated volumes. All amounts in the table below are determined using the contractually-stated MVC or firm transportation volumes specified for each period multiplied by the relevant deficiency or reservation fee. Actual amounts could differ due to the timing of revenue recognition or reductions to cost of sales resulting from make-up right provisions included in our agreements, as well as due to nonpayment or nonperformance by our customers. We record revenue under MVC and firm transportation contracts during periods of shortfall when it is known that the customer cannot, or will not, make up the deficiency. These fees do not represent the shortfall amounts we expect to collect under our MVC and firm
ENLINK MIDSTREAM, LLC AND SUBSIDIARIES
Notes to Consolidated Financial Statements (continued)
transportation contracts, as we generally do not expect volume shortfalls to equal the full amount of the contractual MVCs and firm transportation contracts during these periods.
| | | | | |
| Contractually Committed Fees | Commitments |
| 2022 | $ | 138.8 | |
| 2023 | 126.5 | |
| 2024 | 108.9 | |
| 2025 | 63.8 | |
| 2026 | 57.8 | |
| Thereafter | 289.6 | |
| Total | $ | 785.4 | |
(d)Acquisition of Business
On April 30, 2021, we completed the acquisition of Amarillo Rattler, LLC, the owner of a gathering and processing system located in the Midland Basin. In connection with the purchase, we entered into an amended and restated gas gathering and processing agreement with Diamondback Energy, strengthening our dedicated acreage position with that entity. We acquired the system with an upfront payment of $50.0 million, which was paid with cash-on-hand, with an additional $10.0 million to be paid on April 30, 2022, and contingent consideration capped at $15.0 million and payable between 2024 and 2026 based on Diamondback Energy’s drilling activity above historical levels.
Under the acquisition method of accounting, the acquired assets of Amarillo Rattler, LLC have been recorded at their respective fair values as of the date of the acquisition. Determining the fair value of the assets of Amarillo Ratter, LLC requires judgment and certain assumptions to be made, particularly related to the valuation of acquired customer relationships. The inputs and assumptions related to the customer relationships are categorized as level 3 in the fair value hierarchy. On a historical pro forma basis, our consolidated revenues, net income (loss), total assets, and earnings per unit amounts would not have differed materially had the acquisition been completed on January 1, 2021 rather than April 30, 2021. The following table presents the fair value of the identified assets received and liabilities assumed at the acquisition date (in millions):
| | | | | |
| Consideration | |
| Cash (including working capital payment) | $ | 50.6 | |
| Installment payable | 10.0 | |
| Contingent consideration fair value (1) | 6.9 | |
| Total consideration: | $ | 67.5 | |
| |
| Purchase price allocation | |
| Assets acquired: | |
Current assets (including $1.3 million in cash) | $ | 1.4 | |
| Property and equipment | 16.3 | |
| Intangible assets | 50.6 | |
| Other assets, net (2) | 0.6 | |
| Liabilities assumed: | |
| Current liabilities | (0.8) | |
| Other long-term liabilities (2) | (0.6) | |
| Net assets acquired | $ | 67.5 | |
____________________________
(1)The estimated fair value of the Amarillo Rattler, LLC contingent consideration was calculated in accordance with the fair value guidance contained in ASC 820. There are a number of assumptions and estimates factored into these fair values and actual contingent consideration payments could differ from the estimated fair values.
(2)“Other assets, net” and “Other long-term liabilities” consist of the right-of-use asset and lease liability, respectively, recorded through the acquisition of Amarillo Rattler, LLC.
ENLINK MIDSTREAM, LLC AND SUBSIDIARIES
Notes to Consolidated Financial Statements (continued)
(e)Loss on Secured Term Loan Receivable
In late May 2019, White Star, the counterparty to our $58.0 million second lien secured term loan receivable, filed for reorganization under Chapter 11 of the U.S. Bankruptcy Code. White Star defaulted on its May 2019 installment payment prior to filing for reorganization under Chapter 11 of the U.S. Bankruptcy Code. In November 2019, White Star sold its assets and we did not recover any amounts then owed to us under the second lien secured term loan. As a result, we have recorded a $52.9 million loss in our consolidated statement of operations for the year ended December 31, 2019, which represents a full write-down of the second lien secured term loan.
(f)Gas Imbalance Accounting
Quantities of natural gas and NGLs over-delivered or under-delivered related to imbalance agreements are recorded monthly as receivables or payables using weighted average prices at the time of the imbalance. These imbalances are typically settled with deliveries of natural gas or NGLs. We had imbalance payables of $16.3 million and $6.1 million at December 31, 2021 and 2020, respectively, which approximate the fair value of these imbalances. We had imbalance receivables of $14.5 million and $7.5 million at December 31, 2021 and 2020, respectively, which are carried at the lower of cost or market value. Imbalance receivables and imbalance payables are included in the line items “Accrued revenue and other” and “Accrued gas, NGLs, condensate, and crude oil purchases,” respectively, on the consolidated balance sheets.
(g)Cash and Cash Equivalents
We consider all highly liquid investments with an original maturity of three months or less to be cash equivalents.
(h)Income Taxes
We account for deferred income taxes related to the federal and state jurisdictions using the asset and liability method. Under this method, deferred tax assets and liabilities are recognized for the future tax consequences attributable to differences between the financial statement carrying amounts of assets and liabilities and their respective tax bases. Deferred tax assets are also recognized for the future tax benefits attributable to the expected utilization of existing tax net operating loss carryforwards and other types of carryforwards. If the future utilization of some portion of carryforwards is determined to be unlikely, a valuation allowance is provided to reduce the recorded tax benefits from such assets. Deferred tax assets and liabilities are measured using enacted tax rates expected to apply to taxable income in the years in which those temporary differences and carryforwards are expected to be recovered or settled. The effect on deferred tax assets and liabilities of a change in tax rates is recognized in income in the period that includes the enactment date. In the event interest or penalties are incurred with respect to income tax matters, our policy will be to include such items in income tax expense. We record deferred tax assets and liabilities on a net basis on the consolidated balance sheets, with deferred tax assets included in “Other assets, net” and deferred tax liabilities included in “Deferred tax liability, net.”
(i)Natural Gas, Natural Gas Liquids, Crude Oil, and Condensate Inventory
Our inventories of products consist of natural gas, NGLs, crude oil, and condensate. We report these assets at the lower of cost or market value which is determined by using the first-in, first-out method.
(j)Property and Equipment
Property and equipment are stated at historical cost less accumulated depreciation. Assets acquired in a business combination are recorded at fair value. Routine repairs and maintenance are charged against income when incurred. Renewals and improvements that extend the useful life or improve the function of the properties are capitalized. Interest costs for material projects are capitalized to property and equipment during the period the assets are undergoing preparation for intended use.
ENLINK MIDSTREAM, LLC AND SUBSIDIARIES
Notes to Consolidated Financial Statements (continued)
The components of property and equipment, net of accumulated depreciation are as follows (in millions):
| | | | | | | | | | | |
| Year Ended December 31, |
| 2021 | | 2020 |
| Transmission assets | $ | 1,442.2 | | | $ | 1,410.5 | |
| Gathering systems | 4,903.8 | | | 4,782.9 | |
| Gas processing plants | 4,119.1 | | | 4,082.1 | |
| Other property and equipment | 161.0 | | | 161.0 | |
| Construction in process | 94.2 | | | 78.6 | |
| Property and equipment | 10,720.3 | | | 10,515.1 | |
| Accumulated depreciation | (4,332.0) | | | (3,863.0) | |
| Property and equipment, net of accumulated depreciation | $ | 6,388.3 | | | $ | 6,652.1 | |
Depreciation Expense. Depreciation is calculated using the straight-line method based on the estimated useful life of each asset, as follows:
| | | | | |
| Useful Lives |
| Transmission assets | 20 - 25 years |
| Gathering systems | 20 - 25 years |
| Gas processing plants | 20 - 25 years |
| Other property and equipment | 3 - 25 years |
Gain or Loss on Disposition. Upon the disposition or retirement of property and equipment, any gain or loss is recognized in operating income in the consolidated statements of operations. For the years ended December 31, 2021, 2020, and 2019, dispositions primarily related to the sale of certain non-core assets. The (gain) loss on disposition of assets are as follows (in millions):
| | | | | | | | | | | | | | | | | |
| Year Ended December 31, |
| 2021 | | 2020 | | 2019 |
| Net book value of assets disposed | $ | 3.3 | | | $ | 36.4 | | | $ | 12.4 | |
| | | | | |
| Less: | | | | | |
| Proceeds from sales | (4.8) | | | (27.6) | | | (14.3) | |
| (Gain) loss on disposition of assets | $ | (1.5) | | | $ | 8.8 | | | $ | (1.9) | |
Impairment Review. In accordance with ASC 360, Property, Plant, and Equipment, we evaluate long-lived assets of identifiable business activities for potential impairment whenever events or changes in circumstances, or triggering events, indicate that their carrying value may not be recoverable. Triggering events include, but are not limited to, significant changes in the use of the asset group, current operating results that are significantly less than forecasted results, negative industry or economic trends including changes in commodity prices, significant adverse changes in legal or regulatory factors, or an expectation that it is more likely than not that an asset group will be sold before the end of its useful life. The carrying amount of a long-lived asset is not recoverable when it exceeds the undiscounted sum of the future cash flows expected to result from the use and eventual disposition of the asset. Estimates of expected future cash flows represent management’s best estimate based on reasonable and supportable assumptions. When the carrying amount of a long-lived asset is not recoverable, an impairment is recognized equal to the excess of the asset’s carrying value over its fair value, which is based on inputs that are not observable in the market, and thus represent Level 3 inputs.
ENLINK MIDSTREAM, LLC AND SUBSIDIARIES
Notes to Consolidated Financial Statements (continued)
When determining whether impairment of our long-lived assets has occurred, we must estimate the undiscounted cash flows attributable to the asset. Our estimate of cash flows is based on assumptions regarding:
•the future fee-based rate of new business or contract renewals;
•the purchase and resale margins on natural gas, NGLs, crude oil, and condensate;
•the volume of natural gas, NGLs, crude oil, and condensate available to the asset;
•markets available to the asset;
•operating expenses; and
•future natural gas, NGLs, crude oil, and condensate prices.
The amount of availability of natural gas, NGLs, crude oil, and condensate to an asset is sometimes based on assumptions regarding future drilling activity, which may be dependent in part on natural gas, NGL, crude oil, and condensate prices. Projections of natural gas, NGL, crude oil, and condensate volumes and future commodity prices are inherently subjective and contingent upon a number of variable factors, including but not limited to:
•changes in general economic conditions in regions in which our markets are located;
•the availability and prices of natural gas, NGLs, crude oil, and condensate supply;
•our ability to negotiate favorable sales agreements;
•the risks that natural gas, NGLs, crude oil, and condensate exploration and production activities will not occur or be successful;
•our dependence on certain significant customers, producers, and transporters of natural gas, NGLs, crude oil, and condensate; and
•competition from other midstream companies, including major energy companies.
For the year ended December 31, 2021, we recognized a $0.6 million impairment on property and equipment.
For the year ended December 31, 2020, we recognized a $168.0 million impairment on property and equipment related to a portion of our Louisiana reporting segment because the carrying amounts were not recoverable based on our expected future cash flows, and $3.4 million of impairments related to certain cancelled projects.
For the year ended December 31, 2019, we recognized a $7.9 million impairment on property and equipment related to certain decommissioned and removed non-core assets.
(k)Comprehensive Income (Loss)
Comprehensive income (loss) is comprised of net income (loss) and the effective portion of gains or losses on derivative financial instruments that qualify as cash flow hedges pursuant to ASC 815. For additional information about the effect of financial instruments on comprehensive income (loss), see “Note 12—Derivatives.”
(l)Equity Method of Accounting
We account for investments where we do not control the investment but have the ability to exercise significant influence using the equity method of accounting. Under this method, unconsolidated affiliate investments are initially carried at the acquisition cost, increased by our proportionate share of the investee’s net income and by contributions made, and decreased by our proportionate share of the investee’s net losses and by distributions received.
We evaluate our unconsolidated affiliate investments for potential impairment whenever events or changes in circumstances indicate that the carrying amount of the investments may not be recoverable. We recognize impairments of our investments as a loss from unconsolidated affiliates on our consolidated statements of operations.
We recognized a $31.4 million loss for the year ended December 31, 2019 related to the impairment of the carrying value of the Cedar Cove JV, as we determined that the carrying value of our investment was not recoverable based on the forecasted cash flows from the Cedar Cove JV.
For additional information, see “Note 10—Investment in Unconsolidated Affiliates.”
ENLINK MIDSTREAM, LLC AND SUBSIDIARIES
Notes to Consolidated Financial Statements (continued)
(m)Non-controlling Interests
We account for investments where we control the investment using the consolidation method of accounting. Under this method, we consolidate all the assets and liabilities of an investment on our consolidated balance sheets and record non-controlling interest for the portion of the investment that we do not own. We include all of an investment’s results of operations on our consolidated statements of operations and record income attributable to non-controlling interests for the portion of the investment that we do not own.
Our non-controlling interests for the years ended December 31, 2021, 2020, and 2019 relate to the Series B Preferred Units, the Series C Preferred Units, NGP’s 49.9% ownership of the Delaware Basin JV, and Marathon Petroleum Corporation’s 50.0% ownership interest in the Ascension JV. For periods prior to the Merger, our non-controlling interests also included ENLK’s public common unitholders.
(n)Goodwill
Goodwill is the cost of an acquisition less the fair value of the net identifiable assets of the acquired business. We evaluated goodwill for impairment annually as of October 31 and whenever events or changes in circumstances indicated it was more likely than not that the fair value of a reporting unit is less than its carrying amount. For additional information regarding our previous assessments of goodwill for impairment, see “Note 3—Goodwill and Intangible Assets.”
(o)Intangible Assets
Intangible assets associated with customer relationships are amortized on a straight-line basis over the expected period of benefits of the customer relationships, which range from ten to twenty years. In accordance with ASC 350, Intangibles—Goodwill and Other, we evaluate intangibles for potential impairment whenever events or changes in circumstances indicate that their carrying value may not be recoverable. For additional information regarding our intangible assets, including our assessment of intangible assets for impairment, see “Note 3—Goodwill and Intangible Assets.”
(p)Asset Retirement Obligations
We recognize liabilities for retirement obligations associated with our pipelines and processing and fractionation facilities. Such liabilities are recognized when there is a legal obligation associated with the retirement of the assets and the amount can be reasonably estimated. The initial measurement of an asset retirement obligation is recorded as a liability at its fair value, with an offsetting asset retirement cost recorded as an increase to the associated property and equipment. If the fair value of a recorded asset retirement obligation changes, a revision is recorded to both the asset retirement obligation and the asset retirement cost. Our retirement obligations include estimated environmental remediation costs that arise from normal operations and are associated with the retirement of the long-lived assets. The asset retirement cost is depreciated using the straight-line depreciation method similar to that used for the associated property and equipment.
(q)Leases
Effective January 1, 2019, we adopted ASC 842 using the modified retrospective approach whereby we recognized leases on our consolidated balance sheet by recording a right-of-use asset and lease liability. We applied certain practical expedients that were allowed in the adoption of ASC 842, including not reassessing existing contracts for lease arrangements, not reassessing existing lease classification, not recording a right-of-use asset or lease liability for leases of twelve months or less, and not separating lease and non-lease components of a lease arrangement.
We evaluate new contracts at inception to determine if the contract conveys the right to control the use of an identified asset for a period of time in exchange for periodic payments. A lease exists if we obtain substantially all of the economic benefits of an asset, and we have the right to direct the use of that asset. When a lease exists, we record a right-of-use asset that represents our right to use the asset over the lease term and a lease liability that represents our obligation to make payments over the lease term. Lease liabilities are recorded at the sum of future lease payments discounted by the collateralized rate we could obtain to lease a similar asset over a similar period, and right-of-use assets are recorded equal to the corresponding lease liability, plus any prepaid or direct costs incurred to enter the lease, less the cost of any incentives received from the lessor. For more information, see “Note 5—Leases.”
ENLINK MIDSTREAM, LLC AND SUBSIDIARIES
Notes to Consolidated Financial Statements (continued)
(r)Derivatives
We use derivative instruments to hedge against changes in cash flows related to product price. We generally determine the fair value of swap contracts based on the difference between the derivative’s fixed contract price and the underlying market price at the determination date. The asset or liability related to the derivative instruments is recorded on the balance sheet at the fair value of derivative assets or liabilities in accordance with ASC 815. Changes in fair value of derivative instruments are recorded in gain or loss on derivative activity in the period of change.
Realized gains and losses on commodity-related derivatives are recorded as gain or loss on derivative activity within revenues in the consolidated statements of operations in the period incurred. Settlements of derivatives are included in cash flows from operating activities.
We periodically enter into interest rate swaps in connection with new debt issuances to hedge variability in interest rates and effectively lock in the benchmark interest rate at the inception of the swap.
In April 2019, we entered into $850.0 million of interest rate swaps to manage the interest rate risk associated with our floating-rate, LIBOR-based borrowings. Under this arrangement, we paid a fixed interest rate of 2.28% in exchange for LIBOR-based variable interest through December 2021. These interest rate swaps expired on December 10, 2021. There was no ineffectiveness related to this hedge.
During 2021 and 2020, we terminated the interest rate swaps in several increments in connection with repayments of the Term Loan, which was one of our floating-rate, LIBOR-based borrowings. The following table presents the interest rate swaps terminations and the associated cash payments during 2021 and 2020 (in millions):
| | | | | | | | | | | |
| Interest Rate Swaps Terminations | | Cash Payments Associated with Interest Rate Swaps Terminations |
| December 2021 | $ | 150.0 | | | $ | — | |
| September 2021 | 100.0 | | | 0.5 | |
| May 2021 | 100.0 | | | 1.3 | |
| December 2020 | 500.0 | | | 10.9 | |
| Total termination of interest rate swaps | $ | 850.0 | | | $ | 12.7 | |
For additional information, see “Note 12—Derivatives.”
(s)Concentrations of Credit Risk
Financial instruments, which potentially subject us to concentrations of credit risk, consist primarily of trade accounts receivable and commodity financial instruments. Management believes the risk is limited, other than our exposure to significant customers discussed below, since our customers represent a broad and diverse group of energy marketers and end users.
The following customers individually represented greater than 10% of our consolidated revenues during 2021, 2020, or 2019. These customers represented a significant percentage of our consolidated revenues, and the loss of these customers would have a material adverse impact on our results of operations because the revenues and adjusted gross margin received from transactions with these customers is material to us. No other customers represented greater than 10% of our consolidated revenues during the periods presented.
| | | | | | | | | | | | | | | | | |
| Year Ended December 31, |
| 2021 | | 2020 | | 2019 |
| Devon | 6.7 | % | | 14.4 | % | | 10.5 | % |
| Dow Hydrocarbons and Resources LLC | 14.5 | % | | 13.2 | % | | 10.0 | % |
| Marathon Petroleum Corporation | 13.4 | % | | 12.2 | % | | 13.8 | % |
ENLINK MIDSTREAM, LLC AND SUBSIDIARIES
Notes to Consolidated Financial Statements (continued)
We continually monitor and review the credit exposure of our counter-parties based on various credit quality indicators and metrics. We obtain letters of credit or other appropriate security when considered necessary to limit the risk of loss. We record reserves for uncollectible accounts on a specific identification basis since there is not a large volume of late paying customers and we do not expect to experience significant levels of default on our trade accounts receivable. As of December 31, 2021 and 2020, we had a reserve for uncollectible receivables of $0.3 million and $0.5 million, respectively.
(t)Environmental Costs
Environmental expenditures are expensed or capitalized depending on the nature of the expenditures and the future economic benefit. Expenditures that relate to an existing condition caused by past operations that do not contribute to current or future revenue generation are expensed. Liabilities for these expenditures are recorded on an undiscounted basis (or a discounted basis when the obligation can be settled at fixed and determinable amounts) when environmental assessments or clean-ups are probable and the costs can be reasonably estimated. Environmental expenditures were not material for the years ended December 31, 2021, 2020, and 2019.
(u)Unit-Based Awards
We recognize compensation cost related to all unit-based awards in our consolidated financial statements in accordance with ASC 718. Unit-based compensation associated with ENLC’s unit-based compensation plan awarded to directors, officers, and employees of the General Partner is recorded by ENLK since ENLC has no substantial or managed operating activities other than its interests in ENLK. For additional information, see “Note 11—Employee Incentive Plans.”
(v)Commitments and Contingencies
Liabilities for loss contingencies arising from claims, assessments, litigation, or other sources are recorded when it is probable that a liability has been incurred and the amount can be reasonably estimated. Legal costs incurred in connection with a loss contingency are expensed as incurred. For additional information, see “Note 14—Commitments and Contingencies.”
(w)Debt Issuance Costs
Costs incurred in connection with the issuance of long-term debt are deferred and amortized into interest expense using the straight-line method over the term of the related debt. Gains or losses on debt repurchases, redemptions, and debt extinguishments include any associated unamortized debt issue costs. Unamortized debt issuance costs totaling $27.8 million and $32.6 million as of December 31, 2021 and 2020, respectively, are included in “Long-term debt” or “Current maturities of long-term debt,” as applicable, on the consolidated balance sheets as a direct reduction from the carrying amount of the debt.
(x)Redeemable Non-Controlling Interest
Non-controlling interests that contain an option for the non-controlling interest holder to require us to purchase such interests for cash are considered to be redeemable non-controlling interests because the redemption feature is not deemed to be a freestanding financial instrument and because the redemption is not solely within our control. Redeemable non-controlling interests are not considered to be a component of members’ equity and are reported as temporary equity in the mezzanine section on the consolidated balance sheets. The amount recorded as redeemable non-controlling interest at each balance sheet date is the greater of the redemption value and the carrying value of the redeemable non-controlling interest (the initial carrying value increased or decreased for the non-controlling interest holder’s share of net income or loss and distributions). When the redemption feature is exercised the redemption value of the non-controlling interest is reclassified to a liability on the consolidated balance sheets.
During the first quarter of 2020, the non-controlling interest holder in one of our non-wholly owned subsidiaries exercised its option to require us to purchase its remaining interest. We have recorded an estimated $4.0 million related to the redemption of the non-controlling interest included in “Other current liabilities” on the consolidated balance sheets as of December 31, 2021 and 2020, but we have not yet agreed to a redemption value with the non-controlling interest holder.
ENLINK MIDSTREAM, LLC AND SUBSIDIARIES
Notes to Consolidated Financial Statements (continued)
(3) Goodwill and Intangible Assets
Goodwill Impairments
Goodwill Impairment Analysis for the Year Ended December 31, 2020
During the first quarter of 2020, we determined that a sustained decline in our unit price and weakness in the overall energy sector, driven by low commodity prices and lower consumer demand due to the COVID-19 pandemic, caused a change in circumstances warranting an interim impairment test. Based on these triggering events, we performed a quantitative goodwill impairment analysis on the remaining goodwill in the Permian reporting unit. Based on this analysis, a goodwill impairment loss for our Permian reporting unit in the amount of $184.6 million was recognized as an impairment loss on the consolidated statement of operations for the year ended December 31, 2020. As a result of this impairment loss, we have no goodwill remaining as of December 31, 2020.
Goodwill Impairment Analysis for the Year Ended December 31, 2019
During the first quarter of 2019, we recognized a $186.5 million goodwill impairment related to goodwill that had been reallocated from our Corporate reporting unit to our Louisiana reporting unit as a result of the Merger.
During the fourth quarter of 2019, we performed a quantitative analysis as of October 31, 2019 for our annual goodwill impairment test. Subsequent to October 31, 2019, we determined that due to a significant decline in our common unit price and the expected reduction in our cash distribution paid to common unitholders, which was announced in January 2020, a change in circumstances had occurred that warranted an additional quantitative impairment test. We recorded a goodwill impairment loss of $125.7 million and $813.4 million in our North Texas and Oklahoma reporting units, respectively. These amounts are
included in impairments in the consolidated statement of operations for the year ended December 31, 2019. The goodwill for our North Texas and Oklahoma reporting units primarily related to the goodwill reallocated from our Corporate reporting unit as a result of the Merger in January 2019.
ENLINK MIDSTREAM, LLC AND SUBSIDIARIES
Notes to Consolidated Financial Statements (continued)
Intangible Assets
Intangible assets associated with customer relationships are amortized on a straight-line basis over the expected period of benefits of the customer relationships, which range from 10 to 20 years. The weighted average amortization period for intangible assets is 14.9 years.
The following table represents our change in carrying value of intangible assets for the periods stated (in millions):
| | | | | | | | | | | | | | | | | |
| Gross Carrying Amount | | Accumulated Amortization | | Net Carrying Amount |
| Year Ended December 31, 2021 | | | | | |
| Customer relationships, beginning of period | $ | 1,794.2 | | | $ | (668.8) | | | $ | 1,125.4 | |
| Customer relationships obtained from acquisition of business | 50.6 | | | — | | | 50.6 | |
| Amortization expense | — | | | (126.3) | | | (126.3) | |
| Customer relationships, end of period | $ | 1,844.8 | | | $ | (795.1) | | | $ | 1,049.7 | |
| | | | | |
| Year Ended December 31, 2020 | | | | | |
| Customer relationships, beginning of period | $ | 1,795.8 | | | $ | (545.9) | | | $ | 1,249.9 | |
| Amortization expense | — | | | (123.5) | | | (123.5) | |
| Retirements (1) | (1.6) | | | 0.6 | | | (1.0) | |
| Customer relationships, end of period | $ | 1,794.2 | | | $ | (668.8) | | | $ | 1,125.4 | |
| | | | | |
| Year Ended December 31, 2019 | | | | | |
| Customer relationships, beginning of period | $ | 1,795.8 | | | $ | (422.2) | | | $ | 1,373.6 | |
| Amortization expense | — | | | (123.7) | | | (123.7) | |
| Customer relationships, end of period | $ | 1,795.8 | | | $ | (545.9) | | | $ | 1,249.9 | |
____________________________
(1)Intangible assets retired as a result of the disposition of certain non-core assets.
The following table summarizes our estimated aggregate amortization expense for the next five years and thereafter (in millions):
| | | | | |
| 2022 | $ | 127.6 | |
| 2023 | 127.6 | |
| 2024 | 127.6 | |
| 2025 | 110.3 | |
| 2026 | 106.4 | |
| Thereafter | 450.2 | |
| Total | $ | 1,049.7 | |
(4) Related Party Transactions
(a)Transactions with Cedar Cove JV
For the years ended December 31, 2021, 2020, and 2019, we recorded cost of sales of $17.9 million, $8.7 million, $21.7 million, respectively, related to our purchase of residue gas and NGLs from the Cedar Cove JV subsequent to processing at our Central Oklahoma processing facilities. Additionally, we had accounts payable balances related to transactions with the Cedar Cove JV of $1.6 million and $1.0 million at December 31, 2021 and 2020, respectively.
ENLINK MIDSTREAM, LLC AND SUBSIDIARIES
Notes to Consolidated Financial Statements (continued)
(b)Transactions with GIP
For the years ended December 31, 2021 and 2020, we recorded general and administrative expenses of $0.5 million and $0.2 million, respectively, related to personnel secondment services provided by GIP. We did not record any expenses related to transactions with GIP for the year ended December 31, 2019.
(c)Transactions with ENLK
On January 25, 2019, we completed the Merger, an internal reorganization pursuant to which ENLC owns all of the outstanding common units of ENLK. See “Note 1—Organization and Nature of Business” for more information on the Merger and related transactions.
Management believes the foregoing transactions with related parties were executed on terms that are fair and reasonable to us. The amounts related to related party transactions are specified in the accompanying consolidated financial statements.
(5) Leases
The majority of our leases are for the following types of assets:
•Office space. Our primary offices are in Dallas, Houston, and Midland, with smaller offices in other locations near our assets. Our office leases are long-term in nature and represent $51.8 million of our lease liability and $27.9 million of our right-of-use asset as of December 31, 2021. Our office leases represented $57.6 million of our lease liability and $32.4 million of our right-of-use asset as of December 31, 2020. These office leases typically include variable lease costs related to utility expenses, which are determined based on our pro-rata share of the building expenses each month and expensed as incurred.
•Compression and other field equipment. We pay third parties to provide compressors or other field equipment for our assets. Under these agreements, a third party installs and operates compressor units based on specifications set by us to meet our compression needs at specific locations. While the third party determines which compressors to install and operates and maintains the units, we have the right to control the use of the compressors and are the sole economic beneficiary of the identified assets. These agreements are typically for an initial term of one to three years but will automatically renew from month to month until canceled by us or the lessor. Compression and other field equipment rentals represent $17.7 million of our lease liability and $19.5 million of our right-of-use asset as of December 31, 2021. Compression and other field equipment rentals represented $14.6 million of our lease liability and $14.6 million of our right-of-use asset as of December 31, 2020. Under certain agreements, we may incur variable lease costs related to incidental services provided by the equipment lessor, which are expensed as incurred.
•Land and land easements. We make periodic payments to lease land or to have access to our assets. Land leases and easements are typically long-term to match the expected useful life of the corresponding asset and represent $15.6 million of our lease liability and $12.6 million of our right-of-use asset as of December 31, 2021. Land and land easement leases represented $15.1 million of our lease liability and $12.5 million of our right-of-use asset as of December 31, 2020.
•Other. We rent office equipment and other items that represent $0.1 million of our lease liability and $0.1 million of our right-of-use asset as of December 31, 2021. Office equipment and other items represented $0.3 million of our lease liability and $0.3 million of our right-of-use asset as of December 31, 2020.
ENLINK MIDSTREAM, LLC AND SUBSIDIARIES
Notes to Consolidated Financial Statements (continued)
Lease balances are recorded on the consolidated balance sheets as follows (in millions):
| | | | | | | | | | | | | | |
| Operating leases: | | December 31, 2021 | | December 31, 2020 |
| Other assets, net | | $ | 60.1 | | | $ | 59.8 | |
| Other current liabilities | | $ | 18.1 | | | $ | 16.3 | |
| Other long-term liabilities | | $ | 67.1 | | | $ | 71.3 | |
| | | | |
| Other lease information | | | | |
| Weighted-average remaining lease term—Operating leases | | 10.3 years | | 11.1 years |
| Weighted-average discount rate—Operating leases | | 4.9 | % | | 5.1 | % |
Certain of our lease agreements have options to extend the lease for a certain period after the expiration of the initial term. We recognize the cost of a lease over the expected total term of the lease, including optional renewal periods that we can reasonably expect to exercise. We do not have material obligations whereby we guarantee a residual value on assets we lease, nor do our lease agreements impose restrictions or covenants that could affect our ability to make distributions.
Lease expense is recognized on the consolidated statements of operations as “Operating expenses” and “General and administrative” depending on the nature of the leased asset. Impairments of right-of-use assets are recognized in “Impairments” on the consolidated statements of operations. The components of total lease expense are as follows (in millions):
| | | | | | | | | | | | | | | | | |
| Year Ended December 31, |
| 2021 | | 2020 | | 2019 |
| Finance lease expense: | | | | | |
| Amortization of right-of-use asset | $ | — | | | $ | — | | | $ | 5.2 | |
| Interest on lease liability | — | | | — | | | 0.1 | |
| Operating lease expense: | | | | | |
| Long-term operating lease expense | 21.7 | | | 23.1 | | | 28.7 | |
| Short-term lease expense | 17.5 | | | 22.1 | | | 32.0 | |
| Variable lease expense | 15.6 | | | 11.8 | | | 7.7 | |
| Impairments | 0.2 | | | 6.8 | | | — | |
| Total lease expense | $ | 55.0 | | | $ | 63.8 | | | $ | 68.4 | |
Impairments
Right-of-Use Asset Impairment Analysis for the Year Ended December 31, 2021
During the fourth quarter of 2021, we entered into a sublease agreement for a portion of our Houston office that will be effective in 2022. We evaluated the related right-of-use asset for impairment by comparing the estimated fair value of the right-of-use asset to its carrying value. The estimated fair value was calculated using a discounted cash flow analysis that utilized Level 3 inputs, which included future cash flows based on the terms of the sublease and a discount rate derived from market data. As the carrying value of the right-of-use asset exceeded the estimated fair value, we have recognized impairment expense of $0.2 million for the year ended December 31, 2021.
ENLINK MIDSTREAM, LLC AND SUBSIDIARIES
Notes to Consolidated Financial Statements (continued)
Right-of-Use Asset Impairment Analysis for the Year Ended December 31, 2020
During the fourth quarter of 2020, we determined that we would cease using a portion of our Dallas, Houston, and Midland offices. We are attempting to sublease the vacated space; however, as we believe the terms of a sublease would be below our current rental rates, we evaluated the related right-of-use assets for impairment by comparing the estimated fair values of the right-of-use assets to their carrying values. Estimated fair values were calculated using a discounted cash flow analysis that utilized Level 3 inputs, which included estimated future cash flows and a discount rate derived from market data. As the carrying value of each right-of-use asset exceeded its estimated fair value, we recognized impairment expense of $6.8 million for the year ended December 31, 2020.
Lease Maturities
The following table summarizes the maturity of our lease liability as of December 31, 2021 (in millions):
| | | | | | | | | | | | | | | | | | | | | | | | | | | | | | | | | | | | | | | | | |
| Total | | 2022 | | 2023 | | 2024 | | 2025 | | 2026 | | Thereafter |
| Undiscounted operating lease liability | $ | 115.6 | | | $ | 21.1 | | | $ | 15.3 | | | $ | 10.1 | | | $ | 9.8 | | | $ | 8.9 | | | $ | 50.4 | |
| Reduction due to present value | (30.4) | | | (3.7) | | | (3.2) | | | (2.8) | | | (2.4) | | | (2.0) | | | (16.3) | |
| Operating lease liability | $ | 85.2 | | | $ | 17.4 | | | $ | 12.1 | | | $ | 7.3 | | | $ | 7.4 | | | $ | 6.9 | | | $ | 34.1 | |
| | | | | | | | | | | | | |
(6) Long-Term Debt
As of December 31, 2021 and 2020, long-term debt consisted of the following (in millions):
| | | | | | | | | | | | | | | | | | | | | | | | | | | | | | | | | | | |
| December 31, 2021 | | December 31, 2020 |
| Outstanding Principal | | Premium (Discount) | | Long-Term Debt | | Outstanding Principal | | Premium (Discount) | | Long-Term Debt |
| Term Loan due 2021 (1) | $ | — | | | $ | — | | | $ | — | | | $ | 350.0 | | | $ | — | | | $ | 350.0 | |
| Consolidated Credit Facility due 2024 (2) | 15.0 | | | — | | | 15.0 | | | — | | | — | | | — | |
| AR Facility due 2024 (3) | 350.0 | | | — | | | 350.0 | | | 250.0 | | | — | | | 250.0 | |
ENLK’s 4.40% Senior unsecured notes due 2024 | 521.8 | | | 0.7 | | | 522.5 | | | 521.8 | | | 1.1 | | | 522.9 | |
ENLK’s 4.15% Senior unsecured notes due 2025 | 720.8 | | | (0.4) | | | 720.4 | | | 720.8 | | | (0.6) | | | 720.2 | |
ENLK’s 4.85% Senior unsecured notes due 2026 | 491.0 | | | (0.3) | | | 490.7 | | | 491.0 | | | (0.4) | | | 490.6 | |
ENLC’s 5.625% Senior unsecured notes due 2028 | 500.0 | | | — | | | 500.0 | | | 500.0 | | | — | | | 500.0 | |
ENLC’s 5.375% Senior unsecured notes due 2029 | 498.7 | | | — | | | 498.7 | | | 498.7 | | | — | | | 498.7 | |
ENLK’s 5.60% Senior unsecured notes due 2044 | 350.0 | | | (0.2) | | | 349.8 | | | 350.0 | | | (0.2) | | | 349.8 | |
ENLK’s 5.05% Senior unsecured notes due 2045 | 450.0 | | | (5.5) | | | 444.5 | | | 450.0 | | | (5.7) | | | 444.3 | |
ENLK’s 5.45% Senior unsecured notes due 2047 | 500.0 | | | (0.1) | | | 499.9 | | | 500.0 | | | (0.1) | | | 499.9 | |
| Debt classified as long-term | $ | 4,397.3 | | | $ | (5.8) | | | 4,391.5 | | | $ | 4,632.3 | | | $ | (5.9) | | | 4,626.4 | |
| Debt issuance costs (4) | | | | | (27.8) | | | | | | | (32.6) | |
| Less: Current maturities of long-term debt (1) | | | | | — | | | | | | | (349.8) | |
| Long-term debt, net of unamortized issuance cost | | | | | $ | 4,363.7 | | | | | | | $ | 4,244.0 | |
____________________________
(1)Bore interest prior to its maturity based on Prime and/or LIBOR plus an applicable margin. The effective interest rate was 1.7% at December 31, 2020. The Term Loan was repaid at maturity on December 10, 2021. The outstanding principal balance, net of debt issuance costs, was classified as “Current maturities of long-term debt” on the consolidated balance sheet as of December 31, 2020.
(2)Bears interest based on Prime and/or LIBOR plus an applicable margin. The effective interest rate was 3.9% at December 31, 2021.
(3)Bears interest based on LMIR and/or LIBOR plus an applicable margin. The effective interest rate was 1.2% and 2.0% at December 31, 2021 and 2020, respectively.
(4)Net of accumulated amortization of $18.4 million and $14.1 million at December 31, 2021 and 2020, respectively.
ENLINK MIDSTREAM, LLC AND SUBSIDIARIES
Notes to Consolidated Financial Statements (continued)
Maturities
Maturities for the long-term debt as of December 31, 2021 are as follows (in millions):
| | | | | |
| 2022 | $ | — | |
| 2023 | — | |
| 2024 | 886.8 | |
| 2025 | 720.8 | |
| 2026 | 491.0 | |
| Thereafter | 2,298.7 | |
| Subtotal | 4,397.3 | |
| Less: net discount | (5.8) | |
| Less: debt issuance cost | (27.8) | |
| Long-term debt, net of unamortized issuance cost | $ | 4,363.7 | |
Term Loan
On December 11, 2018, ENLK entered into the Term Loan with Bank of America, N.A., as Administrative Agent, Bank of Montreal and Royal Bank of Canada, as Co-Syndication Agents, Citibank, N.A. and Wells Fargo Bank, National Association, as Co-Documentation Agents, and the lenders party thereto. In December 2020, May 2021, and September 2021, we repaid $500.0 million, $100.0 million, and $100.0 million, respectively, of the borrowings under the Term Loan. The remaining $150.0 million of the Term Loan was repaid at maturity on December 10, 2021.
Consolidated Credit Facility
The Consolidated Credit Facility permits ENLC to borrow up to $1.75 billion on a revolving credit basis and includes a $500.0 million letter of credit subfacility. The Consolidated Credit Facility became available for borrowings and letters of credit upon closing of the Merger. In addition, ENLK became a guarantor under the Consolidated Credit Facility upon the closing of the Merger. In the event that ENLC’s obligations under the Consolidated Credit Facility are accelerated due to a default, ENLK will be liable for the entire outstanding balance and 105% of the outstanding letters of credit under the Consolidated Credit Facility. There was $15.0 million in outstanding borrowings under the Consolidated Credit Facility and $41.3 million outstanding letters of credit as of December 31, 2021.
The Consolidated Credit Facility will mature on January 25, 2024, unless ENLC requests, and the requisite lenders agree, to extend it pursuant to its terms. The Consolidated Credit Facility contains certain financial, operational, and legal covenants. The financial covenants are tested on a quarterly basis, based on the rolling four-quarter period that ends on the last day of each fiscal quarter. The financial covenants include (i) maintaining a ratio of consolidated EBITDA (as defined in the Consolidated Credit Facility, which term includes projected EBITDA from certain capital expansion projects) to consolidated interest charges of no less than 2.5 to 1.0 at all times prior to the occurrence of an investment grade event (as defined in the Consolidated Credit Facility) and (ii) maintaining a ratio of consolidated indebtedness to consolidated EBITDA of no more than 5.0 to 1.0.
Under the terms of the Consolidated Credit Facility, if we consummate an acquisition in which the aggregate purchase price is $50.0 million or more, we can elect to increase the maximum allowed ratio of consolidated indebtedness to consolidated EBITDA to 5.5 to 1.0 for the quarter in which the acquisition occurs and the three subsequent quarters. In April 2021, we completed the acquisition of Amarillo Rattler, LLC with an aggregate purchase price in excess of $50.0 million and elected to increase the maximum allowed ratio of consolidated indebtedness to consolidated EBITDA to 5.5 to 1.0 through the first quarter of 2022.
Borrowings under the Consolidated Credit Facility bear interest at ENLC’s option at the Eurodollar Rate (LIBOR) plus an applicable margin (ranging from 1.125% to 2.00%) or the Base Rate (the highest of the Federal Funds Rate plus 0.50%, the 30-day Eurodollar Rate plus 1.0% or the administrative agent’s prime rate) plus an applicable margin (ranging from 0.125%
to 1.00%). The applicable margins vary depending on ENLC’s debt rating. Upon breach by ENLC of certain covenants governing the Consolidated Credit Facility, amounts outstanding under the Consolidated Credit Facility, if any, may become due and payable immediately.
ENLINK MIDSTREAM, LLC AND SUBSIDIARIES
Notes to Consolidated Financial Statements (continued)
At December 31, 2021, we were in compliance with and expect to be in compliance with the financial covenants of the Consolidated Credit Facility for at least the next twelve months.
AR Facility
On October 21, 2020, EnLink Midstream Funding, LLC, a bankruptcy-remote special purpose entity that is an indirect subsidiary of ENLC (the “SPV”) entered into the AR Facility to borrow up to $250.0 million. In connection with the AR Facility, certain subsidiaries of ENLC sold and contributed, and will continue to sell or contribute, their accounts receivable to the SPV to be held as collateral for borrowings under the AR Facility. The SPV’s assets are not available to satisfy the obligations of ENLC or any of its affiliates.
On February 26, 2021, the SPV entered into the first amendment to the AR Facility that, among other things: (i) increased the AR Facility limit and lender commitments by $50.0 million to $300.0 million, (ii) reduced the Adjusted LIBOR and LMIR (each as defined in the AR Facility) minimum floor to zero, rather than the previous 0.375%, and (iii) reduced the effective drawn fee to 1.25% rather than the previous 1.625%.
On September 24, 2021, the SPV entered into the second amendment to the AR Facility that, among other things: (i) increased the AR Facility limit and lender commitments by $50.0 million to $350.0 million, (ii) extended the scheduled termination date of the facility from October 20, 2023 to September 24, 2024, and (iii) reduced the effective drawn fee to 1.10% rather than the previous 1.25%.
Since our investment in the SPV is not sufficient to finance its activities without additional support from us, the SPV is a variable interest entity. We are the primary beneficiary of the SPV because we have the power to direct the activities that most significantly affect its economic performance and we are obligated to absorb its losses or receive its benefits from operations. Since we are the primary beneficiary of the SPV, we consolidate its assets and liabilities, which consist primarily of billed and unbilled accounts receivable of $773.6 million and long-term debt of $350.0 million as of December 31, 2021.
The amount available for borrowings at any one time under the AR Facility is limited to a borrowing base amount calculated based on the outstanding balance of eligible receivables held as collateral, subject to certain reserves, concentration limits, and other limitations. As of December 31, 2021, the AR Facility had a borrowing base of $350.0 million. Borrowings under the AR Facility bear interest (based on LIBOR or LMIR (as defined in the AR Facility) or after a benchmark transition event, the applicable SOFR (as defined in the AR Facility) plus a benchmark replacement adjustment) plus a drawn fee in the amount of 1.10% at December 31, 2021. The SPV also pays a fee on the undrawn committed amount of the AR Facility. Interest and fees payable by the SPV under the AR Facility are due monthly.
The AR Facility is scheduled to terminate on September 24, 2024, unless extended or earlier terminated in accordance with its terms, at which time no further advances will be available and the obligations under the AR Facility must be repaid in full by no later than (i) the date that is ninety (90) days following such date or (ii) such earlier date on which the loans under the AR Facility become due and payable.
The AR Facility includes covenants, indemnification provisions, and events of default, including those providing for termination of the AR Facility and the acceleration of amounts owed by the SPV under the AR Facility if, among other things, a borrowing base deficiency exists, there is an event of default under the Consolidated Credit Facility or certain other indebtedness, certain events negatively affecting the overall credit quality of the receivables held as collateral occur, a change of control occurs, or if the consolidated leverage ratio of ENLC exceeds limits identical to those in the Consolidated Credit Facility.
At December 31, 2021, we were in compliance with and expect to be in compliance with the financial covenants of the AR Facility for at least the next twelve months.
Issuances and Redemptions of Senior Unsecured Notes
On December 14, 2020, ENLC issued $500.0 million in aggregate principal amount of ENLC’s 5.625% senior unsecured notes due January 15, 2028 (the “2028 Notes”) at a price to the public of 100% of their face value. Interest payments on the 2028 Notes are payable on January 15 and July 15 of each year. The 2028 Notes are fully and unconditionally guaranteed by ENLK. Net proceeds of approximately $494.7 million were used to repay a portion of the borrowings under the Term Loan, which matured in December 2021.
All interest payments for senior unsecured notes are due semi-annually, in arrears.
ENLINK MIDSTREAM, LLC AND SUBSIDIARIES
Notes to Consolidated Financial Statements (continued)
Senior Unsecured Notes Redemption Provisions
Each issuance of the senior unsecured notes may be fully or partially redeemed prior to an early redemption date (see “Early Redemption Date” in table below) at a redemption price equal to the greater of: (i) 100% of the principal amount of the notes to be redeemed; or (ii) the sum of the remaining scheduled payments of principal and interest on the respective notes to be redeemed that would be due after the related redemption date but for such redemption (exclusive of interest accrued to, but excluding the redemption date) discounted to the redemption date on a semi-annual basis (assuming a 360-day year consisting of twelve 30-day months) at the applicable Treasury Rate plus a specified basis point premium (see “Basis Point Premium” in the table below); plus accrued and unpaid interest to, but excluding, the redemption date. At any time on or after the Early Redemption Date, the senior unsecured notes may be fully or partially redeemed at a redemption price equal to 100% of the principal amount of the applicable notes to be redeemed plus accrued and unpaid interest to, but excluding, the redemption date. See applicable redemption provision terms below:
| | | | | | | | | | | | | | | | | | | | |
| Issuance | | Maturity Date of Notes | | Early Redemption Date | | Basis Point Premium |
| | | | | | |
| 2024 Notes | | April 1, 2024 | | Prior to January 1, 2024 | | 25 Basis Points |
| 2025 Notes | | June 1, 2025 | | Prior to March 1, 2025 | | 30 Basis Points |
| 2026 Notes | | July 15, 2026 | | Prior to April 15, 2026 | | 50 Basis Points |
| 2028 Notes | | January 15, 2028 | | Prior to July 15, 2027 | | 50 Basis Points |
| 2029 Notes | | June 1, 2029 | | Prior to March 1, 2029 | | 50 Basis Points |
| 2044 Notes | | April 1, 2044 | | Prior to October 1, 2043 | | 30 Basis Points |
| 2045 Notes | | April 1, 2045 | | Prior to October 1, 2044 | | 30 Basis Points |
| 2047 Notes | | June 1, 2047 | | Prior to December 1, 2046 | | 40 Basis Points |
Senior Unsecured Notes Indentures
The indentures governing the senior unsecured notes contain covenants that, among other things, limit ENLC’s and ENLK’s ability to create or incur certain liens or consolidate, merge, or transfer all or substantially all of ENLC’s and ENLK’s assets.
The indenture governing the 2028 Notes provides that if a Change of Control Triggering Event (as defined in the indenture) occurs, ENLC must offer to repurchase the 2028 Notes at a price equal to 101% of the principal amount of the 2028 Notes, plus accrued and unpaid interest to, but excluding, the date of repurchase.
Each of the following is an event of default under the indentures:
•failure to pay any principal or interest when due;
•failure to observe any other agreement, obligation, or other covenant in the indenture, subject to the cure periods for certain failures; and
•bankruptcy or other insolvency events involving ENLC and ENLK.
If an event of default relating to bankruptcy or other insolvency events occurs, the senior unsecured notes will immediately become due and payable. If any other event of default exists under the indenture, the trustee under the indenture or the holders of the senior unsecured notes may accelerate the maturity of the senior unsecured notes and exercise other rights and remedies. At December 31, 2021, ENLC and ENLK were in compliance and expect to be in compliance with the covenants in the senior unsecured notes for at least the next twelve months.
ENLINK MIDSTREAM, LLC AND SUBSIDIARIES
Notes to Consolidated Financial Statements (continued)
Senior Unsecured Notes Repurchases
For the year ended December 31, 2020, we and ENLK made aggregate payments to partially repurchase the 2024, 2025, 2026, and 2029 Notes in open market transactions. For the year ended December 31, 2021, we and ENLK did not repurchase any senior notes. Activity related to the 2020 partial repurchases of our outstanding debt consisted of the following (in millions):
| | | | | |
| Year Ended December 31, 2020 |
| Debt repurchased | $ | 67.7 | |
| Aggregate payments | (36.0) | |
| Net discount on repurchased debt | (0.3) | |
| Accrued interest on repurchased debt | 0.6 | |
| Gain on extinguishment of debt | $ | 32.0 | |
(7) Income Taxes
The components of our income tax expense are as follows (in millions):
| | | | | | | | | | | | | | | | | |
| Year Ended December 31, |
| 2021 | | 2020 | | 2019 |
| Current income tax expense | $ | (0.8) | | | $ | (1.1) | | | $ | — | |
| Deferred tax expense | (24.6) | | | (142.1) | | | (6.9) | |
| Total income tax expense | $ | (25.4) | | | $ | (143.2) | | | $ | (6.9) | |
The following schedule reconciles total income tax expense and the amount calculated by applying the statutory U.S. federal tax rate to income before income taxes (in millions):
| | | | | | | | | | | | | | | | | |
| Year Ended December 31, |
| 2021 | | 2020 | | 2019 |
| Expected income tax benefit (expense) based on federal statutory tax rate | $ | (10.0) | | | $ | 58.5 | | | $ | 233.6 | |
| State income tax benefit (expense), net of federal benefit | (1.4) | | | 6.5 | | | 27.0 | |
| Unit-based compensation (1) | (3.1) | | | (6.0) | | | (2.2) | |
| Non-deductible expense related to impairments | — | | | (43.4) | | | (264.5) | |
| Statutory rate changes (2)(3) | (10.2) | | | — | | | — | |
| Change in valuation allowance (3) | 1.7 | | | (153.3) | | | — | |
| Other | (2.4) | | | (5.5) | | | (0.8) | |
| Total income tax expense | $ | (25.4) | | | $ | (143.2) | | | $ | (6.9) | |
____________________________
(1)Related to book-to-tax differences recorded upon the vesting of restricted incentive units.
(2)Effective January 1, 2022, Oklahoma House Bill 2960 resulted in a change in the corporate income tax rate from 6% to 4% and Louisiana Senate Bill No. 159 resulted in a change in the corporate income tax rate from 8% to 7.5%. Accordingly, we recorded deferred tax expense related to our Oklahoma and Louisiana operations in the amount of $7.6 million and $2.6 million, respectively, for the year ended December 31, 2021 due to a remeasurement of deferred tax assets.
(3)Includes the remeasurement of the state deferred tax liabilities, but were partially offset by a change in state apportionment, and its impact on the valuation allowance for the year ended December 31, 2021.
ENLINK MIDSTREAM, LLC AND SUBSIDIARIES
Notes to Consolidated Financial Statements (continued)
Deferred Tax Assets and Liabilities
Deferred income taxes reflect the net tax effects of temporary differences between the carrying amounts of assets and liabilities for financial reporting purposes and the amounts used for income tax purposes. The deferred tax liabilities, net of deferred tax assets, are included in “Deferred tax liability, net” in the consolidated balance sheets. Our deferred income tax assets and liabilities as of December 31, 2021 and 2020 are as follows (in millions):
| | | | | | | | | | | |
| December 31, 2021 | | December 31, 2020 |
| Deferred income tax assets: | | | |
| Federal net operating loss carryforward | $ | 573.6 | | | $ | 488.3 | |
| State net operating loss carryforward | 59.6 | | | 61.0 | |
| Total deferred tax assets, gross | 633.2 | | | 549.3 | |
| Valuation allowance | (151.6) | | | (153.3) | |
| Total deferred tax assets, net of valuation allowance | 481.6 | | | 396.0 | |
| Deferred tax liabilities: | | | |
| Property, plant, equipment, and intangible assets (1) | (619.1) | | | (504.6) | |
| Total deferred tax liabilities | (619.1) | | | (504.6) | |
| Deferred tax liability, net | $ | (137.5) | | | $ | (108.6) | |
____________________________
(1)Includes our investment in ENLK and primarily relates to differences between the book and tax bases of property and equipment.
As a result of the Merger, we acquired all issued and outstanding ENLK common units that were not already held by us or our subsidiaries in exchange for the issuance of ENLC common units. This was a taxable exchange to our unitholders, and we received a step-up in tax basis of the underlying assets acquired. In accordance with ASC 810, Consolidation, the step-up in our basis reduced our deferred tax liability by $399.0 million at the time of the Merger.
As of December 31, 2021, we had federal net operating loss (“NOL”) carryforwards of $2.7 billion that represent a net deferred tax asset of $573.6 million. As of December 31, 2021, we had state NOL carryforwards of $1.3 billion that represent a net deferred tax asset of $59.6 million. These carryforwards will begin expiring in 2028 through 2040. Federal NOLs incurred in 2018 and in future years (approximately $2.5 billion of our federal NOL carryforwards) may be carried forward indefinitely, but the deductibility of such federal NOLs is limited, while federal NOLs incurred prior to 2018 (approximately $0.2 billion of our NOL carryforwards) may be carried forward for only twenty years, but the deductibility of such NOL carryforwards generally is not limited unless we were to undergo a Section 382 “ownership change.”
A valuation allowance is established to reduce deferred tax assets if all, or some portion, of such assets will more than likely not be realized. We established a valuation allowance of $153.3 million as of December 31, 2020, primarily related to federal and state tax operating loss carryforwards for which we do not believe a tax benefit is more likely than not to be realized. For the year ended December 31, 2021, we recorded a $1.7 million valuation allowance adjustment. As of December 31, 2021, management believes it is more likely than not that the Company will realize the benefits of the deferred tax assets, net of valuation allowance.
For the years ended December 31, 2021 and 2020, there was no recorded unrecognized tax benefit. Per our accounting policy election, penalties and interest related to unrecognized tax benefits are recorded to income tax expense. As of December 31, 2021, tax years 2017 through 2021 remain subject to examination by various taxing authorities.
(8) Certain Provisions of the Partnership Agreement
(a) Series B Preferred Units
Issuance and Ownership
In January 2016, ENLK issued an aggregate of 50,000,000 Series B Preferred Units representing ENLK limited partner interests to Enfield in a private placement for a cash purchase price of $15.00 per Series B Preferred Unit (the “Issue Price”). On August 4, 2021, Enfield Holdings, L.P. (“Enfield”) sold all of its Series B Preferred Units and ENLC Class C Common
ENLINK MIDSTREAM, LLC AND SUBSIDIARIES
Notes to Consolidated Financial Statements (continued)
Units representing limited liability company interests in ENLC to Brookfield Infrastructure Partners L.P. and funds managed by Oaktree Capital Management, L.P.
Redemption
In December 2021, we redeemed 3,300,330 Series B Preferred Units for total consideration of $50.0 million plus accrued distributions. In addition, upon such redemption, a corresponding number of ENLC Class C Common Units were automatically cancelled. The redemption price represents 101% of the preferred units’ par value. In connection with the Series B Preferred Unit redemption, we have agreed with the holders of the Series B Preferred Units that we will pay cash in lieu of making a quarterly PIK distribution through the distribution declared for the fourth quarter of 2022.
Conversion and Distributions
Series B Preferred Units are exchangeable for ENLC common units in an amount equal to the number of outstanding Series B Preferred Units outstanding multiplied by the exchange ratio of 1.15, subject to certain adjustments (the “Series B Exchange Ratio”). The exchange is subject to ENLK’s option to pay cash instead of issuing additional ENLC common units, and can occur in whole or in part at the option of the holder of the Series B Preferred Units at any time, or in whole at our option, provided the daily volume-weighted average closing price of the ENLC common units for the 30 trading days ending two trading days prior to the exchange is greater than 150% of the Issue Price divided by the conversion ratio of 1.15.
The holder of the Series B Preferred Units is entitled to quarterly cash distributions and distributions in-kind of additional Series B Preferred Units. The quarterly in-kind distribution (the “Series B PIK Distribution”) equals the greater of (A) 0.0025 Series B Preferred Units per Series B Preferred Unit and (B) the number of Series B Preferred Units equal to the quotient of (x) the excess (if any) of (1) the distribution that would have been payable by ENLC had the Series B Preferred Units been exchanged for ENLC common units but applying a one-to-one exchange ratio (subject to certain adjustments) instead of the Series B Exchange Ratio, over (2) $0.28125 per Series B Preferred Unit (the “Cash Distribution Component”), divided by (y) the Issue Price. Except as described above with respect to distributions made until the distribution declared for the fourth quarter of 2022, the quarterly cash distribution (the “Series B Cash Distribution”) consists of the Cash Distribution Component plus an amount in cash that will be determined based on a comparison of the value (applying the Issue Price) of (i) the Series B PIK Distribution and (ii) the Series B Preferred Units that would have been distributed in the Series B PIK Distribution if such calculation applied the Series B Exchange Ratio instead of the one-to-one ratio (subject to certain adjustments).
ENLINK MIDSTREAM, LLC AND SUBSIDIARIES
Notes to Consolidated Financial Statements (continued)
A summary of the distribution activity relating to the Series B Preferred Units for the years ended December 31, 2021, 2020, and 2019 is provided below:
| | | | | | | | | | | | | | | | | | | | |
| Declaration period | | Distribution
paid as additional Series B Preferred Units | | Cash distribution
(in millions) | | Date paid/payable |
| 2021 | | | | | | |
| First Quarter of 2021 | | 150,871 | | | $ | 17.0 | | | May 14, 2021 |
| Second Quarter of 2021 | | 151,248 | | | $ | 17.0 | | | August 13, 2021 |
| Third Quarter of 2021 | | 151,626 | | | $ | 17.1 | | | November 12, 2021 |
| Fourth Quarter of 2021 | | — | | | $ | 19.2 | | | February 11, 2022 (1) |
| | | | | | |
| 2020 | | | | | | |
| First Quarter of 2020 | | 149,371 | | | $ | 16.8 | | | May 13, 2020 |
| Second Quarter of 2020 | | 149,745 | | | $ | 16.8 | | | August 13, 2020 |
| Third Quarter of 2020 | | 150,119 | | | $ | 16.9 | | | November 13, 2020 |
| Fourth Quarter of 2020 | | 150,494 | | | $ | 16.9 | | | February 12, 2021 |
| | | | | | |
| 2019 | | | | | | |
| First Quarter of 2019 | | 147,887 | | | $ | 16.7 | | | May 14, 2019 |
| Second Quarter of 2019 | | 148,257 | | | $ | 17.1 | | | August 13, 2019 |
| Third Quarter of 2019 | | 148,627 | | | $ | 17.1 | | | November 13, 2019 |
| Fourth Quarter of 2019 | | 148,999 | | | $ | 16.8 | | | February 13, 2020 |
| | | | | | |
| | | | | | |
| | | | | | |
| | | | | | |
| | | | | | |
| | | | | | |
____________________________
(1)In December 2021 and January 2022, we paid $0.9 million and $1.0 million, respectively, of accrued distributions on the Series B Preferred Units redeemed. The remaining distribution of $17.3 million related to the fourth quarter of 2021 will be payable February 11, 2022. See “Note 18—Subsequent Event” for more information regarding the January 2022 Series B Preferred Unit redemption.
(b) Series C Preferred Units
In September 2017, ENLK issued 400,000 Series C Preferred Units representing ENLK limited partner interests at a price to the public of $1,000 per unit. The Series C Preferred Units represent perpetual equity interests in ENLK and, unlike ENLK’s indebtedness, will not give rise to a claim for payment of a principal amount at a particular date. As to the payment of distributions and amounts payable on a liquidation event, the Series C Preferred Units rank senior to ENLK’s common units and to each other class of limited partner interests or other equity securities established after the issue date of the Series C Preferred Units that is not expressly made senior or on parity with the Series C Preferred Units. The Series C Preferred Units rank junior to the Series B Preferred Units with respect to the payment of distributions, and junior to the Series B Preferred Units and all current and future indebtedness with respect to amounts payable upon a liquidation event.
At any time on or after December 15, 2022, ENLK may redeem, at ENLK’s option, in whole or in part, the Series C Preferred Units at a redemption price in cash equal to $1,000 per Series C Preferred Unit plus an amount equal to all accumulated and unpaid distributions, whether or not declared. ENLK may undertake multiple partial redemptions. In addition, at any time within 120 days after the conclusion of any review or appeal process instituted by ENLK following certain rating agency events, ENLK may redeem, at ENLK’s option, the Series C Preferred Units in whole at a redemption price in cash per unit equal to $1,020 plus an amount equal to all accumulated and unpaid distributions, whether or not declared.
Distributions on the Series C Preferred Units accrue and are cumulative from the date of original issue and payable semi-annually in arrears on the 15th day of June and December of each year through and including December 15, 2022 and, thereafter, quarterly in arrears on the 15th day of March, June, September, and December of each year, in each case, if and when declared by the General Partner out of legally available funds for such purpose. The initial distribution rate for the Series C Preferred Units from and including the date of original issue to, but not including, December 15, 2022 is 6.0% per annum. On and after December 15, 2022, distributions on the Series C Preferred Units will accumulate for each distribution period at a percentage of the $1,000 liquidation preference per unit equal to an annual floating rate of the three-month LIBOR plus a spread
ENLINK MIDSTREAM, LLC AND SUBSIDIARIES
Notes to Consolidated Financial Statements (continued)
of 4.11%. For each of the years ended December 31, 2021, 2020, and 2019, ENLK made distributions of $24.0 million to the holders of Series C Preferred Units.
(9) Members’ Equity
(a) Common Unit Repurchase Program
In November 2020, the board of directors of the Managing Member authorized a common unit repurchase program for the repurchase of up to $100.0 million of outstanding ENLC common units and reauthorized such program in April 2021. The Board reauthorized ENLC’s common unit repurchase program and reset the amount available for repurchases of outstanding common units at up to $100.0 million effective January 1, 2022. Repurchases under the common unit repurchase program will be made, in accordance with applicable securities laws, from time to time in open market or private transactions and may be made pursuant to a trading plan meeting the requirements of Rule 10b5-1 under the Exchange Act. The repurchases will depend on market conditions and may be discontinued at any time.
For the year ended December 31, 2021, ENLC repurchased 6,091,001 outstanding ENLC common units for an aggregate cost, including commissions, of $40.1 million, or an average of $6.59 per common unit. For the year ended December 31, 2020, ENLC repurchased 383,614 outstanding ENLC common units for an aggregate cost, including commissions, of $1.2 million, or an average of $3.02 per common unit.
(b) Issuance of ENLC Common Units related to the Merger
In connection with the consummation of the Merger, we issued 304,822,035 ENLC common units in exchange for all of the outstanding ENLK common units not previously owned by us.
(c) ENLC Equity Distribution Agreement
On February 22, 2019, ENLC entered into the ENLC EDA with the ENLC Sales Agents to sell up to $400.0 million in aggregate gross sales of ENLC common units from time to time through an “at the market” equity offering program. Under the ENLC EDA, ENLC may also sell common units to any ENLC Sales Agent as principal for the ENLC Sales Agent’s own account at a price agreed upon at the time of sale. ENLC has no obligation to sell any ENLC common units under the ENLC EDA and may at any time suspend solicitation and offers under the ENLC EDA. As of February 9, 2022, ENLC has not sold any common units under the ENLC EDA.
ENLINK MIDSTREAM, LLC AND SUBSIDIARIES
Notes to Consolidated Financial Statements (continued)
(d) Earnings Per Unit and Dilution Computations
As required under ASC 260, Earnings Per Share, unvested share-based payments that entitle employees to receive non-forfeitable distributions are considered participating securities for earnings per unit calculations. The following table reflects the computation of basic and diluted earnings per unit for the periods presented (in millions, except per unit amounts):
| | | | | | | | | | | | | | | | | |
| Year Ended December 31, |
| 2021 | | 2020 | | 2019 |
| Distributed earnings allocated to: | | | | | |
Common units (1) | $ | 192.5 | | | $ | 183.5 | | | $ | 479.0 | |
Unvested restricted units (1) | 4.5 | | | 3.1 | | | 5.7 | |
Total distributed earnings | $ | 197.0 | | | $ | 186.6 | | | $ | 484.7 | |
| Undistributed loss allocated to: | | | | | |
Common units | $ | (170.6) | | | $ | (598.4) | | | $ | (1,584.8) | |
Unvested restricted units | (4.0) | | | (9.7) | | | (19.2) | |
| Total undistributed loss | $ | (174.6) | | | $ | (608.1) | | | $ | (1,604.0) | |
| Net income (loss) attributable to ENLC allocated to: | | | | | |
Common units | $ | 21.9 | | | $ | (414.9) | | | $ | (1,105.8) | |
Unvested restricted units | 0.5 | | | (6.6) | | | (13.5) | |
| Total net income (loss) attributable to ENLC | $ | 22.4 | | | $ | (421.5) | | | $ | (1,119.3) | |
| Basic and diluted net income (loss) per unit attributable to ENLC: | | | | | |
Basic | $ | 0.05 | | | $ | (0.86) | | | $ | (2.41) | |
Diluted | $ | 0.05 | | | $ | (0.86) | | | $ | (2.41) | |
____________________________
(1)Represents distribution activity consistent with the distribution activity table below.
The following are the unit amounts used to compute the basic and diluted earnings per unit for the periods presented (in millions):
| | | | | | | | | | | | | | | | | |
| Year Ended December 31, |
| 2021 | | 2020 | | 2019 |
| Basic weighted average units outstanding: | | | | | |
| Weighted average common units outstanding | 488.8 | | | 489.3 | | | 463.9 | |
| Diluted weighted average units outstanding: | | | | | |
| Weighted average basic common units outstanding | 488.8 | | | 489.3 | | | 463.9 | |
| Dilutive effect of non-vested restricted units (1) | 5.5 | | | — | | | — | |
| Total weighted average diluted common units outstanding | 494.3 | | | 489.3 | | | 463.9 | |
____________________________
(1)For the years ended December 31, 2020 and 2019, all common unit equivalents were antidilutive because a net loss existed for those periods.
All outstanding units were included in the computation of diluted earnings per unit and weighted based on the number of days such units were outstanding during the period presented.
ENLINK MIDSTREAM, LLC AND SUBSIDIARIES
Notes to Consolidated Financial Statements (continued)
(e) Distributions
A summary of our distribution activity related to the ENLC common units for the years ended December 31, 2021, 2020, and 2019, respectively, is provided below:
| | | | | | | | | | | | | | |
| Declaration period | | Distribution/unit | | Date paid/payable |
| 2021 | | | | |
| First Quarter of 2021 | | $ | 0.09375 | | | May 14, 2021 |
| Second Quarter of 2021 | | $ | 0.09375 | | | August 13, 2021 |
| Third Quarter of 2021 | | $ | 0.09375 | | | November 12, 2021 |
| Fourth Quarter of 2021 | | $ | 0.11250 | | | February 11, 2022 |
| | | | |
| 2020 | | | | |
| First Quarter of 2020 | | $ | 0.09375 | | | May 13, 2020 |
| Second Quarter of 2020 | | $ | 0.09375 | | | August 13, 2020 |
| Third Quarter of 2020 | | $ | 0.09375 | | | November 13, 2020 |
| Fourth Quarter of 2020 | | $ | 0.09375 | | | February 12, 2021 |
| | | | |
| 2019 | | | | |
| First Quarter of 2019 | | $ | 0.279 | | | May 14, 2019 |
| Second Quarter of 2019 | | $ | 0.283 | | | August 13, 2019 |
| Third Quarter of 2019 | | $ | 0.283 | | | November 13, 2019 |
| Fourth Quarter of 2019 | | $ | 0.1875 | | | February 13, 2020 |
ENLINK MIDSTREAM, LLC AND SUBSIDIARIES
Notes to Consolidated Financial Statements (continued)
(10) Investment in Unconsolidated Affiliates
As of December 31, 2021, our unconsolidated investments consisted of a 38.75% ownership in GCF and a 30% ownership in the Cedar Cove JV. The following table shows the activity related to our investment in unconsolidated affiliates for the periods indicated (in millions):
| | | | | | | | | | | | | | | | | |
| Year Ended December 31, |
| 2021 | | 2020 | | 2019 |
| GCF | | | | | |
| | | | | |
| Distributions | $ | 3.5 | | | $ | 1.6 | | | $ | 19.2 | |
| Equity in income (loss) | $ | (9.1) | | | $ | 3.0 | | | $ | 16.5 | |
| | | | | |
| Cedar Cove JV | | | | | |
| | | | | |
| Distributions | $ | 0.4 | | | $ | 0.5 | | | $ | 1.0 | |
| Equity in loss (1) | $ | (2.4) | | | $ | (2.4) | | | $ | (33.3) | |
| | | | | |
| Total | | | | | |
| | | | | |
| Distributions | $ | 3.9 | | | $ | 2.1 | | | $ | 20.2 | |
| Equity in income (loss) (1) | $ | (11.5) | | | $ | 0.6 | | | $ | (16.8) | |
___________________________
(1)Includes a loss of $31.4 million for the year ended December 31, 2019 related to the impairment of the carrying value of the Cedar Cove JV, as we determined that the carrying value of our investment was not recoverable based on the forecasted cash flows from the Cedar Cove JV.
The following table shows the balances related to our investment in unconsolidated affiliates as of December 31, 2021 and 2020 (in millions):
| | | | | | | | | | | |
| December 31, 2021 | | December 31, 2020 |
| GCF | $ | 28.0 | | | $ | 40.6 | |
| Cedar Cove JV (1) | (1.8) | | | 1.0 | |
| Total investment in unconsolidated affiliates | $ | 26.2 | | | $ | 41.6 | |
___________________________
(1)As of December 31, 2021, our investment in the Cedar Cove JV is classified as “Other long-term liabilities” on the consolidated balance sheet.
(11) Employee Incentive Plans
(a) Long-Term Incentive Plans
We account for unit-based compensation in accordance with ASC 718, which requires that compensation related to all unit-based awards be recognized in the consolidated financial statements. Unit-based compensation cost is valued at fair value at the date of grant, and that grant date fair value is recognized as expense over each award’s requisite service period with a corresponding increase to equity or liability based on the terms of each award and the appropriate accounting treatment under ASC 718. Unit-based compensation associated with ENLC’s unit-based compensation plan awarded to directors, officers, and employees of the General Partner is recorded by ENLK since ENLC has no substantial or managed operating activities other than its interests in ENLK.
ENLINK MIDSTREAM, LLC AND SUBSIDIARIES
Notes to Consolidated Financial Statements (continued)
Amounts recognized on the consolidated financial statements with respect to these plans are as follows (in millions):
| | | | | | | | | | | | | | | | | |
| Year Ended December 31, |
| 2021 | | 2020 | | 2019 |
| Cost of unit-based compensation charged to general and administrative expense | $ | 18.7 | | | $ | 21.3 | | | $ | 32.7 | |
| Cost of unit-based compensation charged to operating expense | 6.6 | | | 7.1 | | | 6.7 | |
| Total unit-based compensation expense | $ | 25.3 | | | $ | 28.4 | | | $ | 39.4 | |
| Non-controlling interest in unit-based compensation | $ | — | | | $ | — | | | $ | 0.5 | |
| Amount of related income tax benefit recognized in net income (loss) (1) | $ | 5.9 | | | $ | 6.7 | | | $ | 9.1 | |
____________________________
(1)For the years ended December 31, 2021, 2020, and 2019 the amount of related income tax benefit recognized in net income (loss) excluded $3.1 million, $6.0 million, and $2.2 million of income tax expense, respectively, related to book-to-tax differences recorded upon vesting of restricted units.
(b) ENLC Restricted Incentive Units
ENLC restricted incentive units were valued at their fair value at the date of grant, which is equal to the market value of ENLC common units on such date. A summary of the restricted incentive unit activity for the year ended December 31, 2021 is provided below:
| | | | | | | | | | | | | | |
| | Year Ended December 31, 2021 |
| ENLC Restricted Incentive Units: | | Number of Units | | Weighted Average Grant-Date Fair Value |
| Non-vested, beginning of period | | 5,350,086 | | | $ | 8.45 | |
| Granted (1) | | 3,937,301 | | | 3.86 | |
| Vested (1)(2) | | (1,268,801) | | | 12.85 | |
| Forfeited | | (511,115) | | | 6.10 | |
| Non-vested, end of period | | 7,507,471 | | | $ | 5.46 | |
| Aggregate intrinsic value, end of period (in millions) | | $ | 51.7 | | | |
____________________________
(1)Restricted incentive units typically vest at the end of three years.
(2)Vested units included 382,343 units withheld for payroll taxes paid on behalf of employees.
A summary of the restricted incentive units’ aggregate intrinsic value (market value at vesting date) and fair value of units vested (market value at date of grant) for the years ended December 31, 2021, 2020, and 2019 is provided below (in millions):
| | | | | | | | | | | | | | | | | | | | |
| | Year Ended December 31, |
| ENLC Restricted Incentive Units: | | 2021 | | 2020 | | 2019 |
| Aggregate intrinsic value of units vested | | $ | 5.6 | | | $ | 12.1 | | | $ | 17.3 | |
| Fair value of units vested | | $ | 16.3 | | | $ | 31.5 | | | $ | 22.8 | |
As of December 31, 2021, there were $13.0 million of unrecognized compensation costs that related to non-vested ENLC restricted incentive units. These costs are expected to be recognized over a weighted average period of 1.6 years.
For restricted incentive unit awards granted to certain officers and employees (the “grantee”), such awards (the “Subject Grants”) generally provide that, subject to the satisfaction of the conditions set forth in the agreement, the Subject Grants will vest on the third anniversary of the vesting commencement date (the “Regular Vesting Date”). The Subject Grants will be forfeited if the grantee’s employment or service with ENLC and its affiliates terminates prior to the Regular Vesting Date except that the Subject Grants will vest in full or on a pro-rated basis for certain terminations of employment or service prior to the Regular Vesting Date. For instance, the Subject Grants will vest on a pro-rated basis for any terminations of the grantee’s employment: (i) due to retirement, (ii) by ENLC or its affiliates without cause, or (iii) by the grantee for good reason (each, a “Covered Termination” and more particularly defined in the Subject Grants agreement) except that the Subject Grants will vest in full if the applicable Covered Termination is a “normal retirement” (as defined in the Subject Grants agreement) or the
ENLINK MIDSTREAM, LLC AND SUBSIDIARIES
Notes to Consolidated Financial Statements (continued)
applicable Covered Termination occurs after a change of control (if any). The Subject Grants will vest in full if death or a qualifying disability occurs prior to the Regular Vesting Date.
(c) ENLC Performance Units
ENLC grants performance awards under the 2014 Plan. The performance award agreements provide that the vesting of performance units (i.e., performance-based restricted incentive units) granted thereunder is dependent on the achievement of certain performance goals over the applicable performance period. At the end of the vesting period, recipients receive distribution equivalents, if any, with respect to the number of performance units vested. The vesting of such units ranges from zero to 200% of the units granted depending on the extent to which the related performance goals are achieved over the relevant performance period.
Performance Unit Awards Vesting
The vesting of performance units is dependent on (a) the grantee’s continued employment or service with ENLC or its affiliates for all relevant periods and (b) the TSR performance of ENLC (the “ENLC TSR”) and a performance goal based on cash flow (“Cash Flow”). At the time of grant, the Board of Directors of the Managing Member (the “Board”) will determine the relative weighting of the two performance goals by including in the award agreement the number of units that will be eligible for vesting depending on the achievement of the TSR performance goals (the “Total TSR Units”) versus the achievement of the Cash Flow performance goals (the “Total CF Units”). These performance awards have four separate performance periods: (i) three performance periods are each of the first, second, and third calendar years that occur following the vesting commencement date of the performance awards and (ii) the fourth performance period is the cumulative three-year period from the vesting commencement date through the third anniversary thereof (the “Cumulative Performance Period”).
One-fourth of the Total TSR Units (the “Tranche TSR Units”) relates to each of the four performance periods described above. Following the end date of a given performance period, the Governance and Compensation Committee (the “Committee”) of the Board will measure and determine the ENLC TSR relative to the TSR performance of a designated group of peer companies (the “Designated Peer Companies”) to determine the Tranche TSR Units that are eligible to vest, subject to the grantee’s continued employment or service with ENLC or its affiliates through the end date of the Cumulative Performance Period. In short, the TSR for a given performance period is defined as (i)(A) the average closing price of a common equity security at the end of the relevant performance period minus (B) the average closing price of a common equity security at the beginning of the relevant performance period plus (C) reinvested dividends divided by (ii) the average closing price of a common equity security at the beginning of the relevant performance period.
The following table sets out the levels at which the Tranche TSR Units may vest (using linear interpolation) based on the ENLC TSR percentile ranking for the applicable performance period relative to the TSR achievement of the Designated Peer Companies:
| | | | | | | | | | | | | | |
| Performance Level | | Achieved ENLC TSR
Position Relative to Designated Peer Companies | | Vesting percentage
of the Tranche TSR Units |
| Below Threshold | | Less than 25% | | 0% |
| Threshold | | Equal to 25% | | 50% |
| Target | | Equal to 50% | | 100% |
| Maximum | | Greater than or Equal to 75% | | 200% |
Approximately one-third of the Total CF Units (the “Tranche CF Units”) relates to each of the first three performance periods described above (i.e., the Cash Flow performance goal does not relate to the Cumulative Performance Period). The Board will establish the Cash Flow performance targets for purposes of the column in the table below titled “ENLC’s Achieved Cash Flow” for each performance period no later than March 31 of the year in which the relevant performance period begins. Following the end date of a given performance period, the Committee will measure and determine the Cash Flow performance of ENLC to determine the Tranche CF Units that are eligible to vest, subject to the grantee’s continued employment or service with ENLC or its affiliates through the end of the Cumulative Performance Period. In short, the Performance-Based Award Agreement defines Cash Flow for a given performance period as (A)(i) ENLC’s adjusted EBITDA minus (ii) interest expense, current taxes and other, maintenance capital expenditures, and preferred unit accrued distributions divided by (B) the time-weighted average number of ENLC’s common units outstanding during the relevant performance period.
ENLINK MIDSTREAM, LLC AND SUBSIDIARIES
Notes to Consolidated Financial Statements (continued)
In 2021, the Board adopted the metric free cash flow after distributions (“FCFAD”) as the cash flow performance goal in the Performance-Based Award Agreement rather than the previously used distributable cash flow per unit. The following table sets out the levels at which the Tranche CF Units were eligible to vest (using linear interpolation) based on the FCFAD performance of ENLC for the performance period ending December 31, 2021:
| | | | | | | | | | | | | | |
| Performance Level | | ENLC’s Achieved FCFAD | | Vesting percentage
of the Tranche CF Units |
| Below Threshold | | Less than $205 million | | 0% |
| Threshold | | Equal to $205 million | | 50% |
| Target | | Equal to $256 million | | 100% |
| Maximum | | Greater than or Equal to $300 million | | 200% |
The following table sets out the levels at which the Tranche CF Units were eligible to vest (using linear interpolation) based on the cash flow performance of ENLC for the performance period ending December 31, 2020:
| | | | | | | | | | | | | | |
| Performance Level | | ENLC’s Achieved
Distributable Cash Flow per Unit | | Vesting percentage
of the Tranche CF Units |
| Below Threshold | | Less than $1.345 | | 0% |
| Threshold | | Equal to $1.345 | | 50% |
| Target | | Equal to $1.494 | | 100% |
| Maximum | | Greater than or Equal to $1.643 | | 200% |
The following table sets out the levels at which the Tranche CF Units were eligible to vest (using linear interpolation) based on the cash flow performance of ENLC for the performance period ending December 31, 2019:
| | | | | | | | | | | | | | |
| Performance Level | | ENLC’s Achieved
Distributable Cash Flow per Unit | | Vesting percentage
of the Tranche CF Units |
| Below Threshold | | Less than $1.43 | | 0% |
| Threshold | | Equal to $1.43 | | 50% |
| Target | | Equal to $1.55 | | 100% |
| Maximum | | Greater than or Equal to $1.72 | | 200% |
The fair value of each performance unit is estimated as of the date of grant using a Monte Carlo simulation with the following assumptions used for all performance unit grants made under the plan: (i) a risk-free interest rate based on United States Treasury rates as of the grant date; (ii) a volatility assumption based on the historical realized price volatility of ENLC’s common units and the Designated Peer Companies’ or Peer Companies’ securities as applicable; (iii) an estimated ranking of ENLC (or for outstanding performance units granted prior to the Merger, ENLC and ENLK) among the Designated Peer Companies or Peer Companies, and (iv) the distribution yield. The fair value of the performance unit on the date of grant is expensed over a vesting period of approximately three years.
The following table presents a summary of the grant-date fair value assumptions by performance unit grant date:
| | | | | | | | | | | | | | | | | | | | | | | | | | | | | | | | | | | | | | | | | | | | | | |
| ENLC Performance Units: | | January 2021 | | July 2020 | | March 2020 | | January 2020 | | October 2019 | | June 2019 | | March 2019 | | |
| Grant-date fair value | | $ | 4.70 | | | $ | 2.33 | | | $ | 1.13 | | | $ | 7.69 | | | $ | 7.29 | | | $ | 9.92 | | | $ | 13.10 | | | |
| Beginning TSR price | | $ | 3.71 | | | $ | 2.52 | | | $ | 1.25 | | | $ | 6.13 | | | $ | 7.42 | | | $ | 9.84 | | | $ | 10.92 | | | |
| Risk-free interest rate | | 0.17 | % | | 0.17 | % | | 0.42 | % | | 1.62 | % | | 1.44 | % | | 1.72 | % | | 2.42 | % | | |
| Volatility factor | | 71.00 | % | | 67.00 | % | | 51.00 | % | | 37.00 | % | | 35.00 | % | | 33.50 | % | | 33.86 | % | | |
| | | | | | | | | | | | | | | | |
ENLINK MIDSTREAM, LLC AND SUBSIDIARIES
Notes to Consolidated Financial Statements (continued)
The following table presents a summary of the performance units:
| | | | | | | | | | | | | | |
| | Year Ended December 31, 2021 |
| ENLC Performance Units: | | Number of Units | | Weighted Average Grant-Date Fair Value |
| Non-vested, beginning of period | | 2,351,241 | | | $ | 8.82 | |
| Granted | | 1,388,139 | | | 4.70 | |
| Vested (1) | | (164,553) | | | 26.73 | |
| | | | |
| Non-vested, end of period | | 3,574,827 | | | $ | 6.40 | |
| Aggregate intrinsic value, end of period (in millions) | | $ | 24.6 | | | |
____________________________
(1)Vested units included 63,901 units withheld for payroll taxes paid on behalf of employees.
A summary of the performance units’ aggregate intrinsic value (market value at vesting date) and fair value of units vested (market value at date of grant) for the years ended December 31, 2021, 2020, and 2019 is provided below (in millions).
| | | | | | | | | | | | | | | | | | | | |
| | Year Ended December 31, |
| ENLC Performance Units: | | 2021 | | 2020 | | 2019 |
| Aggregate intrinsic value of units vested | | $ | 0.6 | | | $ | 0.9 | | | $ | 3.4 | |
| Fair value of units vested | | $ | 4.4 | | | $ | 5.5 | | | $ | 7.9 | |
As of December 31, 2021, there were $10.4 million of unrecognized compensation costs that related to non-vested ENLC performance units. These costs are expected to be recognized over a weighted-average period of 1.6 years.
(d) Benefit Plan
ENLK maintains a tax-qualified 401(k) plan whereby it matches 100% of every dollar contributed up to 6% of an employee’s eligible compensation. Contributions of $7.0 million, $7.2 million, and $9.4 million were made to the plan for the years ended December 31, 2021, 2020, and 2019, respectively.
(12) Derivatives
Interest Rate Swaps
In April 2019, we entered into $850.0 million of interest rate swaps to manage the interest rate risk associated with our floating-rate, LIBOR-based borrowings. Under this arrangement, we paid a fixed interest rate of 2.28% in exchange for LIBOR-based variable interest through December 2021. These interest rate swaps expired on December 10, 2021. There was no ineffectiveness related to this hedge.
During 2021 and 2020, we terminated the interest rate swaps in several increments in connection with repayments of the Term Loan, which was one of our floating-rate, LIBOR-based borrowings. The following table presents the interest rate swaps terminations and the associated cash payments during 2021 and 2020 (in millions):
| | | | | | | | | | | |
| Interest Rate Swaps Terminations | | Cash Payments Associated with Interest Rate Swaps Terminations |
| December 2021 | $ | 150.0 | | | $ | — | |
| September 2021 | 100.0 | | | 0.5 | |
| May 2021 | 100.0 | | | 1.3 | |
| December 2020 | 500.0 | | | 10.9 | |
| Total termination of interest rate swaps | $ | 850.0 | | | $ | 12.7 | |
ENLINK MIDSTREAM, LLC AND SUBSIDIARIES
Notes to Consolidated Financial Statements (continued)
The components of the unrealized gain (loss) on designated cash flow hedge related to changes in the fair value of our interest rate swaps were as follows (in millions):
| | | | | | | | | | | | | | | | | |
| Year Ended December 31, |
| 2021 | | 2020 | | 2019 |
| Change in fair value of interest rate swaps | $ | 18.2 | | | $ | (5.6) | | | $ | (12.4) | |
| Tax benefit (expense) | (4.3) | | | 1.3 | | | 3.4 | |
| Unrealized gain (loss) on designated cash flow hedge | $ | 13.9 | | | $ | (4.3) | | | $ | (9.0) | |
The interest expense, recognized from accumulated other comprehensive loss from the monthly settlement of our interest rate swaps and amortization of the termination payments, included in our consolidated statements of operations were as follows (in millions):
| | | | | | | | | | | | | | | | | |
| Year Ended December 31, |
| 2021 | | 2020 | | 2019 |
| Interest expense | $ | 18.3 | | | $ | 14.5 | | | $ | 0.4 | |
We expect to recognize an additional $0.1 million of interest expense out of accumulated other comprehensive loss over the next twelve months.
The fair value of our interest rate swaps included in our consolidated balance sheets were as follows (in millions):
| | | | | | | | | | | |
| December 31, 2021 | | December 31, 2020 |
| | | |
| | | |
| Fair value of derivative liabilities—current | $ | — | | | $ | (7.6) | |
| | | |
| | | |
Commodity Swaps
We manage our exposure to changes in commodity prices by hedging the impact of market fluctuations. Commodity swaps are used both to manage and hedge price and location risk related to these market exposures and to manage margins on offsetting fixed-price purchase or sale commitments for physical quantities of crude, condensate, natural gas, and NGLs. We do not designate commodity swaps as cash flow or fair value hedges for hedge accounting treatment under ASC 815. Therefore, changes in the fair value of our derivatives are recorded in revenue in the period incurred. In addition, our commodity risk management policy does not allow us to take speculative positions with our derivative contracts.
We commonly enter into index (float-for-float) or fixed-for-float swaps in order to mitigate our cash flow exposure to fluctuations in the future prices of natural gas, NGLs, and crude oil. For natural gas, index swaps are used to protect against the price exposure of daily priced gas versus first-of-month priced gas. For condensate, crude oil, and natural gas, index swaps are also used to hedge the basis location price risk resulting from supply and markets being priced on different indices. For natural gas, NGLs, condensate, and crude oil, fixed-for-float swaps are used to protect cash flows against price fluctuations: (1) where we receive a percentage of liquids as a fee for processing third-party gas or where we receive a portion of the proceeds of the sales of natural gas and liquids as a fee, (2) in the natural gas processing and fractionation components of our business and (3) where we are mitigating the price risk for product held in inventory or storage.
Assets and liabilities related to our derivative contracts are included in the fair value of derivative assets and liabilities, and the change in fair value of these contracts is recorded net as a gain (loss) on derivative activity on the consolidated statements of operations. We estimate the fair value of all of our derivative contracts based upon actively-quoted prices of the underlying commodities.
ENLINK MIDSTREAM, LLC AND SUBSIDIARIES
Notes to Consolidated Financial Statements (continued)
The components of gain (loss) on derivative activity in the consolidated statements of operations related to commodity swaps are (in millions):
| | | | | | | | | | | | | | | | | |
| Year Ended December 31, |
| 2021 | | 2020 | | 2019 |
| Change in fair value of derivatives | $ | (12.4) | | | $ | (10.5) | | | $ | (0.1) | |
| Realized gain (loss) on derivatives | (146.7) | | | (11.5) | | | 14.5 | |
| Gain (loss) on derivative activity | $ | (159.1) | | | $ | (22.0) | | | $ | 14.4 | |
The fair value of derivative assets and liabilities related to commodity swaps are as follows (in millions):
| | | | | | | | | | | |
| December 31, 2021 | | December 31, 2020 |
| Fair value of derivative assets—current | $ | 22.4 | | | $ | 25.0 | |
| Fair value of derivative assets—long-term | 0.2 | | | 4.9 | |
| Fair value of derivative liabilities—current | (34.9) | | | (29.5) | |
| Fair value of derivative liabilities—long-term | (2.2) | | | (2.5) | |
| Net fair value of commodity swaps | $ | (14.5) | | | $ | (2.1) | |
Set forth below are the summarized notional volumes and fair values of all instruments related to commodity swaps that we held for price risk management purposes and the related physical offsets at December 31, 2021 (in millions). The remaining term of the contracts extend no later than January 2023.
| | | | | | | | | | | | | | | | | | | | | | | | | | |
| | | | December 31, 2021 |
| Commodity | | Instruments | | Unit | | Volume | | Net Fair Value |
| NGL (short contracts) | | Swaps | | Gals | | (63.0) | | | $ | (10.6) | |
| NGL (long contracts) | | Swaps | | Gals | | — | | | — | |
| Natural gas (short contracts) | | Swaps | | MMbtu | | (7.5) | | | 2.7 | |
| Natural gas (long contracts) | | Swaps | | MMbtu | | 13.2 | | | (7.8) | |
| Crude and condensate (short contracts) | | Swaps | | MMbbls | | (3.9) | | | (4.4) | |
| Crude and condensate (long contracts) | | Swaps | | MMbbls | | 3.9 | | | 5.6 | |
| Total fair value of commodity swaps | | | | | | | | $ | (14.5) | |
On all transactions where we are exposed to counterparty risk, we analyze the counterparty’s financial condition prior to entering into an agreement, establish limits, and monitor the appropriateness of these limits on an ongoing basis. We primarily deal with financial institutions when entering into financial derivatives on commodities. We have entered into Master ISDAs that allow for netting of swap contract receivables and payables in the event of default by either party. If our counterparties failed to perform under existing commodity swap contracts, the maximum loss on our gross receivable position of $22.6 million as of December 31, 2021 would be reduced to $0.8 million due to the offsetting of gross fair value payables against gross fair value receivables as allowed by the ISDAs.
(13) Fair Value Measurements
ASC 820 sets forth a framework for measuring fair value and required disclosures about fair value measurements of assets and liabilities. Fair value under ASC 820 is defined as the price at which an asset could be exchanged in a current transaction between knowledgeable, willing parties. A liability’s fair value is defined as the amount that would be paid to transfer the liability to a new obligor, not the amount that would be paid to settle the liability with the creditor. Where available, fair value is based on observable market prices or parameters or derived from such prices or parameters. Where observable prices or inputs are not available, use of unobservable prices or inputs are used to estimate the current fair value, often using an internal valuation model. These valuation techniques involve some level of management estimation and judgment, the degree of which is dependent on the item being valued.
ENLINK MIDSTREAM, LLC AND SUBSIDIARIES
Notes to Consolidated Financial Statements (continued)
ASC 820 established a three-tier fair value hierarchy, which prioritizes the inputs used in measuring fair value. These tiers include: Level 1, defined as observable inputs such as quoted prices in active markets; Level 2, defined as inputs other than quoted prices in active markets that are either directly or indirectly observable; and Level 3, defined as unobservable inputs in which little or no market data exists, therefore requiring an entity to develop its own assumptions.
Our derivative contracts primarily consist of commodity swap contracts, which are not traded on a public exchange. The fair values of commodity swap contracts are determined using discounted cash flow techniques. The techniques incorporate Level 1 and Level 2 inputs for future commodity prices that are readily available in public markets or can be derived from information available in publicly-quoted markets. These market inputs are utilized in the discounted cash flow calculation considering the instrument’s term, notional amount, discount rate, and credit risk and are classified as Level 2 in hierarchy.
Assets and liabilities measured at fair value on a recurring basis are summarized below (in millions):
| | | | | | | | | | | |
| Level 2 |
| December 31, 2021 | | December 31, 2020 |
| Interest rate swaps (1) | $ | — | | | $ | (7.6) | |
| Commodity swaps (2) | $ | (14.5) | | | $ | (2.1) | |
____________________________
(1)The fair values of the interest rate swaps are estimated based on the difference between expected cash flows calculated at the contracted interest rates and the expected cash flows using observable benchmarks for the variable interest rates.
(2)The fair values of commodity swaps represent the amount at which the instruments could be exchanged in a current arms-length transaction adjusted for our credit risk and/or the counterparty credit risk as required under ASC 820.
Fair Value of Financial Instruments
The estimated fair value of our financial instruments has been determined using available market information and valuation methodologies. Considerable judgment is required to develop the estimates of fair value; thus, the estimates provided below are not necessarily indicative of the amount we could realize upon the sale or refinancing of such financial instruments (in millions):
| | | | | | | | | | | | | | | | | | | | | | | |
| December 31, 2021 | | December 31, 2020 |
| Carrying Value | | Fair Value | | Carrying Value | | Fair Value |
| Long-term debt (1) | $ | 4,363.7 | | | $ | 4,520.0 | | | $ | 4,593.8 | | | $ | 4,318.2 | |
| Installment payab1e (2) | $ | 10.0 | | | $ | 10.0 | | | $ | — | | | $ | — | |
| Contingent consideration (2) | $ | 6.9 | | | $ | 6.9 | | | $ | — | | | $ | — | |
____________________________
(1)The carrying value of long-term debt as of December 31, 2020 includes current maturities. The carrying value of the long-term debt is reduced by debt issuance costs of $27.8 million and $32.6 million at December 31, 2021 and 2020, respectively. The respective fair values do not factor in debt issuance costs.
(2)Consideration paid for the acquisition of Amarillo Rattler, LLC included $10.0 million to be paid on April 30, 2022 and a contingent consideration capped at $15.0 million and payable between 2024 and 2026 based on Diamondback Energy’s drilling activity above historical levels. Estimated fair values were calculated using a discounted cash flow analysis that utilized Level 3 inputs. For additional information regarding this transaction, refer to “Note 2—Significant Accounting Policies.”
The carrying amounts of our cash and cash equivalents, accounts receivable, and accounts payable approximate fair value due to the short-term maturities of these assets and liabilities.
The fair values of all senior unsecured notes as of December 31, 2021 and 2020 were based on Level 2 inputs from third-party market quotations.
(14) Commitments and Contingencies
(a) Change of Control and Severance Agreements
Certain members of our management are parties to severance and change of control agreements with the Operating Partnership. The severance and change in control agreements provide those individuals with severance payments in certain circumstances and prohibit such individuals from, among other things, competing with the General Partner or its affiliates
ENLINK MIDSTREAM, LLC AND SUBSIDIARIES
Notes to Consolidated Financial Statements (continued)
during his or her employment. In addition, the severance and change of control agreements prohibit subject individuals from, among other things, disclosing confidential information about the General Partner or interfering with a client or customer of the General Partner or its affiliates, in each case during his or her employment and for certain periods (including indefinite periods) following the termination of such person’s employment.
(b) Environmental Issues
The operation of pipelines, plants, and other facilities for the gathering, processing, transmitting, stabilizing, fractionating, storing, or disposing of natural gas, NGLs, crude oil, condensate, brine, and other products is subject to stringent and complex laws and regulations pertaining to health, safety, and the environment. As an owner, partner, or operator of these facilities, we must comply with United States laws and regulations at the federal, state, and local levels that relate to air and water quality, hazardous and solid waste management and disposal, oil spill prevention, climate change, endangered species, and other environmental matters. The cost of planning, designing, constructing, and operating pipelines, plants, and other facilities must account for compliance with environmental laws and regulations and safety standards. Federal, state, or local administrative decisions, developments in the federal or state court systems, or other governmental or judicial actions may influence the interpretation and enforcement of environmental laws and regulations and may thereby increase compliance costs. Failure to comply with these laws and regulations may trigger a variety of administrative, civil, and potentially criminal enforcement measures, including citizen suits, which can include the assessment of monetary penalties, the imposition of remedial requirements, and the issuance of injunctions or restrictions on operation. Management believes that, based on currently known information, compliance with these laws and regulations will not have a material adverse effect on our results of operations, financial condition, or cash flows. However, we cannot provide assurance that future events, such as changes in existing laws, regulations, or enforcement policies, the promulgation of new laws or regulations, or the discovery or development of new factual circumstances will not cause us to incur material costs. Environmental regulations have historically become more stringent over time, and thus, there can be no assurance as to the amount or timing of future expenditures for environmental compliance or remediation.
(c) Litigation Contingencies
In February 2021, the areas in which we operate experienced a severe winter storm, with extreme cold, ice, and snow occurring over an unprecedented period of approximately 10 days (“Winter Storm Uri”). As a result of Winter Storm Uri, we have encountered customer billing disputes related to the delivery of gas during the storm, including one that resulted in litigation. The litigation is between one of our subsidiaries, EnLink Gas Marketing, LP (“EnLink Gas”), and Koch Energy Services, LLC (“Koch”) in the 162nd District Court in Dallas County, Texas. The dispute centers on whether EnLink Gas was excused from delivering gas or performing under certain delivery or purchase obligations during Winter Storm Uri, given our declaration of force majeure during the storm. Koch has invoiced us approximately $53.9 million (after subtracting amounts owed to EnLink Gas) and does not recognize the declaration of force majeure. We believe the declaration of force majeure was valid and appropriate and we intend to vigorously defend against Koch’s claims.
Another of our subsidiaries, EnLink Energy GP, LLC, is also involved in litigation arising out of Winter Storm Uri. This matter is a multi-district litigation currently pending in Harris County, Texas, in which multiple individual plaintiffs assert personal injury and property damage claims arising out of Winter Storm Uri against an aggregate of over 350 power generators, transmission/distribution utility, retail electric provider, and natural gas defendants across over 150 filed cases. We believe the claims against our subsidiary lack merit and we intend to vigorously defend against such claims.
In addition, we are involved in various litigation and administrative proceedings arising in the normal course of business. In the opinion of management, any liabilities that may result from these claims would not, individually or in the aggregate, have a material adverse effect on our financial position, results of operations, or cash flows. We may also be involved from time to time in the future in various proceedings in the normal course of business, including litigation on disputes related to contracts, property rights, property use or damage (including nuisance claims), personal injury, or the value of pipeline easements or other rights obtained through the exercise of eminent domain or common carrier rights.
ENLINK MIDSTREAM, LLC AND SUBSIDIARIES
Notes to Consolidated Financial Statements (continued)
(15) Segment Information
Starting in the first quarter of 2021, we began evaluating the financial performance of our segments by including realized and unrealized gains and losses resulting from commodity swaps activity in the Permian, Louisiana, Oklahoma, and North Texas segments. Commodity swaps activity was previously reported in the Corporate segment. We have recast segment information for all presented periods prior to the first quarter of 2021 to conform to current period presentation. Identification of the majority of our operating segments is based principally upon geographic regions served:
•Permian Segment. The Permian segment includes our natural gas gathering, processing, and transmission activities and our crude oil operations in the Midland and Delaware Basins in West Texas and Eastern New Mexico;
•Louisiana Segment. The Louisiana segment includes our natural gas and NGL pipelines, natural gas processing plants, natural gas and NGL storage facilities, and fractionation facilities located in Louisiana and our crude oil operations in ORV;
•Oklahoma Segment. The Oklahoma segment includes our natural gas gathering, processing, and transmission activities, and our crude oil operations in the Cana-Woodford, Arkoma-Woodford, northern Oklahoma Woodford, STACK, and CNOW shale areas;
•North Texas Segment. The North Texas segment includes our natural gas gathering, processing, and transmission activities in North Texas; and
•Corporate Segment. The Corporate segment includes our unconsolidated affiliate investments in the Cedar Cove JV in Oklahoma, our ownership interest in GCF in South Texas, and our general corporate assets and expenses.
ENLINK MIDSTREAM, LLC AND SUBSIDIARIES
Notes to Consolidated Financial Statements (continued)
We evaluate the performance of our operating segments based on segment profit and adjusted gross margin. Adjusted gross margin is a non-GAAP financial measure. See “Item 7. Management’s Discussion and Analysis of Financial Condition and Results of Operations—Non-GAAP Financial Measures” for additional information. Summarized financial information for our reportable segments is shown in the following tables (in millions):
| | | | | | | | | | | | | | | | | | | | | | | | | | | | | | | | | | | |
| Permian | | Louisiana | | Oklahoma | | North Texas | | Corporate | | Totals |
| Year Ended December 31, 2021 | | | | | | | | | | | |
| Natural gas sales | $ | 609.4 | | | $ | 693.5 | | | $ | 213.4 | | | $ | 150.0 | | | $ | — | | | $ | 1,666.3 | |
| NGL sales | 0.9 | | | 3,353.1 | | | 2.0 | | | 1.1 | | | — | | | 3,357.1 | |
| Crude oil and condensate sales | 677.4 | | | 212.0 | | | 81.2 | | | — | | | — | | | 970.6 | |
| | | | | | | | | | | |
| Product sales | 1,287.7 | | | 4,258.6 | | | 296.6 | | | 151.1 | | | — | | | 5,994.0 | |
| | | | | | | | | | | |
| NGL sales—related parties | 1,008.4 | | | 129.7 | | | 630.8 | | | 447.0 | | | (2,215.9) | | | — | |
| Crude oil and condensate sales—related parties | — | | | — | | | 0.1 | | | 7.1 | | | (7.2) | | | — | |
| Product sales—related parties | 1,008.4 | | | 129.7 | | | 630.9 | | | 454.1 | | | (2,223.1) | | | — | |
| Gathering and transportation | 46.8 | | | 64.7 | | | 186.9 | | | 157.0 | | | — | | | 455.4 | |
| Processing | 29.1 | | | 2.4 | | | 98.7 | | | 108.3 | | | — | | | 238.5 | |
| NGL services | — | | | 82.6 | | | — | | | 0.3 | | | — | | | 82.9 | |
| Crude services | 18.4 | | | 39.3 | | | 12.8 | | | 0.7 | | | — | | | 71.2 | |
| Other services | 0.2 | | | 1.7 | | | 0.6 | | | 0.5 | | | — | | | 3.0 | |
| Midstream services | 94.5 | | | 190.7 | | | 299.0 | | | 266.8 | | | — | | | 851.0 | |
| | | | | | | | | | | |
| | | | | | | | | | | |
| | | | | | | | | | | |
| Crude services—related parties | — | | | — | | | 0.3 | | | — | | | (0.3) | | | — | |
| Other services—related parties | — | | | 2.4 | | | — | | | — | | | (2.4) | | | — | |
| Midstream services—related parties | — | | | 2.4 | | | 0.3 | | | — | | | (2.7) | | | — | |
| Revenue from contracts with customers | 2,390.6 | | | 4,581.4 | | | 1,226.8 | | | 872.0 | | | (2,225.8) | | | 6,845.0 | |
| Cost of sales, exclusive of operating expenses and depreciation and amortization (1) | (1,996.1) | | | (4,091.2) | | | (796.6) | | | (531.8) | | | 2,225.8 | | | (5,189.9) | |
| Realized loss on derivatives | (75.6) | | | (42.3) | | | (22.6) | | | (6.2) | | | — | | | (146.7) | |
| Change in fair value of derivatives | (7.7) | | | 0.7 | | | — | | | (5.4) | | | — | | | (12.4) | |
| Adjusted gross margin | 311.2 | | | 448.6 | | | 407.6 | | | 328.6 | | | — | | | 1,496.0 | |
| Operating expenses | (81.5) | | | (123.7) | | | (80.0) | | | (77.7) | | | — | | | (362.9) | |
| Segment profit | 229.7 | | | 324.9 | | | 327.6 | | | 250.9 | | | — | | | 1,133.1 | |
| Depreciation and amortization | (139.9) | | | (141.0) | | | (204.3) | | | (114.3) | | | (8.0) | | | (607.5) | |
| Impairments | — | | | (0.6) | | | — | | | — | | | (0.2) | | | (0.8) | |
| Gain on disposition of assets | — | | | 1.2 | | | — | | | 0.3 | | | — | | | 1.5 | |
| General and administrative | — | | | — | | | — | | | — | | | (107.8) | | | (107.8) | |
| | | | | | | | | | | |
| Interest expense, net of interest income | — | | | — | | | — | | | — | | | (238.7) | | | (238.7) | |
| | | | | | | | | | | |
| Loss from unconsolidated affiliates | — | | | — | | | — | | | — | | | (11.5) | | | (11.5) | |
| | | | | | | | | | | |
| Income (loss) before non-controlling interest and income taxes | $ | 89.8 | | | $ | 184.5 | | | $ | 123.3 | | | $ | 136.9 | | | $ | (366.2) | | | $ | 168.3 | |
| | | | | | | | | | | |
| Capital expenditures | $ | 141.6 | | | $ | 9.3 | | | $ | 30.4 | | | $ | 11.9 | | | $ | 2.8 | | | $ | 196.0 | |
____________________________
(1)Includes related party cost of sales of $17.9 million for the year ended December 31, 2021.
ENLINK MIDSTREAM, LLC AND SUBSIDIARIES
Notes to Consolidated Financial Statements (continued)
| | | | | | | | | | | | | | | | | | | | | | | | | | | | | | | | | | | |
| Permian | | Louisiana | | Oklahoma | | North Texas | | Corporate | | Totals |
| Year Ended December 31, 2020 | | | | | | | | | | | |
| Natural gas sales | $ | 150.1 | | | $ | 330.5 | | | $ | 153.1 | | | $ | 70.3 | | | $ | — | | | $ | 704.0 | |
| NGL sales | 0.2 | | | 1,545.4 | | | 2.8 | | | — | | | — | | | 1,548.4 | |
| Crude oil and condensate sales | 558.1 | | | 126.7 | | | 40.3 | | | — | | | — | | | 725.1 | |
| | | | | | | | | | | |
| Product sales | 708.4 | | | 2,002.6 | | | 196.2 | | | 70.3 | | | — | | | 2,977.5 | |
| | | | | | | | | | | |
| NGL sales—related parties | 312.6 | | | 31.4 | | | 296.4 | | | 115.2 | | | (755.6) | | | — | |
| Crude oil and condensate sales—related parties | 0.6 | | | — | | | (0.1) | | | 3.6 | | | (4.1) | | | — | |
| Product sales—related parties | 313.2 | | | 31.4 | | | 296.3 | | | 118.8 | | | (759.7) | | | — | |
| Gathering and transportation | 42.8 | | | 46.5 | | | 228.7 | | | 179.2 | | | — | | | 497.2 | |
| Processing | 24.1 | | | 2.0 | | | 123.6 | | | 132.6 | | | — | | | 282.3 | |
| NGL services | — | | | 75.8 | | | — | | | 0.2 | | | — | | | 76.0 | |
| Crude services | 16.8 | | | 45.2 | | | 16.5 | | | 0.2 | | | — | | | 78.7 | |
| Other services | 1.2 | | | 1.6 | | | 0.4 | | | 0.9 | | | — | | | 4.1 | |
| Midstream services | 84.9 | | | 171.1 | | | 369.2 | | | 313.1 | | | — | | | 938.3 | |
| | | | | | | | | | | |
| | | | | | | | | | | |
| | | | | | | | | | | |
| Crude services—related parties | — | | | — | | | 0.3 | | | — | | | (0.3) | | | — | |
| | | | | | | | | | | |
| Midstream services—related parties | — | | | — | | | 0.3 | | | — | | | (0.3) | | | — | |
| Revenue from contracts with customers | 1,106.5 | | | 2,205.1 | | | 862.0 | | | 502.2 | | | (760.0) | | | 3,915.8 | |
| Cost of sales, exclusive of operating expenses and depreciation and amortization (1) | (842.2) | | | (1,787.0) | | | (365.5) | | | (153.8) | | | 760.0 | | | (2,388.5) | |
| Realized loss on derivatives | (1.1) | | | (6.0) | | | (4.4) | | | — | | | — | | | (11.5) | |
| Change in fair value of derivatives | 1.1 | | | (6.5) | | | (4.5) | | | (0.6) | | | — | | | (10.5) | |
| Adjusted gross margin | 264.3 | | | 405.6 | | | 487.6 | | | 347.8 | | | — | | | 1,505.3 | |
| Operating expenses | (94.2) | | | (120.0) | | | (82.2) | | | (77.4) | | | — | | | (373.8) | |
| Segment profit | 170.1 | | | 285.6 | | | 405.4 | | | 270.4 | | | — | | | 1,131.5 | |
| Depreciation and amortization | (125.2) | | | (145.8) | | | (216.9) | | | (143.4) | | | (7.3) | | | (638.6) | |
| Impairments | (184.6) | | | (170.0) | | | (0.7) | | | — | | | (7.5) | | | (362.8) | |
| Gain (loss) on disposition of assets | (11.2) | | | 0.1 | | | 0.3 | | | 2.0 | | | — | | | (8.8) | |
| General and administrative | — | | | — | | | — | | | — | | | (103.3) | | | (103.3) | |
| | | | | | | | | | | |
| Interest expense, net of interest income | — | | | — | | | — | | | — | | | (223.3) | | | (223.3) | |
| Gain on extinguishment of debt | — | | | — | | | — | | | — | | | 32.0 | | | 32.0 | |
| Income from unconsolidated affiliates | — | | | — | | | — | | | — | | | 0.6 | | | 0.6 | |
| Other income | — | | | — | | | — | | | — | | | 0.3 | | | 0.3 | |
| Income (loss) before non-controlling interest and income taxes | $ | (150.9) | | | $ | (30.1) | | | $ | 188.1 | | | $ | 129.0 | | | $ | (308.5) | | | $ | (172.4) | |
| | | | | | | | | | | |
| Capital expenditures | $ | 181.1 | | | $ | 44.6 | | | $ | 17.9 | | | $ | 16.9 | | | $ | 2.1 | | | $ | 262.6 | |
____________________________
(1)Includes related party cost of sales of $8.7 million for the year ended December 31, 2020.
ENLINK MIDSTREAM, LLC AND SUBSIDIARIES
Notes to Consolidated Financial Statements (continued)
| | | | | | | | | | | | | | | | | | | | | | | | | | | | | | | | | | | |
| Permian | | Louisiana | | Oklahoma | | North Texas | | Corporate | | Totals |
| Year Ended December 31, 2019 | | | | | | | | | | | |
| Natural gas sales | $ | 94.3 | | | $ | 416.6 | | | $ | 236.4 | | | $ | 129.3 | | | $ | — | | | $ | 876.6 | |
| NGL sales | 0.9 | | | 1,725.6 | | | 19.6 | | | 30.9 | | | — | | | 1,777.0 | |
| Crude oil and condensate sales | 1,975.0 | | | 291.9 | | | 109.6 | | | — | | | — | | | 2,376.5 | |
| | | | | | | | | | | |
| Product sales | 2,070.2 | | | 2,434.1 | | | 365.6 | | | 160.2 | | | — | | | 5,030.1 | |
| Natural gas sales—related parties | 0.4 | | | — | | | — | | | — | | | (0.4) | | | — | |
| NGL sales—related parties | 347.7 | | | 25.7 | | | 421.1 | | | 94.8 | | | (889.3) | | | — | |
| Crude oil and condensate sales—related parties | 13.5 | | | 1.7 | | | — | | | 5.5 | | | (20.7) | | | — | |
| Product sales—related parties | 361.6 | | | 27.4 | | | 421.1 | | | 100.3 | | | (910.4) | | | — | |
| Gathering and transportation | 48.8 | | | 58.3 | | | 234.5 | | | 196.4 | | | — | | | 538.0 | |
| Processing | 30.5 | | | 3.2 | | | 138.2 | | | 143.0 | | | — | | | 314.9 | |
| NGL services | — | | | 50.6 | | | — | | | 0.1 | | | — | | | 50.7 | |
| Crude services | 19.2 | | | 51.9 | | | 19.8 | | | — | | | — | | | 90.9 | |
| Other services | 12.0 | | | 0.7 | | | 0.1 | | | 1.1 | | | — | | | 13.9 | |
| Midstream services | 110.5 | | | 164.7 | | | 392.6 | | | 340.6 | | | — | | | 1,008.4 | |
| | | | | | | | | | | |
| | | | | | | | | | | |
| NGL services—related parties | — | | | (3.4) | | | — | | | — | | | 3.4 | | | — | |
| Crude services—related parties | — | | | — | | | 1.8 | | | — | | | (1.8) | | | — | |
| | | | | | | | | | | |
| Midstream services—related parties | — | | | (3.4) | | | 1.8 | | | — | | | 1.6 | | | — | |
| Revenue from contracts with customers | 2,542.3 | | | 2,622.8 | | | 1,181.1 | | | 601.1 | | | (908.8) | | | 6,038.5 | |
| Cost of sales, exclusive of operating expenses and depreciation and amortization (1) | (2,283.9) | | | (2,181.6) | | | (627.0) | | | (208.8) | | | 908.8 | | | (4,392.5) | |
| Realized gain on derivatives | 9.4 | | | 5.1 | | | — | | | — | | | — | | | 14.5 | |
| Change in fair value of derivatives | 1.5 | | | (1.8) | | | — | | | 0.2 | | | — | | | (0.1) | |
| Adjusted gross margin | 269.3 | | | 444.5 | | | 554.1 | | | 392.5 | | | — | | | 1,660.4 | |
| Operating expenses | (112.9) | | | (147.3) | | | (104.0) | | | (102.9) | | | — | | | (467.1) | |
| Segment profit | 156.4 | | | 297.2 | | | 450.1 | | | 289.6 | | | — | | | 1,193.3 | |
| Depreciation and amortization | (119.8) | | | (154.1) | | | (194.9) | | | (139.8) | | | (8.4) | | | (617.0) | |
| Impairments | (3.5) | | | (188.7) | | | (813.5) | | | (127.8) | | | — | | | (1,133.5) | |
| Gain (loss) on disposition of assets | (0.3) | | | 2.6 | | | 0.1 | | | (0.5) | | | — | | | 1.9 | |
| General and administrative | — | | | — | | | — | | | — | | | (152.6) | | | (152.6) | |
| Loss on secured term loan receivable | — | | | — | | | — | | | — | | | (52.9) | | | (52.9) | |
| Interest expense, net of interest income | — | | | — | | | — | | | — | | | (216.0) | | | (216.0) | |
| | | | | | | | | | | |
| Loss from unconsolidated affiliates | — | | | — | | | — | | | — | | | (16.8) | | | (16.8) | |
| Other income | — | | | — | | | — | | | — | | | 0.9 | | | 0.9 | |
| Income (loss) before non-controlling interest and income taxes | $ | 32.8 | | | $ | (43.0) | | | $ | (558.2) | | | $ | 21.5 | | | $ | (445.8) | | | $ | (992.7) | |
| Capital expenditures | $ | 364.5 | | | $ | 99.9 | | | $ | 238.1 | | | $ | 39.0 | | | $ | 6.9 | | | $ | 748.4 | |
____________________________(1)Includes related party cost of sales of $21.7 million for the year ended December 31, 2019.
ENLINK MIDSTREAM, LLC AND SUBSIDIARIES
Notes to Consolidated Financial Statements (continued)
The table below represents information about segment assets as of December 31, 2021 and 2020 (in millions):
| | | | | | | | | | | | | | |
| Segment Identifiable Assets: | | December 31, 2021 | | December 31, 2020 |
| Permian | | $ | 2,358.6 | | | $ | 2,236.3 | |
| Louisiana | | 2,428.6 | | | 2,312.4 | |
| Oklahoma | | 2,619.5 | | | 2,847.6 | |
| North Texas | | 896.8 | | | 1,008.6 | |
| Corporate (1) | | 179.7 | | | 146.0 | |
| Total identifiable assets | | $ | 8,483.2 | | | $ | 8,550.9 | |
____________________________
(1)Accounts receivable and accrued revenue sold to the SPV for collateral under the AR Facility are included within the Permian, Louisiana, Oklahoma, and North Texas segments.
(16) Supplemental Cash Flow Information
The following schedule summarizes cash paid for interest, cash paid for income taxes, cash paid for finance leases included in cash flows from financing activities, cash paid for operating leases included in cash flows from operating activities, non-cash investing activities, and non-cash financing activities for the periods presented (in millions):
| | | | | | | | | | | | | | | | | | | | |
| | Year Ended December 31, |
| Supplemental disclosures of cash flow information: | | 2021 | | 2020 | | 2019 |
| Cash paid for interest | | $ | 208.8 | | | $ | 207.3 | | | $ | 218.9 | |
| Cash paid (refunded) for income taxes | | $ | 0.3 | | | $ | (0.7) | | | $ | 4.0 | |
| Cash paid for finance leases included in cash flows from financing activities | | $ | — | | | $ | — | | | $ | 1.2 | |
| Cash paid for operating leases included in cash flows from operating activities | | $ | 24.6 | | | $ | 24.6 | | | $ | 29.8 | |
| | | | | | |
| Non-cash investing activities: | | | | | | |
| Non-cash accrual of property and equipment | | $ | 12.0 | | | $ | (39.6) | | | $ | (6.5) | |
| Non-cash right-of-use assets obtained in exchange for operating lease liabilities | | $ | 18.7 | | | $ | 9.8 | | | $ | 104.1 | |
| Non-cash acquisitions | | $ | 16.9 | | | $ | — | | | $ | — | |
| | | | | | |
| Non-cash financing activities: | | | | | | |
| Receivable from sale of VEX | | $ | — | | | $ | 10.0 | | | $ | — | |
| Redemption of non-controlling interest | | $ | — | | | $ | (4.0) | | | $ | — | |
ENLINK MIDSTREAM, LLC AND SUBSIDIARIES
Notes to Consolidated Financial Statements (continued)
(17) Other Information
The following tables present additional detail for other current assets and other current liabilities, which consists of the following (in millions):
| | | | | | | | | | | | | | |
| Other current assets: | | December 31, 2021 | | December 31, 2020 |
| Natural gas and NGLs inventory | | $ | 49.4 | | | $ | 44.9 | |
| Prepaid expenses and other | | 34.2 | | | 13.8 | |
| Other current assets | | $ | 83.6 | | | $ | 58.7 | |
| | | | | | | | | | | | | | |
| Other current liabilities: | | December 31, 2021 | | December 31, 2020 |
| Accrued interest | | $ | 47.2 | | | $ | 35.7 | |
| Accrued wages and benefits, including taxes | | 33.1 | | | 22.5 | |
| Accrued ad valorem taxes | | 28.3 | | | 26.5 | |
| Capital expenditure accruals | | 23.2 | | | 10.6 | |
| Short-term lease liability | | 18.1 | | | 16.3 | |
| Installment payable (1) | | 10.0 | | | — | |
| Inactive easement commitment (2) | | 9.8 | | | — | |
| Operating expense accruals | | 9.6 | | | 8.4 | |
| Other | | 23.6 | | | 29.1 | |
| Other current liabilities | | $ | 202.9 | | | $ | 149.1 | |
____________________________
(1)Consideration paid for the acquisition of Amarillo Rattler, LLC included an installment payable to be paid on April 30, 2022.
(2)Amount related to inactive easements paid as utilized by us with the balance due in August 2022 if not utilized.
ENLINK MIDSTREAM, LLC AND SUBSIDIARIES
Notes to Consolidated Financial Statements (continued)
(18) Subsequent Event
Redemption of Series B Preferred Units. In January 2022, we redeemed 3,333,334 Series B Preferred Units for total consideration of $50.5 million plus accrued distributions. In addition, upon such redemption, a corresponding number of ENLC Class C Common Units were automatically cancelled. The redemption price represents 101% of the preferred units’ par value. In connection with the Series B Preferred Unit redemption, we have agreed with the holders of the Series B Preferred Units that we will pay cash in lieu of making a quarterly PIK distribution through the distribution declared for the fourth quarter of 2022.
Item 9. Changes in and Disagreements With Accountants on Accounting and Financial Disclosure
None.
Item 9A. Controls and Procedures
(a) Evaluation of Disclosure Controls and Procedures
Management of the Managing Member is responsible for establishing and maintaining adequate internal control over financial reporting and for the assessment of the effectiveness of internal control over financial reporting for us. We carried out an evaluation, under the supervision and with the participation of management, including the Chief Executive Officer and Chief Financial Officer of the Managing Member, of the effectiveness of our disclosure controls and procedures as of the end of the period covered by this report pursuant to Exchange Act Rules 13a-15 and 15d-15. Based on that evaluation, the Chief Executive Officer and Chief Financial Officer have concluded that, as of the end of the period covered by this report (December 31, 2021), our disclosure controls and procedures were effective to provide reasonable assurance that information required to be disclosed by us in the reports we file or submit under the Securities Exchange Act of 1934 is recorded, processed, summarized, and reported, within the time period specified in the applicable rules and forms, and that such information is accumulated and communicated to management, including our Chief Executive Officer and Chief Financial Officer, to allow timely decisions regarding disclosure. KPMG LLP, the independent registered public accounting firm that audited the Company’s consolidated financial statements included in this report, has issued an attestation report on the Company’s internal control over financial reporting, a copy of which appears in “Item 8. Financial Statements and Supplementary Data—Management’s Report on Internal Control over Financial Reporting.”
(b) Changes in Internal Control Over Financial Reporting
There has been no change in our internal control over financial reporting that occurred in the three months ended December 31, 2021 that has materially affected, or is reasonably likely to materially affect, our internal control over financial reporting.
Internal Control Over Financial Reporting
See “Item 8. Financial Statements and Supplementary Data—Management’s Report on Internal Control over Financial Reporting.”
Item 9B. Other Information
Disclosure Pursuant to Item 1.01 of Form 8-K – Entry into a Material Definitive Agreement.
On February 15, 2022, ENLC and each of GIP III Stetson I, L.P. and GIP III Stetson II, L.P., the holders of approximately 41.7%, in the aggregate, of the outstanding ENLC common units (together “GIP Entities”) and, in the case of GIP III Stetson I, L.P., the owner of all of the equity interests in the Managing Member, entered into a Unit Repurchase Agreement (the “Repurchase Agreement”) pursuant to which ENLC agreed to repurchase, on a quarterly basis, a number of ENLC common units held by the GIP Entities (the “GIP Units”) based upon the number of common units repurchased from public unitholders by ENLC during the applicable quarter under ENLC’s common unit repurchase program. Under the Repurchase Agreement, following each fiscal quarter beginning with the quarter ending March 31, 2022, ENLC will repurchase from the GIP Entities a number of GIP Units equal to (i) the aggregate number of common units repurchased by ENLC in the open market during such quarter (or from the period beginning on the execution date of the Repurchase Agreement for the quarter ending March 31, 2022), multiplied by (ii) a percentage such that the GIP Entities’ then-existing economic ownership percentage of outstanding ENLC common units is maintained after the open market repurchases are taken into account. The initial percentage will be adjusted each quarter, as necessary, so that the GIP Entities’ economic ownership interest will remain the same after giving effect to the open market repurchases. The per unit price ENLC will pay for the GIP Units will be the average per unit price paid by ENLC for the common units repurchased from public unitholders during the applicable quarter.
The repurchase of GIP Units by ENLC will occur one business day before ENLC’s reporting of earnings for such quarter. ENLC will disclose in its periodic reports filed with the Commission the number of GIP units purchased by ENLC with respect to each quarter.
The Repurchase Agreement will be terminated after the authorized funds under ENLC’s current $100 million common unit repurchase program have been expended, including funds applied to repurchases under the Repurchase Agreement, or otherwise upon the mutual agreement of the parties thereto.
The terms of the Repurchase Agreement were unanimously approved by the Board and, based upon the related party nature of the Repurchase Agreement with the GIP Entities, the Conflicts Committee of the Board.
The foregoing description of the Repurchase Agreement does not purport to be complete and is qualified in its entirety by reference to the full text of the Repurchase Agreement, a copy of which is filed as Exhibit 10.20 to this report and is incorporated herein by reference. For more information on ENLC’s common unit repurchase program, see “Item 5—Market for Registrant’s Common Equity, Related Unitholder Matters, and Issuer Purchases of Equity Securities—Purchases of Equity Securities,” in this report.
PART III
Item 10. Directors, Executive Officers, and Corporate Governance
We are managed by the board of directors and executive officers of the Managing Member. The Managing Member is not elected by our unitholders and will not be subject to re-election by our unitholders in the future. The Managing Member has a board of directors, and our common unitholders are not entitled to elect the directors or to participate directly or indirectly in our management or operations. Our operational personnel are employees of the Operating Partnership. References to our officers, directors, and employees are references to the officers, directors, and employees of the Managing Member or the Operating Partnership.
The following table shows information for the members of the Board of Directors of the Managing Member (the “Board”) and the executive officers of the Managing Member. Executive officers and directors serve until their successors are duly appointed or elected.
| | | | | | | | | | | | | | |
| Name | | Age | | Position with EnLink Midstream Manager, LLC |
| Barry E. Davis | | 60 | | Chairman and Chief Executive Officer |
| Benjamin D. Lamb | | 42 | | Executive Vice President and Chief Operating Officer |
| Pablo G. Mercado | | 45 | | Executive Vice President and Chief Financial Officer |
| Alaina K. Brooks | | 47 | | Executive Vice President, Chief Legal and Administrative Officer, and Secretary |
| Deborah G. Adams (1) | | 61 | | Director and Member of the Audit and Sustainability (2) Committees |
| William J. Brilliant | | 46 | | Director and Member of the Governance and Compensation Committee |
| Tiffany Thom Cepak (1) | | 48 | | Director and Member of the Audit and Conflicts Committees |
| Leldon E. Echols (1) | | 66 | | Director and Member of the Governance and Compensation and Audit (2) Committees |
| Thomas W. Horton | | 60 | | Director |
| James K. Lee | | 40 | | Director |
| Scott E. Telesz | | 54 | | Director and Member of the Sustainability Committee |
| Kyle D. Vann (1) | | 74 | | Director and Member of the Conflicts (2) and Governance and Compensation (2) Committees |
____________________________
(1)Independent director.
(2)Chairperson of committee.
Barry E. Davis, Chairman and Chief Executive Officer, has served in this position since August 2019, after serving as Executive Chairman from January 2018 to August 2019, as Chairman and Chief Executive Officer from September 2016 until January 2018, and as President and Chief Executive Officer from our formation until September 2016. Mr. Davis has held management roles in the energy industry since 1984. Mr. Davis led our predecessor, Crosstex Energy, from its founding in 1996 through its merger with Devon to create ENLC. During this time, Crosstex Energy completed the initial public offerings of Crosstex Energy, L.P. in 2002 and Crosstex Energy, Inc. in 2004. Crosstex Energy was formed in 1996 when Mr. Davis led the management buyout of the midstream assets of Comstock Natural Gas, Inc., a subsidiary of Comstock Resources, Inc. Prior to the formation of Crosstex Energy, Mr. Davis was President and Chief Operating Officer of Comstock Natural Gas and founder of Ventana Natural Gas, a gas marketing and pipeline company that was purchased by Comstock Natural Gas. In addition to serving on our Board of Directors, Mr. Davis is a Trustee of Texas Christian University (TCU) and a board member of the Kirby Corp. and several other civic and nonprofit organizations. Mr. Davis is a member and former president of the Natural Gas and Electric Power Society, Dallas Wildcat Committee, and the Dallas Petroleum Club, as well as a member of the World Presidents Organization and the National Petroleum Council. Mr. Davis holds a Bachelor of Business Administration in Finance from Texas Christian University. Mr. Davis’s leadership skills and experience in the midstream natural gas industry, among other factors, led the Board to conclude that he should serve as a director.
Benjamin D. Lamb, Executive Vice President and Chief Operating Officer, has served in this position since June 2018. Mr. Lamb previously served in a number of leadership roles, most recently as Executive Vice President—North Texas and Oklahoma from February 2018 to June 2018 and previously as Executive Vice President—Corporate Development, Senior Vice President—Finance and Corporate Development, and Vice President—Finance from December 2012 to February 2018. Prior to December 2012, Mr. Lamb served as a Principal at the investment banking firm Greenhill & Co., which he joined in 2005. In that role, he focused on the evaluation and execution of mergers, acquisitions, and restructuring transactions for clients primarily in the midstream energy, power, and utility industries. Prior to joining Greenhill, he served as an investment banker at
UBS Investment Bank in its Mergers and Acquisitions Group and in its Global Energy Group, and at Merrill Lynch in its Global Energy and Power Group. Mr. Lamb received his Bachelor of Business Administration from Baylor University in 2000.
Pablo G. Mercado, Executive Vice President and Chief Financial Officer, has served in this position since July 2020. Prior to July 2020, Mr. Mercado served as Senior Vice President and Chief Financial Officer of Forum Energy Technologies, Inc. (“Forum Energy”) from March 2018 to July 2020. Mr. Mercado also previously held various finance and corporate development positions at Forum Energy since joining in November 2011, including Senior Vice President, Finance from June 2017 to March 2018 and Vice President, Operations Finance from August 2015 to June 2017. Prior to Forum Energy, Mr. Mercado was as an investment banker with the Oil and Gas Group of Credit Suisse from 2005 to October 2011. Between 1998 and 2005, Mr. Mercado was an investment banker at UBS Investment Bank and Bank of America Merrill Lynch, working primarily with companies in the oil and gas industry. Mr. Mercado holds a Bachelor of Business Administration and a Bachelor of Arts in Economics from Southern Methodist University and a Master of Business Administration from The University of Chicago Booth School of Business. He currently serves on the Board of Directors of Comfort Systems USA, Inc. as the chair of the Audit Committee and a member of the Governance Committee and on the Board of Directors of the Energy Infrastructure Council, a non-profit trade association for companies that develop and operate energy infrastructure.
Alaina K. Brooks, Executive Vice President, Chief Legal and Administrative Officer, and Secretary, has served in this position since June 2018. Ms. Brooks was appointed as a director of the General Partner in January 2019. Ms. Brooks previously served in a number of our leadership roles, most recently as Senior Vice President, General Counsel and Secretary from September 2014 until June 2018 and as Deputy General Counsel until September 2014. In Ms. Brooks’ current role, she serves on our Executive Leadership Team and leads the legal, regulatory, public and industry affairs, contract administration, and human resources functions. Prior to 2008, Ms. Brooks practiced law at Weil, Gotshal & Manges LLP and Baker Botts L.L.P., where she counseled clients on matters of complex commercial litigation, risk management, and taxation. Ms. Brooks is a licensed Certified Public Accountant and holds a Juris Doctor from Duke University School of Law and Bachelor of Science and Master of Science in accounting from Oklahoma State University.
Deborah G. Adams has served as a director of the Managing Member since February 2020. Ms. Adams served on the Executive Leadership Team at Phillips 66 as Senior Vice President of Health, Safety, and Environment, Projects and Procurement from 2014 until her retirement in October 2016. Ms. Adams previously served as Division President, Transportation for Phillips 66 and ConocoPhilipps from 2008 to 2014. Prior to this time, Ms. Adams held various leadership positions at ConocoPhillips, including Chief Procurement Officer, General Manager, International Refining, and Manager, Global Downstream Information Systems. She has also served on several of ConocoPhillips’ joint venture boards. Ms. Adams currently serves as a director of MRC Global, Inc. and Austin Industries, an employee-owned construction company. Ms. Adams previously served as a director of Gulfport Energy Corporation from March 2018 until May 2021. Ms. Adams has also served as a member of the Oklahoma State University Foundation Board of Trustees and on the University’s Board of Governors. In 2014, she was inducted into the Oklahoma State University College of Engineering, Architecture and Technology Hall of Fame, and in 2015, the National Diversity Council named Adams to the list of the Top 50 Most Powerful Women in Oil and Gas. Ms. Adams received a Bachelor of Science in chemical engineering from Oklahoma State University. Ms. Adams was selected to serve as a director due to, among other factors, her extensive experience in the energy sector, including midstream, her leadership skills and her business experience, including her expertise in a wide range of operational areas.
William J. Brilliant has served as a director of the Managing Member since July 2018. Mr. Brilliant served as a director of the General Partner from July 2018 until January 2019. Mr. Brilliant is a Partner and leader of GIP’s energy investment business. Mr. Brilliant is a member of GIP’s Investment and Operating Committees and has been a member of GIP’s investment team since 2007. Prior to joining GIP, he was an investment banker at Lehman Brothers. Mr. Brilliant currently serves on the boards of directors of Hess Midstream Partners GP LLC and Hess Infrastructure Partners. He previously served as a director of the general partner of Access Midstream Partners L.P. from June 2012 through July 2014. Mr. Brilliant holds a B.A. from the University of California at Los Angeles and an M.B.A. from the Wharton School of the University of Pennsylvania. Mr. Brilliant was selected to serve as a director due to, among other factors, his energy industry background, particularly his expertise in mergers and acquisitions.
Tiffany Thom Cepak has served as a director of the Managing Member since December 2021. Ms. Cepak most recently served as the Chief Financial Officer of Energy XXI Gulf Coast, Inc., an oil and natural gas development and production company, until its sale in October 2018. She also served as the Chief Financial Officer of KLR Energy Acquisition Corp. (and, subsequent to its business combination, Rosehill Resources Inc.) and as Chief Financial Officer of EPL Oil & Gas, Inc. She previously held a number of other positions with EPL, including Treasurer, Director of Investor Relations, and Director of Corporate Reserves. She began her career as a Senior Reservoir Engineer with Exxon Production Co. and Exxon Mobil Co. with operational roles, including reservoir and subsurface completion engineering. Ms. Cepak currently serves on the board of directors of Ranger Oil Corp., Patterson-UTI Energy, Inc., and California Resources Corp., where she serves as Board Chair,
and previously served as a director of Yates Petroleum Corp. She holds a Bachelor of Science in engineering from the University of Illinois and a Master of Business Administration from Tulane University. Ms. Cepak was selected to serve as a director due to, among other factors, her extensive experience in the energy sector and her engineering, operational, and finance experience.
Leldon E. Echols has served as a director of the Managing Member since March 2014. Mr. Echols joined Crosstex Energy, Inc, the predecessor to ENLC, as a director in January 2008. Mr. Echols served as a director of the General Partner from March 2014 until January 2019. Mr. Echols is a private investor. Mr. Echols also currently serves as an independent director of Trinity Industries, Inc. and HollyFrontier Corporation. Mr. Echols brings over 30 years of financial and business experience to the Board. After 22 years with the accounting firm Arthur Andersen LLP, which included serving as managing partner of the firm’s audit and business advisory practice in North Texas, Colorado, and Oklahoma, Mr. Echols spent six years with Centex Corporation as executive vice president and chief financial officer. He retired from Centex Corporation in June 2006. Mr. Echols previously served as a member of the board of directors of Roofing Supply Group Holdings, Inc., a private company. He also served on the board of TXU Corporation where he chaired the Audit Committee and was a member of the Strategic Transactions Committee until the completion of the private equity buyout of TXU in October 2007. Mr. Echols earned a Bachelor of Science in accounting from Arkansas State University. He is a member of the American Institute of Certified Public Accountants and the Texas Society of CPAs. Mr. Echols was selected to serve as a director due to his accounting and financial experience and service as the chief financial officer for another public company, among other factors.
Thomas W. Horton has served as a director of the Managing Member since August 2019. Mr. Horton is a Partner at GIP. Prior to joining GIP, Mr. Horton was a senior advisor at Warburg Pincus, LLC, a private equity firm from 2015 to 2019. He was the chairman of American Airlines Group Inc. from 2013 to 2014 and chairman, president, and chief executive officer of American Airlines Inc. and AMR Corp. from 2011 to 2013 after being named president of American Airlines in 2010. Previously, he served as executive vice president and chief financial officer of AMR and American Airlines from 2006 to 2010 and vice chairman and chief financial officer of AT&T Corp. from 2002 to 2006. Mr. Horton currently serves as a director of General Electric Co. and Walmart Inc. He also serves on the executive board of the Cox School of Business at Southern Methodist University. Mr. Horton was selected to serve as a director due to, among other factors, his extensive executive and financial experience, business expertise, and leadership skills.
James K. Lee has served as a director of the Managing Member since February 2020. Mr. Lee is an Investment Principal at GIP and a key member of GIP’s North American energy investment business. Mr. Lee has been a member of GIP’s investment team since 2009. Prior to joining GIP, Mr. Lee was an investment banker at Goldman Sachs & Co. Mr. Lee previously served on the Board of Directors of Competitive Power Ventures, a privately held electric power generation development and asset management company. Mr. Lee holds a Bachelor of Commerce (Honors and University Medal) and a Bachelor of Laws from the University of New South Wales. Mr. Lee was selected to serve as a director due to, among other factors, his energy industry background and his banking and financial experience.
Scott E. Telesz has served as a director of the Managing Member since December 2020. Mr. Telesz is an Operating Partner of GIP and has over 25 years of experience in the manufacturing industry. Prior to joining GIP in August 2018, he spent 8 years as an executive at Praxair, an industrial gas manufacturing company, most recently as executive vice president in charge of Praxair’s U.S. atmospheric gases businesses, Praxair Canada and Praxair Surface Technologies from 2014 until May 2018. Before joining Praxair, Mr. Telesz spent 12 years at GE/SABIC where he ran various electrical products and plastics businesses. He currently serves on the board of directors of Hess Midstream GP LLC and of Edinburgh Airport. Mr. Telesz also serves on the Board of Visitors of Duke University’s Pratt School of Engineering. He earned a Bachelor of Science in electrical engineering from Duke University in 1989 and a Master of Business Administration from Harvard Business School in 1994. Mr. Telesz was selected to serve as a director due to, among other factors, his extensive executive and business expertise, his engineering background, and his leadership skills.
Kyle D. Vann has served as a director of the Managing Member since January 2019 and served as a director of the General Partner from April 2016 until January 2019. Mr. Vann began his career with Exxon Corporation in 1969. After ten years at Exxon, he joined Koch Industries and served in various leadership capacities, including senior vice president from 1995-2000. In 2001, he then took on the role of CEO of Entergy-Koch, LP, an energy trading and transportation company, which was sold in 2004. Mr. Vann consulted with Entergy until 2020 and was an executive advisor to CCMP Capital Advisors, LLC from 2012-2017. He also serves on the board of directors of Ecovyst, Inc. and is on the advisory boards of Texon, L.P. and Refined Technologies, Inc. He also serves as a director on the Boards of Mars Hill Productions and Generous Giving, which are private, charitable non-profits. Mr. Vann graduated from the University of Kansas with a Bachelor of Science in chemical engineering. He is a member of the Board of Advisors for the University of Kansas School of Engineering (where he was a recipient of the Distinguished Engineering Service Award). Mr. Vann was selected to serve as a director due to his extensive experience in the energy industry and his business expertise, among other factors.
Independent Directors
Because we are a “controlled company” within the meaning of the NYSE rules, the NYSE does not require the Board to be composed of a majority of directors who meet the criteria for independence required by the NYSE or to maintain nominating/corporate governance and compensation committees composed entirely of independent directors. Our Board has adopted Governance Guidelines that require at least three members of our Board to be independent directors as defined by the rules of the NYSE.
For a director to be “independent” under the NYSE standards, the Board must affirmatively determine that the director has no material relationship with the Company (either directly or as a partner, shareholder or officer of any organization that has a relationship with the Company, other than in his or her capacity as a director of the Company). In addition, the director must meet certain independence standards specified by the NYSE, including a requirement that the director was not employed by the Managing Member or engaged in certain business dealings with the Managing Member. Using these standards for determining independence, the Board has determined that Messrs. Vann and Echols and Mses. Adams and Cepak qualify as “independent” directors.
In addition, the members of the Audit Committee of our Board each qualify as “independent” under special standards established by the Commission for members of audit committees, and the Audit Committee includes at least one member who is determined by our Board to meet the qualifications of an “audit committee financial expert” in accordance with Commission rules, including that the person meets the relevant definition of an “independent” director. Mr. Echols is an independent director who has been determined to be an audit committee financial expert. Unitholders should understand that this designation is a disclosure requirement of the Commission related to the experience and understanding of the individual with respect to certain accounting and auditing matters. The designation does not impose on such director any duties, obligations, or liabilities that are greater than are generally imposed on the director as a member of the Audit Committee and the Board, and the designation of a director as an audit committee financial expert pursuant to this Commission requirement does not affect the duties, obligations, or liabilities of any other member of the Audit Committee or the Board.
Board Committees
The Board has four standing committees: the Audit Committee, the Conflicts Committee, the Governance and Compensation Committee, and the Sustainability Committee. Each member of the Audit Committee is an independent director in accordance with the NYSE standards described above. Each of the Board committees has a written charter approved by the Board. Copies of the charters and our Code of Business Conduct and Ethics are available to any person, free of charge, at our website: www.enlink.com.
The Audit Committee, comprised of Mr. Echols (chair) and Mses. Adams and Cepak, assists the Board in its general oversight of our financial reporting, internal controls, and audit functions, and is directly responsible for the appointment, retention, compensation, and oversight of the work of our independent auditors.
The Conflicts Committee, comprised of Mr. Vann (chair) and Ms. Cepak, reviews specific matters that the Board believes may involve conflicts of interest. The Conflicts Committee determines if the resolution of a conflict of interest is fair and reasonable to us. The members of the Conflicts Committee are not directors, officers, or employees of the General Partner. Any matters approved by the Conflicts Committee will be conclusively deemed to be fair and reasonable to us, approved by all of our unitholders, and not a breach by our Managing Member of any duties owed to us or our unitholders.
The Governance and Compensation Committee, comprised of Messrs. Vann (chair), Brilliant, and Echols, reviews matters involving governance, including assessing the effectiveness of current policies, monitoring industry developments, and overseeing certain compensation decisions as well as the compensation plans described herein.
The Sustainability Committee, comprised of Ms. Adams (chair) and Mr. Telesz, assists the Board in its general oversight of our environmental, social and governance initiatives, including our environmental, health and safety and operational excellence initiatives, and also provides oversight with respect to identifying, evaluating and monitoring of risks associated with such matters.
Executive Sessions
The non-management directors meet in executive session without management participation at least quarterly. The non-management directors present at such executive sessions designate a director to preside at such meetings (the “Presiding Non-Management Director”). Unitholders or interested parties may communicate with non-management directors by sending written communications to the following address to the attention of the Presiding Non-Management Director: EnLink Midstream Manager, LLC, 1722 Routh St., Suite 1300, Dallas, Texas 75201.
Code of Ethics and Governance Guidelines
We adopted a Code of Business Conduct and Ethics (the “Code of Ethics”) applicable to all of our employees, officers, and directors with regard to company-related activities. The Code of Ethics incorporates guidelines designed to deter wrongdoing and to promote honest and ethical conduct and compliance with applicable laws and regulations. It also incorporates expectations of our employees that enable us to provide accurate and timely disclosure in our filings with the Commission and other public communications. We also adopted Governance Guidelines (the “Governance Guidelines”) that outline the important policies and practices regarding our governance and provide an effective framework for the functioning of our Board. A copy of the Code of Ethics and the Governance Guidelines are available to any person, free of charge, within the “Governance Documents” subsection of the “Corporate Governance” section of the investors section of our website at www.enlink.com. If any substantive amendments are made to the Code of Ethics or if we grant any waiver, including any implicit waiver, from a provision of the Code of Ethics to any of our executive officers and directors, we will disclose the nature of such amendment or waiver on our website. The information contained on, or connected to, our website is not incorporated by reference into this Annual Report on Form 10-K and should not be considered part of this or any other report that we file with or furnish to the Commission.
Item 11. Executive Compensation
Governance and Compensation Committee Report
Kyle D. Vann and Leldon E. Echols, who serve on the Governance and Compensation Committee of our Managing Member (the “Committee”), are independent directors in accordance with NYSE standards. The Committee has reviewed and discussed with management the following section titled “Compensation Discussion and Analysis.” Based upon its review and discussions, the Committee has recommended to the Board that the Compensation Discussion and Analysis be included in this Annual Report on Form 10-K.
By the Members of the Committee:
Kyle D. Vann (chair)
William J. Brilliant
Leldon E. Echols
Compensation Discussion and Analysis
The following Compensation Discussion and Analysis provides an overview of the philosophy and objectives of our executive compensation program. It explains how compensation decisions are linked to performance with respect to our strategic goals and defined targets under the elements of the compensation program. These goals and targets are disclosed in the limited context of our compensation programs and should not be understood to be statements of management’s expectations or estimates of results or other guidance.
Overview
We do not directly employ any of the persons responsible for managing our business. The Managing Member manages our operations and activities, and the Board and officers make decisions on our behalf. The compensation of the named executive officers and directors of the Managing Member is determined by the Board upon the recommendation of the Committee. Our named executive officers also serve as named executive officers of EnLink Midstream GP, LLC, the General Partner. Therefore, the compensation of the named executive officers discussed below reflects total compensation for services with respect to us and all our subsidiaries.
Compensation Philosophy and Principles
Our executive compensation program is designed to attract, retain, and motivate highly qualified executives and align their individual interests with the interests of our unitholders. It is the Committee’s responsibility to design and administer compensation programs that achieve these goals, and to make recommendations to the Board to approve and adopt these programs. The total compensation of each of our executives is generally comprised of 60% equity-based awards issued under our long-term incentive plan, 20% annual bonus awarded under the Short-Term Incentive Program (the “STI Program”), and 20% base salary.
The Committee considers the following principles in determining the total compensation of the named executive officers:
•Base salary, short-term incentives, and long-term incentives should be competitive with the market in which we compete for executive talent in order to attract, retain, and motivate highly qualified executives;
•Equity-based awards under the long-term incentive plan should represent a significant portion of the executive’s total compensation in order to retain and incentivize highly qualified executives and to ensure all executives have a meaningful equity stake in us. Equity-based awards foster a culture of ownership and are a way to align the interests of executives with those of our unitholders;
•The compensation program should be sufficiently flexible to address special circumstances, including retention initiatives specifically targeted to retain highly qualified executives during challenging times; and
•The compensation program should drive performance and reward contributions in support of our business strategies and achievements.
Compensation Methodology
The Committee annually reviews our executive compensation program and each individual element of compensation. The review includes an analysis of the compensation practices of other companies in our industry, the competitive market for executive talent, the evolving demands of the business, the specific challenges that we may face, and individual and group contributions made by our executives to us and the Managing Member. The Committee recommended to the Board adjustments to the compensation program and to each individual element as determined necessary to achieve our goals. The Committee retains a compensation consultant to assist in its review and to provide input regarding the compensation program and each individual element.
Role of Compensation Consultant
The Committee retained Mercer (US) Inc., (“Mercer”) as its independent compensation consultant to advise the Committee on certain matters relating to compensation programs applicable to the named executive officers and other employees of the General Partner during 2021. In particular, Mercer assisted in the Committee’s overall decision-making process with respect to named executive officers and director compensation matters, including providing advice on our executive pay philosophy, compensation peer group, incentive plan design, and employment agreement design, providing competitive market studies, and informing the Committee about emerging best practices and changes in the regulatory and governance environment. Mercer’s work for the Committee did not raise any conflicts of interest in 2021.
Role of Peer Group and Benchmarking
The Committee and Mercer collaborated to identify the following companies as our peer companies in 2021: Crestwood Equity Partners, L.P., DCP Midstream, L.P., Enable Midstream Partners, LP, Equitrans Midstream Corporation, Genesis Energy, L.P., Magellan Midstream Partners, L.P., MPLX, L.P., NuStar Energy L.P., ONEOK Inc., and Targa Resources Corp. (the “Peer Group”). The Committee believes the Peer Group is representative of the industry in which we operate. The individual companies were chosen based on a number of factors, including each company’s relative size/market capitalization, relative complexity of its business, similar organizational structure, competition for similar executive talent, and the roles and responsibilities of its named executive officers. The Committee considers the Peer Group companies annually, and historically there have been few changes from year to year. Companies are typically added or removed from the Peer Group as the result of a change in organizational structure or relative size/market capitalization as compared to us.
When evaluating annual compensation levels for each named executive officer, the Committee, with the assistance of the compensation consultant, reviews compensation surveys and publicly available compensation data for executives in our Peer Group, including data on base salaries, annual bonuses, and long-term equity incentive awards. The Committee then uses that information to determine individual elements of compensation for the named executive officers in the context of their roles, levels of responsibility, accountability, and decision-making authority within our organization and in the context of company size relative to the other Peer Group members. In addition, the compensation consultant provides guidance on current industry trends and best practices to the Committee relating to all aspects of executive compensation.
While compensation surveys and Peer Group data are considered, the Committee does not attempt to set compensation elements to meet specific benchmarks. Accordingly, other subjective factors are also considered in setting compensation elements, including, but not limited to, (i) effort and accomplishment on a group and individual basis, (ii) challenges faced and challenges overcome, (iii) unique skills, (iv) contribution to the management team, (v) succession planning and retention of our executive officers, and (vi) the perception of both the Board and the Committee of our performance relative to expectations and actual market/business conditions.
Elements of Compensation
For fiscal year 2021, the principal elements of compensation for the named executive officers were the following:
•base salary;
•annual bonus awards;
•long-term incentive plan equity awards;
•retirement and health benefits; and
•severance and change of control benefits.
The Committee reviews and makes recommendations regarding the mix of compensation, both among short- and long-term compensation and cash and non-cash compensation, to establish structures that it believes are appropriate for each of the named executive officers. We believe that the mix of base salary, annual bonus awards, long-term incentive plan equity awards, retirement and health benefits, severance and change of control benefits, and perquisites and other compensation fit our overall compensation objectives. We believe this mix of compensation provides opportunities to align and drive performance of our named executive officers in support of our strategic objectives and to attract, retain, and motivate highly qualified talent with the skills and competencies that we require.
Base Salary. The Committee recommends base salaries for the named executive officers based on the historical salaries for services rendered to us and our affiliates, Peer Group data provided by the compensation consultant, compensation surveys, and performance and responsibilities of the named executive officers. The base salaries approved by the Board and paid to our named executive officers for fiscal year 2021 (and payable for fiscal 2022 beginning in March) are as follows:
| | | | | | | | | | | | | | | | | |
| 2021 Base Salary | | Base Salary Effective
March 2022 | | Percent Increase (Decrease) |
| Barry E. Davis | $ | 750,000 | | | $ | 784,000 | | | 4.5 | % |
| Benjamin D. Lamb | $ | 507,000 | | | $ | 530,000 | | | 4.5 | % |
| Pablo G. Mercado | $ | 465,000 | | | $ | 486,000 | | | 4.5 | % |
| Alaina K. Brooks | $ | 465,000 | | | $ | 486,000 | | | 4.5 | % |
Bonus Awards. The Board and the Committee oversee the STI Program. All employees, including named executive officers, are eligible to receive annual bonuses under the STI Program. Bonuses awarded to employees and named executive officers under the STI Program are based on the achievement of certain metrics established to measure success and are subject to the discretion of the Board and the Committee. The metrics employed by the STI Program contemplate that bonuses may be
earned based primarily upon the achievement of certain core goals (collectively, the “Primary Bonus Components”), which may change from year-to-year. For 2021, the STI program included the following Primary Bonus Components:
•Financial. Adjusted EBITDA and free cash flow after distributions (“FCFAD”) to maximize financial performance.
•Capital Projects. Timely and cost-effective capital projects.
•Operational. Efficient use of systems, assets, and equipment for meeting contractual obligations, driving customer service, and maximizing cash flow.
•Safety and Sustainability. Prevention of safety incidents and improvement in safety compliance and training, commitment to environmental compliance, and support of our initiative for more sustainable operations.
As reflected in the table below, a separate weighting and associated threshold/target/maximum is applied for each of the Primary Bonus Components. The weighting for each 2021 Primary Bonus Component and associated information are as follows:
| | | | | | | | | | | | | | | | | | | | | | | | | | |
| Component | | Weighting | | Threshold Level | | Target Level | | Maximum Level |
| Financial - Adjusted EBITDA | | 55% | | $867 million | | $958 million | | $1,042 million |
| Financial - FCFAD | | 10% | | $205 million | | $256 million | | $300 million |
| Operational | | 15% | | Operational Scorecard |
| Safety and Sustainability | | 15% | | Safety and Sustainability Scorecard |
| Capital Projects | | 5% | | Timely and cost-effective capital projects |
| Total Weighting | | 100% | | | | | | |
Each year, performance under the Primary Bonus Components will be measured, as applicable, on an interpolated “threshold/target/maximum” basis. Actual performance below the threshold level results in 0% of target, performance at threshold level results in 50% of target, and performance at the maximum level or higher are capped at 200% of target achievement for that component. Each year, a range of bonus pool values for the STI Program will be established to account for various levels of performance under the Primary Bonus Components, as applied on a weighted average basis. These bonus pool values are a framework and are subject to the application of the discretion of the Board and the Committee to determine the bonus amounts that are ultimately payable under the STI Program, including to the named executive officers, as further described below.
The Committee and the Board, with input from management, set the annual weightings for each Primary Bonus Component, any additional weightings that apply with respect to the features comprising a particular Primary Bonus Component, and the “threshold/target/maximum” standard that applies to the Primary Bonus Components. This standard is based on a number of considerations, including, but not limited to, reasonable market expectations, internal company forecasts, available growth opportunities, company performance, leading indicators, and industry standards.
The Board, based on recommendations of the Committee, initially establishes the target bonus awards that may be earned and ultimately determines the final bonus amounts, if any, that are payable under the STI Program for the named executive officers. Initial bonus award amounts for consideration by the Committee and the Board for the named executive officers will be established by multiplying (i) the relevant named executive officer’s target bonus percentage by (ii) the relevant named executive officer’s base salary earnings for the applicable year (subject to certain adjustments to account for, among other things, mid-year changes in base salary or a mid-year hiring or termination) by (iii) the achievement percentage for the relevant year.
The Committee believes that a portion of executive compensation for named executive officers must remain discretionary. Therefore, the STI Program contemplates that the Committee and the Board retain discretion with respect to target bonus awards and the final bonus amounts for named executive officers. In this regard, the Committee may exercise such discretion to recommend to the Board a reduction or increase of the target bonus or the final bonus amounts for a particular named executive officer to reward or address extraordinary individual performance, challenges, and opportunities not reasonably foreseeable at the beginning of a performance period, internal equities, and external competition or opportunities.
The final amount of bonus for each named executive officer is approved by the Board based upon the Committee’s recommendation and assessment of whether such officer met his or her personal performance objectives established at the beginning of the performance period. These performance objectives include the quality of leadership within the named executive officer’s assigned area of responsibility, the achievement of technical and professional proficiencies by the named executive officer, the execution of identified priority objectives by the named executive officer, and the named executive officer’s contribution to, and enhancement of, the desired company culture. These performance objectives are reviewed and evaluated by the Committee as a whole. All named executive officers met or exceeded their minimum personal performance objectives for 2021. Accordingly, the Committee and the Board awarded bonuses to the named executive officers as follows:
| | | | | | | | | | | | | | | | | |
| Target Bonus Percentage
(as a % of Base Salary) | | 2021 Bonus (as a % of Base Salary) | | 2021 Bonus Amount ($) |
| Barry E. Davis | 125 | % | | 206.3 | % | | $ | 1,546,994 | |
| Benjamin D. Lamb | 100 | % | | 168.2 | % | | $ | 852,735 | |
| Pablo G. Mercado | 90 | % | | 151.4 | % | | $ | 703,890 | |
| Alaina K. Brooks | 90 | % | | 151.4 | % | | $ | 703,948 | |
Long-Term Incentive Plan. Our named executive officers and outside directors are also eligible to participate in the EnLink Midstream, LLC 2014 Long-Term Incentive Plan (the “2014 Plan”). The Board, upon the recommendation of the Committee, approves the grants of equity awards to our named executive officers. The Committee believes that equity awards should comprise a significant portion of a named executive officer’s total compensation. A number of factors are considered when determining grants to each individual named executive officer including but not limited to: compensation surveys, Peer Group data, the named executive officer’s performance on a group and individual basis, company performance, market conditions, succession planning, retention, and other factors as determined by the Committee and/or the Board.
Employees, non-employee directors, and other individuals who provide services to us or our affiliates may be eligible to receive awards under the 2014 Plan. The Committee determines which eligible individuals receive awards under the 2014 Plan, subject to the Board’s approval of awards to our named executive officers. The 2014 Plan is administered by the Committee and permits the grant of cash and equity-based awards, which may be awarded in the form of options, restricted unit awards, restricted incentive units, unit appreciation rights (“UARs”), distribution equivalent rights (“DERs”), unit awards, cash awards, and performance awards. At the time of adoption of the 2014 Plan, 11,000,000 common units representing limited liability company interests in ENLC were initially reserved for issuance pursuant to awards under the 2014 Plan. In subsequent years, the 2014 Plan has been amended and restated, resulting in an increase to the number of common units reserved for issuance thereunder. As of December 31, 2021, 25,608,795 common units remain eligible for future grants. Common units subject to an award under the 2014 Plan that are canceled, forfeited, exchanged, settled in cash, or otherwise terminated, including withheld to satisfy exercise prices or tax withholding obligations, will again become available for delivery pursuant to other awards under the 2014 Plan.
In general, the 2014 Plan is administered by the Committee. With respect to application of the 2014 Plan to non-employee directors, the 2014 Plan is administered by the Board. The Committee generally has the sole discretion to determine which eligible individuals receive awards under the 2014 Plan, subject to the review of the Board of awards to our executive officers, and the Board has such discretion with respect to which eligible non-employee directors receive awards under 2014 Plan. The 2014 Plan, as currently amended and restated, will automatically expire on September 17, 2030. The Board may amend or terminate the 2014 Plan at any time, subject to any requirement of unitholder approval required by applicable law, rule, or regulation. The Committee may generally amend the terms of any outstanding award under the 2014 Plan at any time. However, no action may be taken by the Board or the Committee under the 2014 Plan that would materially and adversely affect the rights of a participant under a previously granted award without the participant’s consent.
Performance Unit Awards. Our performance-based award agreements (the “Performance-Based Award Agreements”) provide for future awards of equity-based compensation under the 2014 Plan. Since 2019, the Performance-Based Award Agreements have provided that the vesting of restricted incentive units under the 2014 Plan is dependent on (i) our TSR performance relative to the TSR performance of a peer group of companies and (ii) our cash flow performance. At the time of grant, the Board will determine the relative weighting of the two performance goals by including in the relevant Performance-Based Award Agreement the number of restricted incentive units that will be eligible for vesting depending on the achievement of the TSR performance goals (the “Total TSR Units”) and the achievement of the Cash Flow performance goals (the “Total CF Units”). Since, 2019, our Performance-Based Award Agreements have been weighted so that Total TSR Units represent 80% of the number of available restricted incentive units and Total CF Units represent 20% of the available restricted incentive units.
The Performance-Based Award Agreement provides for four separate performance periods: (i) three performance periods are each of the first, second, and third calendar years that occur following the vesting commencement date of the Performance-Based Award Agreement and (ii) the fourth performance period is the cumulative three-year period from the vesting commencement date through the third anniversary thereof (the “Cumulative Performance Period”).
Approximately one-fourth of the Total TSR Units (the “Tranche TSR Units”) relates to the Cumulative Performance Period and each of the first three performance periods described below. The following table sets out the levels at which the Tranche TSR Units may vest (using linear interpolation) based on the TSR percentile ranking for the applicable performance period relative to the TSR achievement of the Designated Peer Companies:
| | | | | | | | | | | | | | |
| Performance Level | | Achieved TSR
Position Relative to Designated Peer Companies | | Vesting percentage
of the Tranche TSR Units |
| Below Threshold | | Less than 25% | | 0% |
| Threshold | | Equal to 25% | | 50% |
| Target | | Equal to 50% | | 100% |
| Maximum | | Greater than or Equal to 75% | | 200% |
Approximately one-third of the Total CF Units (the “Tranche CF Units”) relates to each of the first three performance periods described above (i.e., the Cash Flow performance goal does not relate to the Cumulative Performance Period). The Board will establish the Cash Flow performance targets for purposes of the column in the table below titled “ENLC’s Achieved Cash Flow” for each performance period no later than March 31 of the year in which the relevant performance period begins. Following the end date of a given performance period, the Committee will measure and determine the Cash Flow performance of ENLC to determine the Tranche CF Units that are eligible to vest, subject to the grantee’s continued employment or service with ENLC or its affiliates through the end of the Cumulative Performance Period. In short, the Performance-Based Award Agreement defines Cash Flow for a given performance period as (A)(i) ENLC’s adjusted EBITDA minus (ii) interest expense, current taxes and other, maintenance capital expenditures, and preferred unit accrued distributions divided by (B) the time-weighted average number of ENLC’s common units outstanding during the relevant performance period.
In 2021, the Board adopted the metric FCFAD as the cash flow performance goal in the Performance-Based Award Agreement rather than the previously used distributable cash flow per unit. The following table sets out the levels at which the Tranche CF Units were eligible to vest (using linear interpolation) based on the FCFAD performance of ENLC for the performance period ending December 31, 2021:
| | | | | | | | | | | | | | |
| Performance Level | | ENLC’s Achieved FCFAD | | Vesting percentage
of the Tranche CF Units |
| Below Threshold | | Less than $205 million | | 0% |
| Threshold | | Equal to $205 million | | 50% |
| Target | | Equal to $256 million | | 100% |
| Maximum | | Greater than or Equal to $300 million | | 200% |
The following table sets out the levels at which the Tranche CF Units were eligible to vest (using linear interpolation) based on the cash flow performance of ENLC for the performance period ending December 31, 2020:
| | | | | | | | | | | | | | |
| Performance Level | | ENLC’s Achieved
Distributable Cash Flow per Unit | | Vesting percentage
of the Tranche CF Units |
| Below Threshold | | Less than $1.345 | | 0% |
| Threshold | | Equal to $1.345 | | 50% |
| Target | | Equal to $1.494 | | 100% |
| Maximum | | Greater than or Equal to $1.643 | | 200% |
The following table sets out the levels at which the Tranche CF Units were eligible to vest (using linear interpolation) based on the cash flow performance of ENLC for the performance period ending December 31, 2019:
| | | | | | | | | | | | | | |
| Performance Level | | ENLC’s Achieved
Distributable Cash Flow per Unit | | Vesting percentage
of the Tranche CF Units |
| Below Threshold | | Less than $1.43 | | 0% |
| Threshold | | Equal to $1.43 | | 50% |
| Target | | Equal to $1.55 | | 100% |
| Maximum | | Greater than or Equal to $1.72 | | 200% |
At the end of the vesting period, recipients receive distribution equivalents, if any, with respect to the number of performance units vested. The vesting of such units ranges from 0% to 200% of the units granted depending on EnLink’s achievement of performance goals on the vesting date. The fair value of each performance unit is estimated as of the date of grant using a Monte Carlo simulation with the following assumptions used for all performance unit grants made under the plan: (i) a risk-free interest rate based on United States Treasury rates as of the grant date; (ii) a volatility assumption based on the historical realized price volatility of our common units and the Designated Peer Companies securities; (iii) an estimated ranking of us among the Designated Peer Companies; and (iv) the distribution yield.
The total value of the equity compensation granted to our executive officers generally has been awarded 50% restricted incentive units and 50% performance units on an annual basis. In addition, our executive officers may receive additional grants of equity compensation in certain circumstances, such as promotions and change of ownership. All performance and restricted incentive units that we grant are charged against earnings according to ASC 718.
Anti-Hedging and Anti-Pledging Policy. Pursuant to ENLC’s insider trading policy, ENLC prohibits hedging of its securities by directors, officers, or employees and pledging of its securities as collateral by directors and executive officers.
Retirement and Health Benefits. All eligible employees are offered a variety of health and welfare and retirement programs. The named executive officers are generally eligible for the same programs on the same basis as other employees. The Operating Partnership maintains a tax-qualified 401(k) retirement plan that provides eligible employees with an opportunity to save for retirement on a tax deferred basis. In 2021, the Operating Partnership matched 100% of every dollar contributed for contributions of up to 6% of eligible compensation made by eligible participants plus a discretionary profit-sharing contribution (not to exceed the maximum amount permitted by law). The retirement benefits provided to the named executive officers were allocated to us as general and administration expenses.
Perquisites. We generally do not pay for perquisites for any of the named executive officers, other than payment of dues, sales tax, and related expenses for membership in an industry-related private lunch club (totaling less than $2,500 per year per named executive officer).
Change in Control and Severance Agreements
All of our named executive officers and certain members of senior management have entered into change in control agreements (the “Change in Control Agreements”) with the Operating Partnership and severance agreements (the “Severance Agreements” and collectively with the Change in Control Agreements, the “Agreements”) with the Operating Partnership. Additionally, as certain individuals become members of senior management, the individual may become a party to a change in control agreement and/or a severance agreement in substantially the same form as the applicable Agreement. Under the Change in Control Agreements, the Company’s Chairman and Chief Executive Officer would be entitled to three times the change in control benefit, and the other named executive officers would be entitled to two and a half times the change in control benefit.
The Agreements restrict the officers from competing with us, the Managing Member, the Operating Partnership, ENLK, the General Partner, and their respective affiliates and subsidiaries (the “Company Group”) during the term of employment. The Agreements also restrict the officers from disclosing confidential information of the Company Group and disparaging any member of the Company Group, in each case, during or after the term of their employment. In addition, the Agreements restrict the officers, both during their employment and for varying periods following the termination of employment, from (i) soliciting other employees to terminate their employment with any member of the Company Group or accept employment with a third party and (ii) diverting the business of a client or customer of any member of the Company Group or attempting to convert a client or customer of any member of the Company Group. The Agreements provide the Operating Partnership with equitable remedies and with the right to claw back benefits if the restrictions described in this paragraph are breached by the officer. In
the event of a termination, the terminated employee is required to execute a general release of the Company Group in order to receive any benefits under the Agreements.
Under the Severance Agreements, if an officer’s employment is terminated without cause (as defined in the Severance Agreement) or is terminated by the officer for good reason (as defined in the Severance Agreement), such officer will be entitled to receive (i) his or her accrued base salary up to the date of termination, (ii) any unpaid annual bonus with respect to the calendar year ending prior to the officer’s termination date that has been earned as of such date, (iii) a prorated amount of the bonus (to the extent such bonus would have otherwise been earned by such officer) for the calendar year in which the termination occurs, (iv) such other fringe benefits (other than any bonus, severance pay benefit or medical insurance benefit) normally provided to employees that are already earned or accrued as of the date of termination (the foregoing items in clauses (i) - (iv) are referred to as the “General Benefits”), (v) certain outplacement services (the “Outplacement Benefits”), (vi) a lump sum severance equal to the sum of (A) the officer’s then-current base salary and (B) any target bonus (as defined in the applicable Agreement) for the year that includes the date of termination (the “Severance Benefit”) times two for the officer (other members of senior management are each entitled to one times the Severance Benefit), plus (vii) an amount equal to the cost to the officer to extend his or her then-current medical insurance benefits for 18 months following the effective date of the termination (the “Medical Severance Benefit”).
Potential Payments Upon a Change of Control
Under the Change in Control Agreements, if, within a period that begins 120 days prior to and ends 24 months following a change in control (as defined in the Change in Control Agreement), an officer’s employment is terminated without cause (as defined in the Change in Control Agreement) or is terminated by the officer for good reason (as defined in the Change in Control Agreement), such officer will be entitled to the General Benefits, the Outplacement Benefits, the Medical Severance Benefit and the Severance Benefit; provided, however, that the Chairman and Chief Executive Officer would be entitled to three times the Severance Benefit, the other named executive officers would be entitled to two and a half times the Severance Benefit, and other members of senior management would be entitled to one and a half times the Severance Benefit.
In addition, the Agreements provide for the General Benefits upon the officer’s termination of employment due to his or her death or disability (as defined in the Agreements).
The Agreements provide that an officer may only become entitled to payments under the Severance Agreement or the Change in Control Agreement, but not under both Agreements. Upon execution of a Severance Agreement, the Severance Agreement will continue in effect until (i) the Initial Expiration Date (as defined in the Severance Agreement), which is generally a term of one year from the execution date; provided that the term will be automatically renewed for additional one-year periods beginning on the day following the first anniversary of the Initial Expiration Date (each, a “Renewal Date”), unless the Board provides the officer with written notice (a “Non-Renewal Notice”) of the Operating Partnership’s election not to renew the term at least 30 days prior to any Renewal Date or (ii) the termination of the officer’s employment; provided that an officer’s employment may not be terminated by the Operating Partnership for any reason other than cause (as defined in the Severance Agreement) for the 90-day period that follows the termination of the Severance Agreement pursuant to a Non-Renewal Notice. Upon execution of a Change in Control Agreement, the Change in Control Agreement will continue in effect with automatic renewal on each anniversary of the execution date until (i) termination by the Board providing the officer with a Non-Renewal Notice at least 90 days prior to any Renewal Date or (ii) the termination of the officer’s employment, except that a Change in Control Agreement may not be terminated for a period that begins 120 days prior to, and ends 24 months following, a change in control.
If the payments and benefits provided to an officer under the Agreements (i) constitute a “parachute payment” as defined in Section 280G of the IRC and exceed three times the officer’s “base amount” as defined under Section 280G(b)(3) of the IRC, and (ii) would be subject to the excise tax imposed by Section 4999 of the IRC, then the officer’s payments and benefits will be either (A) paid in full, or (B) reduced and payable only as to the maximum amount that would result in no portion of the payments and benefits being subject to such excise tax, whichever results in the receipt by the officer on an after-tax basis of the greatest amount (taking into account the applicable federal, state and local income taxes, the excise tax imposed by Section 4999 of the IRC and all other taxes, including any interest and penalties, payable by the officer).
With respect to the 2014 Plan, the amounts to be received by our named executive officers in the event of a change of control (as defined in such plans) will be automatically determined based on the number of units underlying any unvested equity incentive awards held by a named executive officer at the time of a change of control. The terms of such plans were determined based on past practice and the applicable compensation committee’s understanding of similar plans utilized by public companies generally at the time we adopted such plans. The determination of the reasonable consequences of a change of control is periodically reviewed by the Committee.
Upon a change of control, and except as provided in the award agreement, the Committee may cause options and UAR grants to be vested, may cause change of control consideration to be paid in respect of some or all of such awards, or may make other adjustments (if any) that it deems appropriate with respect to such awards. With respect to other awards, upon a change of control and except as provided in the award agreement, the Committee may cause such awards to be adjusted, which adjustments may relate to the vesting, settlement, or the other terms of such awards.
The potential payments that may be made to the named executive officers upon a termination of their employment or in connection with a change of control as of December 31, 2021 are set forth in the table in the section below entitled “Payments Upon Termination or Change of Control.”
Role of Executive Officers in Executive Compensation
The Board, upon recommendation of the Committee, determines the compensation payable to each of the named executive officers. None of the named executive officers serves as a member of the Committee. Our Chief Executive Officer makes recommendations regarding the compensation of his leadership team with the Committee, including specific recommendations for each element of compensation for each of the named executive officers. Our Chief Executive Officer does not make any recommendations regarding his personal compensation.
Tax Considerations
We have structured the compensation program in a manner intended to be exempt from, or to comply with, Section 409A of the IRC. If an executive is entitled to nonqualified deferred compensation benefits that are subject to Section 409A, and such benefits do not comply with Section 409A of the IRC, then the benefits are taxable in the first year they are not subject to a substantial risk of forfeiture. In such case, the service provider is subject to regular federal income tax, interest, and an additional federal excise tax of 20% of the benefit includible in income.
Summary Compensation Table
The following table sets forth certain compensation information for our named executive officers.
| | | | | | | | | | | | | | | | | | | | | | | | | | | | | | | | | | | | | | |
| Name and Principal Position | | Year | | Salary ($)(1) | | Bonus ($)(2) | | Restricted Incentive Unit and Performance Unit Awards ($)(3) | | All Other Compensation ($) | | Total ($) |
| Barry E. Davis | | 2021 | | 750,058 | | 1,546,994 | | 3,968,869 | | 643,524 | (5) | 6,909,445 |
| Chairman and Chief Executive Officer | | 2020 | | 763,269 | | 983,658 | | 5,412,084 | | 660,582 | | 7,819,593 |
| 2019 | | 556,000 | | 636,568 | | 4,553,287 | | 744,456 | | 6,490,311 |
| Benjamin D. Lamb | | 2021 | | 516,809 | | 852,735 | | 1,984,434 | | 205,645 | (6) | 3,559,623 |
| Executive Vice President and Chief Operating Officer | | 2020 | | 519,988 | | 536,056 | | 2,706,036 | | 209,641 | | 3,971,721 |
| 2019 | | 491,200 | | 521,207 | | 1,264,284 | | 362,424 | | 2,639,115 |
| Pablo G. Mercado (4) | | 2021 | | 474,000 | | 703,890 | | 1,257,142 | | 150,520 | (7) | 2,585,552 |
| Executive Vice President and Chief Financial Officer | | 2020 | | 225,000 | | 408,757 | | 986,400 | | 223,126 | | 1,843,283 |
| | | | | | | | | | | |
| Alaina K. Brooks | | 2021 | | 474,039 | | 703,948 | | 1,133,962 | | 185,407 | (8) | 2,497,356 |
| Executive Vice President, Chief Legal and Administrative Officer, and Secretary | | 2020 | | 465,252 | | 431,666 | | 1,391,674 | | 181,311 | | 2,469,903 |
| 2019 | | 439,500 | | 444,709 | | 902,261 | | 302,253 | | 2,088,723 |
____________________________
(1)Salary for the years 2021 and 2020 included regular earnings and a paid time off payout for Messrs. Lamb and Mercado and Ms. Brooks. Salary for the year 2020 also included an additional 27th pay period.
(2)Bonuses include all annual bonus payments. For the years 2021 and 2020, the named executive officers received bonuses in the form of 100% cash except for Mr. Mercado, who received $100,000 of his 2020 bonus in restricted incentive units that vested on December 31, 2021. This award was based on the closing price of the ENLC common units as of December 31, 2020, which was $3.71. For 2019, the named executive officers received bonuses in the form of 35% cash and 65% equity awards that immediately vested. Such equity awards were entirely allocated in restricted incentive units of ENLC. Equity awards for 2019 represent the grant date fair value of awards computed in accordance with ASC 718.
(3)The amounts shown represent the grant date fair value of awards computed in accordance with ASC 718. See “Item 8. Financial Statements and Supplementary Data—Note 11” for the assumptions made in our valuation of such awards.
(4)Mr. Mercado was appointed as Executive Vice President and Chief Financial Officer on July 13, 2020.
(5)Amount of all other compensation for Mr. Davis includes a matching 401(k) contribution of $17,400 and DERs with respect to restricted incentive units of ENLC in the amount of $626,124.
(6)Amount of all other compensation for Mr. Lamb includes a matching 401(k) contribution of $17,400 and DERs with respect to restricted incentive units of ENLC in the amount of $188,245.
(7)Amount of all other compensation for Mr. Mercado includes a matching 401(k) contribution of $17,400 and DERs with respect to restricted incentive units of ENLC in the amount of $133,120.
(8)Amount of all other compensation for Ms. Brooks includes a matching 401(k) contribution of $17,400 and DERs with respect to restricted incentive units of ENLC in the amount of $168,007.
CEO Pay Ratio
For fiscal year 2021, the annual total compensation for Mr. Davis was $6.9 million and for the median employee was $105,168. The resulting ratio of annual total compensation of Mr. Davis to the annual total compensation of our median employee was 66:1. This pay ratio is a reasonable estimate calculated in accordance with the requirements of Item 402(u) of Regulation S-K. As a result of our methodology for determining the pay ratio, which is described below, our pay ratio may not be comparable to the pay ratios of other companies in our industry or in other industries because other companies may rely on different methodologies or assumptions or may make adjustments that we do not make. For 2021, the same median employee as 2020 was used to determine the pay ratio given that there has not been a material change to (i) the employee population, (ii) compensation arrangements believed to result in a significant change to the pay ratio, and (iii) the original median employee’s circumstances (e.g., a promotion or demotion). If one of the aforementioned material changes did occur, the same approach used to identify the median employee in 2020 would have been applied for 2021.
To determine the pay ratio, we first identified the median employee by examining 2020 W-2 Box 1 Federal Taxable Wages (the “Taxable Wages Measure”) for all of our employees, excluding our Chairman and Chief Executive Officer, who were employed on December 31, 2021, the last business day of the 2021 fiscal year. We included all employees, whether employed as full-time, part-time, or on a seasonal basis, and compensation was annualized for any full-time employee that was not employed for all of fiscal year 2021. We use the Taxable Wages Measure because it is consistently applied for all employees and because we believe it reasonably reflects the annual compensation of our employees. After identifying the median employee, we calculated annual total compensation for the median employee using the same methodology used for calculating the annual total compensation of our named executive officers as set forth in the 2021 Summary Compensation Table above.
Narrative Disclosure to Summary Compensation Table
A narrative description of all material factors necessary to an understanding of the information included in the above Summary Compensation Table is included in the section titled “Compensation Discussion and Analysis” and in the footnotes to such tables.
Grants of Plan-Based Awards for Fiscal Year 2021 Table
The following table provides information concerning each grant of an award made to a named executive officer for fiscal year 2021.
ENLINK MIDSTREAM, LLC—GRANTS OF PLAN-BASED AWARDS
| | | | | | | | | | | | | | | | | | | | | | | | | | | | | | | | | | | | | | |
| | | | Estimated Future Payouts Under Equity Incentive Plan Awards | | | | |
| Name | | Grant Date | | Threshold (#) | | Target (#) | | Maximum (#) | | All Other Unit Awards: Number of Units | | Grant Date Fair Value of Unit Awards ($)(1) |
| Barry E. Davis | | 1/1/2021 | | — | | | — | | | — | | | 471,698 | | (2) | 1,750,000 | |
| | 1/1/2021 | | 235,849 | | | 471,698 | | | 943,396 | | | — | | (3) | 2,218,869 | |
| | | | | | | | | | | | |
| Benjamin D. Lamb | | 1/1/2021 | | — | | | — | | | — | | | 235,849 | | (2) | 875,000 | |
| | 1/1/2021 | | 117,925 | | | 235,849 | | | 471,698 | | | — | | (3) | 1,109,435 | |
| | | | | | | | | | | | |
| Pablo G. Mercado | | 1/1/2021 | | — | | | — | | | — | | | 134,771 | | (2) | 500,000 | |
| | 1/1/2021 | | 67,386 | | | 134,771 | | | 269,542 | | | — | | (3) | 633,962 | |
| | 2/16/2021 | | — | | | — | | | — | | | 26,954 | | (4) | 123,180 | |
| | | | | | | | | | | | |
| Alaina K. Brooks | | 1/1/2021 | | — | | | — | | | — | | | 134,771 | | (2) | 500,000 | |
| | 1/1/2021 | | 67,386 | | | 134,771 | | | 269,542 | | | — | | (3) | 633,962 | |
____________________________
(1)The amounts shown represent the grant date fair value of awards computed in accordance with ASC 718. See “Item 8. Financial Statements and Supplementary Data—Note 11” for the assumptions made in our valuation of such awards.
(2)These grants include DERs that provide for distribution on restricted incentive units if made on unrestricted common units during the restriction period unless otherwise forfeited and vest 100% on January 1, 2024.
(3)These grants include accrued DERs that provide for distributions on performance awards, unless otherwise forfeited, if distributions are made on common units during the restriction period. When the performance awards vest on January 1, 2024, recipients receive DERs, if any, with respect to the number of performance awards vested.
(4)Mr. Mercado received $100,000 of his 2020 bonus in restricted incentive units that vested on December 31, 2021. This award was based on the closing price of the ENLC common units as of December 31, 2020, which was $3.71. These awards included DERs that provided for distributions on restricted incentive units if made on unrestricted common units during the restriction period unless otherwise forfeited.
Outstanding Equity Awards at Fiscal Year-End Table for Fiscal Year 2021
The following table provides information concerning all outstanding equity awards made to a named executive officer as of December 31, 2021.
ENLINK MIDSTREAM, LLC—OUTSTANDING EQUITY AWARDS AT FISCAL YEAR-END
| | | | | | | | | | | | | | | | | | | | | | | | | | | | | |
| | | Unit Awards |
| Name | Vesting Year (1) | | Number of Units That Have Not Vested (#) | | Market Value of Shares or Units That Have Not Vested ($)(2) | | Equity Incentive Plan Awards: Number of Unearned Units or Other Rights that Have Not Vested (#)(3)(4)(5) | | Equity Incentive Plan Awards: Market or Payout Value of Unearned Units or Other Rights That Have Not Vested ($)(2) |
| Barry E. Davis | 2024 | | 471,698 | | | 3,249,999 | | | 471,698 | | | 3,249,999 | |
| 2023 | | 391,499 | | | 2,697,428 | | | 391,499 | | | 2,697,428 | |
| 2022 | | 135,318 | | | 932,341 | | | 391,292 | | (6) | 2,696,002 | |
| Benjamin D. Lamb | 2024 | | 235,849 | | | 1,625,000 | | | 235,849 | | | 1,625,000 | |
| 2023 | | 195,749 | | | 1,348,711 | | | 195,749 | | | 1,348,711 | |
| 2022 | | — | | | — | | | 96,525 | | | 665,057 | |
| Pablo G. Mercado | 2024 | | 134,771 | | | 928,572 | | | 134,771 | | | 928,572 | |
| 2023 | | 200,000 | | | 1,378,000 | | | 200,000 | | | 1,378,000 | |
| 2022 | | — | | | — | | | — | | | — | |
| Alaina K. Brooks | 2024 | | 134,771 | | | 928,572 | | | 134,771 | | | 928,572 | |
| 2023 | | 100,671 | | | 693,623 | | | 100,671 | | | 693,623 | |
| 2022 | | — | | | — | | | 72,394 | | | 498,795 | |
____________________________
(1)Restricted incentive units vesting in 2022 vest on January 1st provided that, for Mr. Davis, restricted incentive units vesting in 2022 vest on January 1st and August 1st, as applicable. Restricted incentive units vesting in 2023 vest on January 1st and July 13th, as applicable. Restricted incentive units vesting in 2024 vest on January 1st.
(2)The closing price for the ENLC common units was $6.89 as of December 31, 2021.
(3)Reflects the target number of performance units granted to the named executive officers multiplied by a performance percentage of 100%.
(4)Vesting of awards in 2022 and 2023 are contingent upon (i) the EnLink TSR performance measured against a peer group of companies, (ii) EnLink’s achieved distributable cash flow per unit outstanding or EnLink’s achieved free cash flow after distributions depending on the award and vesting tranche as described above.
(5)Vesting of awards in 2024 are contingent upon (i) the EnLink TSR performance measured against a peer group of companies and (ii) EnLink’s achieved free cash flow after distributions.
(6)Vesting of awards in August 2022 for Mr. Davis are contingent upon the EnLink TSR performance measured against a peer group of companies.
Units Vested Table for Fiscal Year 2021
The following table provides information related to the vesting of restricted units and restricted incentive units during fiscal year ended 2021.
ENLINK MIDSTREAM, LLC—UNITS VESTED
| | | | | | | | | | | | | | | | | | | | | | | | | | |
| Name | | Date Vested | | Number of Units Acquired on Vesting | | Value Per Unit Realized on Vesting ($) | | Total ($) |
| Barry E. Davis | | 1/1/2021 | | 42,614 | | 3.71 | | | 158,098 |
| | 1/21/2021 | | 42,614 | | 3.95 | | | 168,325 |
| | 1/1/2021 | | 56,116 | | 3.71 | | | 208,190 |
| | 1/21/2021 | | 56,116 | | 3.95 | | | 221,658 |
| Benjamin D. Lamb | | 1/1/2021 | | 19,886 | | 3.71 | | | 73,777 |
| | 1/1/2021 | | 26,188 | | 3.71 | | | 97,157 |
| | 8/1/2021 | | 15,674 | | 5.57 | | | 87,304 |
| | 8/1/2021 | | 27,430 | | 5.57 | | | 152,785 |
| | 8/1/2021 | | 18,453 | | 5.57 | | | 102,783 |
| | 8/1/2021 | | 32,294 | | 5.57 | | | 179,878 |
| Pablo G. Mercado | | 12/31/2021 | | 26,954 | | 6.80 | | | 183,287 |
| Alaina K. Brooks | | 1/1/2021 | | 11,222 | | 3.71 | | | 41,634 |
| | 1/21/2021 | | 11,222 | | 3.95 | | | 44,327 |
| | 1/1/2021 | | 14,778 | | 3.71 | | | 54,826 |
| | 1/21/2021 | | 14,778 | | 3.95 | | | 58,373 |
| | 8/1/2021 | | 10,972 | | 5.57 | | | 61,114 |
| | 8/1/2021 | | 10,972 | | 5.57 | | | 61,114 |
| | 8/1/2021 | | 12,918 | | 5.57 | | | 71,953 |
| | 8/1/2021 | | 12,918 | | 5.57 | | | 71,953 |
Payments Upon Termination or Change of Control
The following table shows potential payments that would have been made to the named executive officers as of December 31, 2021.
| | | | | | | | | | | | | | | | | | | | | | | | | | | | | |
| Named Executive Officer | Payment Under Severance Agreements Upon Termination Other Than For Cause or With Good Reason ($)(1) | | Health Care Benefits Under Change in Control and Severance Agreements Upon Termination Other Than For Cause or With Good Reason ($)(2) | | Payment and Health Care Benefits Under Change in Control and Severance Agreements Upon Termination For Cause or Without Good Reason ($)(3) | | Payment Under Change in Control Agreements Upon Termination and Change of Control ($)(4) | | Acceleration of Vesting Under Long-Term Incentive Plans Upon Change of Control ($)(5) |
| Barry E. Davis | 4,971,994 | | 23,890 | | — | | | 6,659,494 | | 15,523,198 |
| Benjamin D. Lamb | 2,930,735 | | 30,752 | | — | | | 3,437,735 | | 6,612,478 |
| Pablo G. Mercado | 2,520,890 | | 29,214 | | — | | | 2,962,640 | | 4,613,144 |
| Alaina K. Brooks | 2,520,948 | | 31,290 | | — | | | 2,962,698 | | 3,743,185 |
____________________________
(1)Each named executive officer is entitled to a lump sum amount equal to two times the Severance Benefit, the Outplacement Benefit, and when applicable, the bonus amounts comprising the General Benefits will be paid if he or she is terminated without cause (as defined in the Severance Agreement) or if he or she terminates employment for good reason (as defined in the Severance Agreement), subject to compliance with certain non-competition and non-solicitation covenants described elsewhere in this Annual Report on Form 10-K. The figures shown do not include amounts of base salary previously paid or fringe benefits previously received.
(2)Each named executive officer is entitled to health care benefits equal to a lump sum payment of the estimated monthly cost of the benefits under COBRA for 18 months if he or she is terminated without cause (as defined in the applicable Severance Agreement or Change of Control Agreement (the “Applicable Agreement”) or if he or she terminates employment for good reason (as defined in the Applicable Agreement)).
(3)Each named executive officer is entitled to his or her then current base salary up to the date of termination plus such other fringe benefits (other than any bonus, severance pay benefit, participation in the company’s 401(k) employee benefit plan, or medical insurance benefit) normally provided to employees of the company as earned up to the date of termination if he or she is terminated for cause (as defined in the Applicable Agreement) or he or she terminates employment without good reason (as defined in the Applicable Agreement). The figures shown do not include amounts of base salary previously paid or fringe benefits previously received.
(4)Each named executive officer is entitled to a lump sum payment equal to two and a half times the Severance Benefit (three times in the case of the Chairman and Chief Executive Officer), the Outplacement Benefit, and when applicable, the bonus amounts comprising the General Benefits will be paid if he or she is terminated without cause (as defined in the Change of Control Agreement) or if he or she terminates employment for good reason (as defined in the Change of Control Agreement) within 120 days prior to or two years following a change in control (as defined in the Severance Agreement), subject to compliance with certain non-competition, non-solicitation, and other covenants described elsewhere in this Annual Report on Form 10-K. The figures shown do not include amounts of base salary previously paid or fringe benefits previously received.
(5)Each named executive officer is entitled to accelerated vesting of certain outstanding equity awards in the event of a change of control (as defined under the long-term incentive plans). These amounts correspond to the values set forth in the table in the section above entitled Outstanding Equity Awards at Fiscal Year-End Table for Fiscal Year 2021.
Compensation of Directors for Fiscal Year 2021
DIRECTOR COMPENSATION
| | | | | | | | | | | | | | | | | | | | | | | | | | |
| Name | | Fees Earned or Paid in Cash ($) | | Unit Awards ($)(1) | | All Other Compensation ($)(2) | | Total ($) |
| Deborah G. Adams | | 95,625 | | | 198,071 | | | 11,624 | | | 305,320 | |
| Tiffany Thom Cepak (3) | | — | | | — | | | — | | | — | |
| James C. Crain (4) | | 82,500 | | | 198,071 | | | 5,812 | | | 286,383 | |
| Leldon E. Echols | | 107,375 | | | 198,071 | | | 11,624 | | | 317,070 | |
| Kyle D. Vann | | 105,000 | | | 198,071 | | | 11,624 | | | 314,695 | |
____________________________
(1)At December 31, 2021, Ms. Adams and Messrs. Echols and Vann each held an aggregate of 30,997 outstanding restricted incentive unit awards. On July 1, 2021, Ms. Adams and Messrs. Crain, Echols, and Vann were each granted awards of restricted incentive units with a fair market value of $6.39 per unit and that vested on January 1, 2022. The amounts shown represent the grant date fair value of awards computed in accordance with ASC 718. See “Item 8. Financial Statements and Supplementary Data—Note 11” for the assumptions made in our valuation of such awards. The number of units granted to each director was based on a unit value of $3.71, the closing trading price on December 31, 2021, and is consistent with the unit value used for grants to Named Executive Officers in the same year. Value on this date represents the Board approved award of equity compensation valued at $115,000. This approach for determining the number of units granted to directors is consistent with prior years. In 2020, this approach resulted in director grants valued at $29,586 compared to approved award value of $115,000.
(2)Other Compensation is comprised of DERs with respect to restricted incentive units.
(3)Ms. Cepak was appointed to the Board in December 2021.
(4)Mr. Crain was a member of the Board until his death in July 2021.
Each director of the Managing Member who is not an employee of the Managing Member or GIP is paid an annual retainer fee of $97,500 and equity compensation valued at $115,000. Directors do not receive an attendance fee for each regularly scheduled quarterly board meeting or each additional meeting that they attend. The respective chairs of each committee received the following annual fees for fiscal year ended 2021: Audit—$20,000, Governance and Compensation Committee—$15,000, Conflicts—$15,000, and Sustainability—$15,000. Directors were also reimbursed for related out-of-pocket expenses.
Barry E. Davis, as an officer of the Managing Member, William J. Brilliant, Thomas W. Horton, James K. Lee, and Scott E. Telesz, as representatives of GIP, receive no separate compensation for their respective service as directors.
Governance and Compensation Committee Interlocks and Insider Participation
Our Governance and Compensation Committee is comprised of Kyle D. Vann (chair), William J. Brilliant, and Leldon E. Echols. As described elsewhere in this report, Mr. Brilliant is a representative of GIP and may have an interest in the transactions among GIP, ENLK, and us. Please see “Item 13. Certain Relationships and Related Transactions, and Director Independence.”
No other member of the Compensation Committee during fiscal 2021 was a current or former officer or employee of the General Partner or had any relationship requiring disclosure by us under Item 404 of Regulation S-K as adopted by the Commission. None of the General Partner’s executive officers served on the board of directors or the compensation committee of any other entity for which any officers of such other entity served either on the Board or the Committee.
Board Leadership Structure and Risk Oversight
The Board has no policy that requires that the positions of the Chairman of the Board and the Chief Executive Officer be separate or that they be held by the same individual. The Board believes that this determination should be based on circumstances existing from time to time, including the composition, skills, and experience of the Board and its members, specific challenges faced by us or the industry in which we operate, and governance efficiency. Based on these factors, the Board has determined that having Barry E. Davis serve as Chairman and Chief Executive Officer is in our best interest at this time, and that such arrangement makes the best use of Mr. Davis’ unique skills and experience in the industry.
The Board is responsible for risk oversight. Management has implemented internal processes to identify and evaluate the risks inherent in our business and to assess the mitigation of those risks. The Audit Committee will review the risk assessments with management and provide reports to the Board regarding the internal risk assessment processes, the risks identified, and the mitigation strategies planned or in place to address the risks in the business. The Board and the Audit Committee each provide insight into the issues, based on the experience of their members, and provide constructive challenges to management’s assumptions and assertions.
Item 12. Security Ownership of Certain Beneficial Owners and Management and Related Unitholder Matters
EnLink Midstream, LLC Ownership
The following table shows the beneficial ownership of ENLC, as of February 9, 2022, held by:
•each person who is known to ENLC to beneficially own more than 5% of any class of voting units then outstanding;
•all the directors of the Managing Member;
•each named executive officer of the Managing Member; and
•all the directors and executive officers of the Managing Member as a group.
The percentage of total ENLC common units beneficially owned is based on a total of 546,319,579 units (including 62,293,613 common units, which reflects the as-exchanged amount of the outstanding 54,168,359 ENLC Class C Common Units) as of February 9, 2022.
| | | | | | | | | | | | | | | | | | | | | | | | | | | | | | |
| Name of Beneficial Owner (1) | | Common Units Beneficially Owned (2) | | Percentage of Common Units Beneficially Owned (3) | | | | | | Total Units Beneficially Owned (2) | | Percentage of Total Units Beneficially Owned (4) |
| Global Infrastructure Investors III, LLC (5) | | 224,355,359 | | | 46.4 | % | | | | | | 224,355,359 | | | 41.1 | % |
| | | | | | | | | | | | |
| | | | | | | | | | | | |
| ALPS Advisors, Inc. (6) | | 43,392,248 | | | 9.0 | % | | | | | | 43,392,248 | | | 7.9 | % |
| Invesco Ltd. (7) | | 39,070,300 | | | 8.1 | % | | | | | | 39,070,300 | | | 7.2 | % |
| Barry E. Davis (8) | | 2,062,952 | | | * | | | | | | 2,062,952 | | | * |
| Benjamin D. Lamb | | 538,603 | | | * | | | | | | 538,603 | | | * |
| Pablo G. Mercado | | 16,347 | | | * | | | | | | 16,347 | | | * |
| Alaina K. Brooks | | 236,412 | | | * | | | | | | 236,412 | | | * |
| Deborah G. Adams | | 87,721 | | | * | | | | | | 87,721 | | | * |
| William J. Brilliant | | — | | | * | | | | | | — | | | * |
| Tiffany Thom Cepak | | — | | | * | | | | | | — | | | * |
| Leldon E. Echols | | 177,746 | | | * | | | | | | 177,746 | | | * |
| Thomas W. Horton | | — | | | * | | | | | | — | | | * |
| James K. Lee | | — | | | * | | | | | | — | | | * |
| Scott E. Telesz | | — | | | * | | | | | | — | | | * |
| Kyle D. Vann (9) | | 252,628 | | | * | | | | | | 252,628 | | | * |
| All directors and executive officers as a group (12 persons) | | 3,372,409 | | | * | | | | | | 3,372,409 | | | * |
____________________________
* Less than 1%
(1)Unless otherwise indicated, the beneficial owner has sole voting and dispositive power over all units listed. Unless otherwise indicated, the address of each beneficial owner is 1722 Routh Street, Suite 1300, Dallas, Texas 75201.
(2)Pursuant to Rule 13d-3 under the Exchange Act, a person has beneficial ownership of a security as to which that person, directly or indirectly, through any contract, arrangement, understanding, relationship, or otherwise has or shares voting power and/or investment power of such security and as to which that person has the right to acquire beneficial ownership of such security within 60 days.
(3)The percentages reflected in the column below are based on a total of 484,025,966 common units.
(4)The percentages reflected in the column below are based on a total of 546,319,579 common units, which includes the units described in (3) above, and 62,293,613 common units, which reflects the as-exchanged amount of the 54,168,359 ENLC Class C Common Units held by the Series B Preferred Unitholders. The Series B Preferred Units are exchangeable into ENLC common units on a 1-for-1.15 basis, subject to certain adjustments. For this reason, the percentages in this column reflect the exchange of the Series B Preferred Units into ENLC common units. Upon any exchange of Series B Preferred Units into ENLC common units, an equal number of ENLC Class C Common Units will be canceled.
(5)Based solely on the Amendment No. 2 to the Schedule 13D filed with the Commission on February 5, 2019 by Global Infrastructure Investors III, LLC (“Global Investors”). Such filing indicates that Global Investors, Global Infrastructure GP III, L.P. (“Global GP”), GIP III Stetson Aggregator II, L.P. (“Aggregator II”), GIP III Stetson Aggregator I, L.P. (“Aggregator I”), and GIP III Stetson GP, LLC (“Stetson GP”) have shared voting and dispositive power with respect to 224,355,359 ENLC common units, and that GIP III Stetson II, L.P. (“Stetson II”) and GIP III Stetson I, L.P. (“Stetson I”) are the record holders of 115,495,669 and 108,859,690 ENLC common units, respectively. Global Investors is the sole general partner of Global GP, which is the general partner of each of Aggregator I and Aggregator II, which are the managing members of Stetson GP, which is the general partner of each of Stetson I and Stetson II. As a result, Global Investors, Global GP, Aggregator I, Aggregator II and Stetson GP may be deemed to share beneficial ownership of the ENLC common units beneficially owned by Stetson I and Stetson II. Adebayo Ogunlesi, Jonathan Bram, William Brilliant, Matthew Harris, Michael McGhee, Rajaram Rao, William Woodburn, Salim Samaha and Robert O’Brien, as the voting members of the Investment Committee of Global Investors, may be deemed to share beneficial ownership of the ENLC common units beneficially owned by Global Investors. Such individuals expressly disclaim any such beneficial ownership. The address of each of Global Investors, Global GP, Aggregator II, Aggregator I, Stetson GP, Stetson I,
Stetson II, and Messrs. Ogunlesi, Bram, Brilliant, Harris, McGhee, Rao, Woodburn, Samaha, and O’Brien is c/o Global Infrastructure Management, LLC, 1345 Avenue of the Americas, 30th Floor, New York, New York 10105.
(6)As reported on Schedule 13G/A filed with the Commission on February 3, 2022 by ALPS Advisors, Inc. and Alerian MLP ETF each with an address of 1290 Broadway, Suite 1000, Denver, Colorado 80203. The Schedule 13G/A reports that ALPS Advisors, Inc. (“AAI”), an investment adviser registered under the Investment Advisers Act of 1940, as amended, furnishes investment advice to investment companies registered under the Investment Company Act of 1940, as amended (collectively referred to as the “Funds”). In its role as investment advisor, AAI has voting and/or investment power over the registrant's common units that are owned by the Funds, and may be deemed to be the beneficial owner of such common units held by the Funds. Alerian MLP ETF is an investment company registered under the Investment Company Act of 1940 and is one of the Funds to which AAI provides investment advice. Alerian MLP ETF has shared voting and investment power over 43,392,248 common units. The common units reported herein are owned by the Funds and AAI disclaims beneficial ownership of such common units.
(7)Based solely on the Schedule 13G/A filed with the Commission on February 9, 2022 by Invesco Ltd. (“Invesco”). Such filing indicates that Invesco has sole voting and dispositive power with respect to 39,070,300 ENLC common units. The address of Invesco is 1555 Peachtree Street NE, Suite 1800, Atlanta, GA 30309.
(8)Of these ENLC common units, 1,101,424 are held by MK Holdings, LP, a family limited partnership, which Mr. Davis controls, and Mr. Davis disclaims beneficial ownership of these securities except to the extent of his pecuniary interest therein.
(9)Of these ENLC Common Units, 181,631 are held indirectly through The Kyle and Barbara Vann Revocable Trust.
GIP’s Pledge of Equity Interests in ENLC and the Managing Member
GIP has pledged all of the equity interests that it owns in ENLC and the Managing Member to its lenders as security under a secured credit facility entered into by a GIP entity in connection with the GIP Transaction (the “GIP Credit Facility”). Although we are not a party to this credit facility, if GIP were to default under the GIP Credit Facility, GIP’s lenders could foreclose on the pledged equity interests. Any such foreclosure on GIP’s interest would result in a change of control of the Managing Member and would allow the new owner to replace the board of directors and officers of the Managing Member with its own designees and to control the decisions taken by the board of directors and officers. See “Item 1A. Risk Factors—GIP has pledged all of the equity interests that it owns in ENLC and the Managing Member to GIP’s lenders under its credit facility. A default under GIP’s credit facility could result in a change of control of the Managing Member.”
Equity Compensation Plan Information
| | | | | | | | | | | | | | | | | | | | | | | |
| Plan Category | | Number of Securities to be Issued Upon Exercise of Outstanding Options, Warrants, and Rights | | Weighted-Average Price of Outstanding Options, Warrants and Rights | | Number of Securities Remaining Available for Future Issuance Under Equity Compensation Plan (Excluding Securities Reflected in Column(a)) | |
| | (a) | | (b) | | (c) | |
Equity Compensation Plans Approved by Security Holders (1) | | 11,082,298 | (2) | N/A | | 25,608,795 | | (3) |
Equity Compensation Plans Not Approved by Security Holders | | N/A | | N/A | | N/A | |
____________________________
(1)These plans include both the 2014 Plan, which was approved by our unitholders in March 2014 for the benefit of our officers, employees, and directors, and the GP Plan, which was approved by ENLK’s unitholders effective April 6, 2016 for the benefit of ENLK’s officers, employees, and directors. As of the closing of the Merger, ENLC assumed all obligations in respect of the GP Plan.
(2)The number of securities includes 7,500,028 restricted units that have been granted under the 2014 Plan that have not vested and 7,443 restricted units that have been granted under the GP Plan that have not vested. In addition, the number of securities includes 3,574,827 performance unit awards that have been granted under the 2014 Plan, assuming the target distribution at the time of vesting,. Actual issuance of these performance unit awards may range from 0% to 200% of the target distribution depending on performance actually attained. See “Item 11—Executive Compensation—Compensation Discussion and Analysis” for additional information regarding the 2014 Plan.
(3)Effective as of the closing of the Merger, the 2014 Plan, as amended, provided for the issuance of a total of 21,116,046 common units under the 2014 Plan, inclusive of the ENLK units that remained eligible for future grants under the GP Plan immediately prior to the effective time of the Merger (which ENLK units were converted to ENLC common units and included among the available units under the 2014 Plan). No additional grants of equity awards will be made under the GP Plan for periods after the Merger. Additionally, effective as of September 17, 2020, the 2014 Plan, as amended, provided for the issuance of an additional 20,000,000 common units, which altogether provided for the issuance of a total 41,116,046 under the 2014 Plan. Of the 41,116,046 common units that may be awarded under the 2014 Plan, 25,608,795 common units remained eligible for future grants as of December 31, 2021.
Item 13. Certain Relationships and Related Transactions, and Director Independence
Relationship with EnLink Midstream Partners, LP
In connection with the Merger, we issued 304,822,035 common units to acquire all of the outstanding ENLK common units not previously owned by us. Subsequent to the Merger, ENLC owns all of ENLK’s common units and also owns all of the membership interests of the General Partner, which allows us to appoint all of the officers and directors of the General Partner and to manage and operate ENLK.
Relationship with GIP
We are managed by our Managing Member, which is wholly-owned by GIP. Therefore, GIP controls us and our ability to manage and operate our business. Additionally, four of our directors, William J. Brilliant, Thomas W. Horton, James K. Lee, and Scott E. Telesz are representatives of GIP, and they control a majority of the voting power on the Board. Those individuals do not receive separate compensation for their service on the Board, but they are entitled to indemnification related to their service as directors pursuant to the indemnification agreements as described below. For the years ended December 31, 2021 and 2020, we recorded general and administrative expenses of $0.5 million and $0.2 million, respectively, related to personnel secondment services provided by GIP. We did not record any expenses related to transactions with GIP for the year ended December 31, 2019.
On February 15, 2022, we and GIP entered into an agreement pursuant to which we will repurchase, on a quarterly basis, a pro rata portion of the ENLC common units held by GIP, based upon the number of common units purchased by us during the applicable quarter from public unitholders under our common unit repurchase program. The number of ENLC common units held by GIP that we repurchase in any quarter will be calculated such that GIP’s then-existing economic ownership percentage of our outstanding common units is maintained after our repurchases of common units from public unitholders are taken into account, and the per unit price we pay to GIP will be the average per unit price paid by us for the common units repurchased from public unitholders. The terms of the agreement with GIP were unanimously approved by the Board and, based upon the related party nature of the agreement with the GIP Entities, the Conflicts Committee of the Board. For more information about our repurchase agreement with GIP, see Item 9B of this Report.
Related Party Transactions
Refer to “Item 8. Financial Statements and Supplementary Information—Note 4” for information about our related party transactions.
Certain Relationships
From time to time, we may do business with other companies affiliated with our board of directors, or with NGP, Marathon Petroleum Corporation, or Kinder Morgan, Inc., our joint venture partners in the Delaware Basin JV, Ascension JV, and Cedar Cove JV, respectively. We believe that any such arrangements have been or will be conducted on an arms-length basis.
Indemnification of Directors and Officers
We have entered into indemnification agreements (the “Indemnification Agreements”) with each of the Managing Member’s directors and executive officers (collectively, the “Indemnitees”). Under the terms of the Indemnification Agreements, we agree to indemnify and hold each Indemnitee harmless, subject to certain conditions, from and against any and all losses, claims, damages, liabilities, judgments, fines, taxes (including ERISA excise taxes), penalties (whether civil, criminal, or other), interest, assessments, amounts paid or payable in settlements, or other amounts (collectively, “losses”) and expenses (as defined in the Indemnification Agreements) arising from any and all threatened, pending, or completed claims, demands, actions, suits, proceedings, or alternative dispute mechanisms, whether civil, criminal, administrative, arbitrative, investigative, or other, whether made pursuant to federal, state, or local law, whether formal or informal, and including appeals (a “proceeding”), in which the Indemnitee may be involved, or is threatened to be involved, as a party, a witness, or otherwise, including any inquiries, hearings, or investigations that the Indemnitee determines might lead to the institution of any proceeding, related to the fact that Indemnitee is or was a director, manager, or officer of us, the General Partner, or the Managing Member or is or was serving at the request of us, the General Partner, or the Managing Member as a manager, managing member, general partner, director, officer, fiduciary, trustee, or agent of any other entity, organization, or person of any nature, including service with respect to employee benefit plans, or by reason of an action or inaction by Indemnitee in any such capacity on behalf of, for the benefit of, or at the request of us, the General Partner, or the Managing Member. We have also agreed to advance the expenses of an Indemnitee relating to the foregoing. To the extent that a change in the laws of the State of Delaware permits greater indemnification under any statute, agreement, organizational document, or governing
document than would be afforded under the Indemnification Agreements as of the date of the Indemnification Agreements, the Indemnitee shall enjoy the greater benefits so afforded by such change.
Approval and Review of Related Party Transactions
Our policies and procedures for the review, approval, or ratification of transactions with “related persons” are contained in our Code of Business Conduct and Ethics (the “Code of Ethics”) as well as our operating agreement. Pursuant to our Code of Ethics, the Audit Committee of the Board must approve any transaction, arrangement, or relationship, or any series of similar transactions, arrangements, or relationships, in which we or any of our subsidiaries is or will be a participant, the aggregate amount involved will or may be expected to exceed $120,000 in any fiscal year, and any director, executive officer, equity holder owning more than 5% of any class of ENLC’s securities, or any immediate family member of any of the foregoing has or will have a direct or indirect interest.
Whenever a conflict arises between the Managing Member or its affiliates, on the one hand, and ENLC and certain of its affiliates, on the other hand, the Managing Member will resolve that conflict in accordance with the provisions of our operating agreement. The Managing Member is authorized but not required in connection with its resolution of such conflict of interest to seek approval of a majority of the members of the Conflicts Committee of the Board or the approval of a majority of the unitholders (excluding units owned by the Managing Member and its affiliates). Any resolution, course of action, or transaction receiving approval of a majority of the members of the Conflicts Committee of the Board or approval of a majority of the unitholders (excluding units owned by the Managing Member and its affiliates) will be conclusively deemed to be approved by ENLC and all of its members.
Director Independence
See “Item 10. Directors, Executive Officers, and Corporate Governance” for information regarding director independence.
Item 14. Principal Accountant Fees and Services
Audit Fees
The fees for professional services rendered for the audit of our annual financial statements for the fiscal years ended December 31, 2021, 2020, and 2019, review of our internal control procedures for the fiscal years ended December 31, 2021, 2020, and 2019, and the reviews of the financial statements included in our quarterly reports on Form 10-Q or services that are normally provided by KPMG in connection with statutory or regulatory filings or engagements for each of those fiscal years were $2.5 million, $2.5 million, and $2.6 million, respectively. These amounts also included fees associated with comfort letters and consents related to debt and equity offerings.
Audit-Related Fees
KPMG did not perform any assurance and related services in connection with the audit or review of our financial statements for the fiscal years ended December 31, 2021, 2020, and 2019 that were not included in the audit fees listed above.
Tax Fees
KPMG did not perform any tax related services for the years ended December 31, 2021, 2020, and 2019, except for certain tax related services in the amounts of $43.5 thousand and $16.7 thousand for the years ended December 31, 2021 and 2019, respectively, in connection with the preparation of calculations under Internal Revenue Code Section 280G.
All Other Fees
KPMG did not render services to us, other than those services covered in the section captioned “Audit Fees” and “Tax Fees” for the fiscal years ended December 31, 2021, 2020, and 2019.
Audit Committee Approval of Audit and Non-Audit Services
All audit and non-audit services and any services that exceed the annual limits set forth in our annual engagement letter for audit services must be pre-approved by the Audit Committee. The chair of the Audit Committee is authorized by the Audit Committee to pre-approve additional KPMG audit and non-audit services between meetings of the Audit Committee, provided
that the additional services do not affect KPMG’s independence under applicable Commission rules and any such pre-approval is reported to the Audit Committee at its next meeting. For the years ended December 31, 2021 and 2019, the Audit Committee of the Board pre-approved KPMG providing certain tax related services in the amounts of $43.5 thousand and $16.7 thousand, respectively, for the preparation of calculations under Internal Revenue Code Section 280G.
PART IV
Item 15. Exhibits and Financial Statement Schedules
(a)Financial Statements and Schedules
1.See “Item 8. Financial Statements and Supplementary Data.”
2.Exhibits
The exhibits filed as part of this report are as follows (exhibits incorporated by reference are set forth with the name of the registrant, the type of report and registration number or last date of the period for which it was filed, and the exhibit number in such filing):
| | | | | | | | | | | |
| Number | | | Description |
| 2.1 | ** | — | Agreement and Plan of Merger, dated as of October 21, 2018, by and among EnLink Midstream, LLC, EnLink Midstream Manager, LLC, NOLA Merger Sub, LLC, EnLink Midstream Partners, LP, and EnLink Midstream GP, LLC (incorporated by reference to Exhibit 2.1 to our Current Report on Form 8-K dated October 21, 2018, filed with the Commission on October 22, 2018, file No. 001-36336). |
| 3.1 | | — | |
| 3.2 | | — | |
| 3.3 | | — | |
| 3.4 | | — | |
| 3.5 | | — | |
| 3.6 | | — | |
| 3.7 | | — | |
| 3.8 | | — | |
| 3.9 | | — | |
| 3.10 | | — | |
| 3.11 | | — | |
| 3.12 | | — | |
| 3.13 | | — | |
| 3.14 | | — | |
| | | | | | | | | | | |
| 4.1 | | — | Registration Rights Agreement, dated as of March 7, 2014, by and among Devon Gas Services, L.P., EnLink Midstream, LLC and, pursuant to a joinder thereto, dated as of July 18, 2018, GIP III Stetson II, L.P. (incorporated by reference to Exhibit 4.1 to our Current Report on Form 8-K dated March 7, 2014, filed with the Commission on March 11, 2014, file No. 001-36336). |
| 4.2 | | — | Amended and Restated Registration Rights Agreement, dated as of January 25, 2019, by and between EnLink Midstream, LLC and Enfield Holdings, L.P. and, pursuant to joinders thereto, dated as of August 4, 2021, Patton BIP HoldCo I LLC, Patton BIP HoldCo II LLC, and OCM ENLK Holdings, LLC (incorporated by reference to Exhibit 10.1 to our Current Report on Form 8-K dated January 25, 2019, filed with the Commission on January 29, 2019, file No. 001-36336). |
| 4.3 | | — | Registration Rights Agreement, dated as of January 7, 2016, by and among EnLink Midstream, LLC, Tall Oak Midstream, LLC and FE-STACK, LLC (incorporated by reference to Exhibit 4.2 to our Current Report on Form 8-K dated January 7, 2016, filed with the Commission on January 12, 2016, file No. 001-36336). |
| 4.4 | | — | |
| 4.5 | | — | Indenture, dated as of March 19, 2014, by and between EnLink Midstream Partners, LP and Wells Fargo Bank, National Association, as trustee (incorporated by reference to Exhibit 4.2 to EnLink Midstream Partners, LP’s Current Report on Form 8-K dated March 19, 2014, filed with the Commission on March 21, 2014, file No. 001-36340). |
| 4.6 | | — | First Supplemental Indenture, dated as of March 19, 2014, by and between EnLink Midstream Partners, LP and Wells Fargo Bank, National Association, as trustee (incorporated by reference to Exhibit 4.3 to EnLink Midstream Partners, LP’s Current Report on Form 8-K dated March 19, 2014, filed with the Commission on March 21, 2014, file No. 001-36340). |
| 4.7 | | — | Second Supplemental Indenture, dated as of November 12, 2014, by and between EnLink Midstream Partners, LP and Wells Fargo Bank, National Association, as trustee (incorporated by reference to Exhibit 4.3 to EnLink Midstream Partners, LP’s Current Report on Form 8-K dated November 6, 2014, filed with the Commission on November 12, 2014, file No. 001-36340). |
| 4.8 | | — | Third Supplemental Indenture, dated as of May 12, 2015, by and between EnLink Midstream Partners, LP and Wells Fargo Bank, National Association, as trustee (incorporated by reference to Exhibit 4.3 to EnLink Midstream Partners, LP’s Current Report on Form 8-K dated May 7, 2015, filed with the Commission on May 12, 2015, file No. 001-36340). |
| 4.9 | | — | Fourth Supplemental Indenture, dated as of July 14, 2016, by and between EnLink Midstream Partners, LP and Wells Fargo Bank, National Association, as trustee (incorporated by reference to Exhibit 4.2 to EnLink Midstream Partners, LP’s Current Report on Form 8-K dated July 11, 2016, filed with the Commission on July 14, 2016, file No. 001-36340). |
| 4.10 | | — | Fifth Supplemental Indenture, dated as of May 11, 2017, by and between EnLink Midstream Partners, LP and Wells Fargo Bank, National Association, as trustee (incorporated by reference to Exhibit 4.2 to EnLink Midstream Partners, LP’s Current Report on Form 8-K dated May 11, 2017, filed with the Commission on May 11, 2017, file No. 001-36340). |
| 4.11 | | — | Indenture, dated as of April 9, 2019, by and between EnLink Midstream, LLC and Wells Fargo Bank, National Association, as trustee (incorporated by reference to Exhibit 4.1 to our Current Report on Form 8-K dated April 4, 2019, filed with the Commission on April 9, 2019, file No. 001-36336). |
| 4.12 | | — | First Supplemental Indenture, dated as of April 9, 2019, by and among EnLink Midstream, LLC, EnLink Midstream Partners, LP, and Wells Fargo Bank, National Association, as trustee (incorporated by reference to Exhibit 4.2 to our Current Report on Form 8-K dated April 4, 2019, filed with the Commission on April 9, 2019, file No. 001-36336). |
| 4.13 | | — | Indenture, dated as of December 17, 2020, by and among EnLink Midstream, LLC, as issuer, EnLink Midstream Partners, LP, as guarantor, and Wells Fargo Bank, National Association, as trustee (incorporated by reference to Exhibit 4.1 to our Current Report on Form 8-K dated December 14, 2020, filed with the Commission on December 18, 2020, file No. 001-36336). |
| 4.14 | * | — | |
| 10.1 | | — | |
| 10.2 | † | — | |
| 10.3 | *† | — | |
| 10.4 | † | — | |
| | | | | | | | | | | |
| 10.5 | | — | Revolving Credit Agreement, dated as of December 11, 2018, by and among EnLink Midstream, LLC, Bank of America, N.A., as Administrative Agent, Swing Line Lender and L/C Issuer, Bank of Montreal and Royal Bank of Canada, as Co-Syndication Agents, Citibank, N.A. and Wells Fargo Bank, National Association, as Co-Documentation Agents, and the lenders party thereto (incorporated by reference to Exhibit 10.1 to our Current Report on Form 8-K dated December 11, 2018, filed with the Commission on December 12, 2018, file No. 001-36336). |
| 10.6 | | — | Guaranty Agreement, dated as of January 25, 2019, by EnLink Midstream Partners, LP in favor of Bank of America, N.A., as Administrative Agent, for the ratable benefit of the lenders from time to time party to the Revolving Credit Agreement, dated as of December 11, 2018 (incorporated by reference to Exhibit 10.2 to our Current Report on Form 8-K dated January 25, 2019, filed with the Commission on January 29, 2019, file No. 001-36336). |
| | | |
| | | |
| 10.7 | † | — | |
| 10.8 | † | — | |
| 10.9 | † | — | |
| 10.10 | † | — | |
| 10.11 | † | — | |
| 10.12 | † | — | |
| 10.13 | *† | — | |
| 10.14 | † | — | |
| 10.15 | *† | — | |
| 10.16 | | — | Sale and Contribution Agreement, dated as of October 21, 2020, by and among EnLink Midstream Funding, LLC, EnLink Midstream Operating, LP, and the originators from time to time party thereto (incorporated by reference to Exhibit 10.1 to our Current Report on Form 8-K dated October 21, 2020, filed with the Commission on October 22, 2020, file No. 001-36336). |
| 10.17 | | — | Receivables Financing Agreement, dated as of October 21, 2020, by and among EnLink Midstream Funding, LLC, as borrower, EnLink Midstream Operating, LP, as initial servicer, PNC Bank, National Association, as administrative agent and lender, the lenders party thereto, and PNC Capital Markets, LLC, as structuring agent (incorporated by reference to Exhibit 10.2 to our Current Report on Form 8-K dated October 21, 2020, filed with the Commission on October 22, 2020, file No. 001-36336). |
| 10.18 | | — | First Amendment to the Receivables Financing Agreement, dated as of February 26, 2021, by and among EnLink Midstream Funding, LLC, as borrower, EnLink Midstream Operating, LP, as initial servicer, and PNC Bank, National Association, as administrative agent and as lender (incorporated by reference to Exhibit 10.1 to our Current Report on Form 8-K dated February 26, 2021, filed with the Commission on March 1, 2021, file No. 001-36336). |
| 10.19 | | — | Second Amendment to the Receivables Financing Agreement, dated as of September 24, 2021, by and among EnLink Midstream Funding, LLC, as borrower, EnLink Midstream Operating, LP, as initial servicer, and PNC Bank, National Association, as administrative agent and as lender and PNC Capital Markets LLC, as structuring agent and sustainability agent (incorporated by reference to Exhibit 10.1 to our Current Report on Form 8-K dated September 24, 2021, filed with the Commission on September 27, 2021, file No. 001-36336). |
| 10.20 | * | — | |
| 21.1 | * | — | |
| 22.1 | * | — | |
| 23.1 | * | — | |
| 31.1 | * | — | |
| 31.2 | * | — | |
| | | | | | | | | | | |
| 32.1 | * | — | |
| 101 | * | — | The following financial information from EnLink Midstream, LLC's Annual Report on Form 10-K for the year ended December 31, 2021, formatted in iXBRL (Inline eXtensible Business Reporting Language): (i) Consolidated Balance Sheets as of December 31, 2021 and December 31, 2020, (ii) Consolidated Statements of Operations for the years ended December 31, 2021, 2020, and 2019, (iii) Consolidated Statements of Changes in Members’ Equity for the years ended December 31, 2021, 2020, and 2019, (iv) Consolidated Statements of Cash Flows for the years ended December 31, 2021, 2020, and 2019, and (v) the notes to Consolidated Financial Statements. |
| 104 | * | — | Cover Page Interactive Data File (formatted as Inline iXBRL and included in Exhibit 101). |
____________________________
* Filed herewith.
** In accordance with Item 601(a)(5) of Regulation S-K, the exhibits and schedules to Exhibit 2.1 are not filed herewith. The agreement identifies such exhibits and schedules, including the subject matter of their content. We undertake to provide copies of such exhibits and schedules to the Commission upon request.
† As required by Item 15(a)(3), this Exhibit is identified as a management contract or compensatory plan or arrangement.
SIGNATURES
Pursuant to the requirements of Section 13 or 15(d) of the Securities Exchange Act of 1934, the Registrant has duly caused this report to be signed on its behalf by the undersigned, thereunto duly authorized.
| | | | | | | | |
| ENLINK MIDSTREAM, LLC |
| |
| By: | EnLink Midstream Manager, LLC, its managing member |
| | |
| February 16, 2022 | By: | /s/ BARRY E. DAVIS |
| | Barry E. Davis |
| | Chairman and Chief Executive Officer |
Pursuant to the requirements of the Securities Exchange Act of 1934, this report has been signed below on the dates indicated by the following persons on behalf of the Registrant and in the capacities and on the dates indicated.
| | | | | | | | | | | | | | |
| | | | |
| Signature | | Title | | Date |
| | | | |
| /s/ BARRY E. DAVIS | | Chairman, Chief Executive Officer, and Director
(Principal Executive Officer) | | February 16, 2022 |
| Barry E. Davis | | |
| | | | |
| /s/ DEBORAH G. ADAMS | | Director | | February 16, 2022 |
| Deborah G. Adams | | |
| | | | |
| /s/ WILLIAM J. BRILLIANT | | Director | | February 16, 2022 |
| William J. Brilliant | | |
| | | | |
| /s/ TIFFANY THOM CEPAK | | Director | | February 16, 2022 |
| Tiffany Thom Cepak | | |
| | | | |
| /s/ LELDON E. ECHOLS | | Director | | February 16, 2022 |
| Leldon E. Echols | | |
| | | | |
| /s/ THOMAS W. HORTON | | Director | | February 16, 2022 |
| Thomas W. Horton | | |
| | | | |
| /s/ JAMES K. LEE | | Director | | February 16, 2022 |
| James K. Lee | | |
| | | | |
| /s/ SCOTT E. TELESZ | | Director | | February 16, 2022 |
| Scott E. Telesz | | |
| | | | |
| /s/ KYLE D. VANN | | Director | | February 16, 2022 |
| Kyle D. Vann | | |
| | | | |
| /s/ PABLO G. MERCADO | | Executive Vice President and Chief Financial Officer (Principal Financial Officer) | | February 16, 2022 |
| Pablo G. Mercado | | |
| | | | |
| /s/ J. PHILIPP ROSSBACH | | Vice President and Chief Accounting Officer
(Principal Accounting Officer) | | February 16, 2022 |
| J. Philipp Rossbach | | |