Exhibit 99.1
|
|
Analyst Conference January 23, 2013 1 |

Exhibit 99.1
|
|
Analyst Conference January 23, 2013 1 |
|
|
Forward-Looking Statements This presentation contains forward looking statements within the meaning of the federal securities laws. Forward-looking statements are not guarantees of performance. They involve risks, uncertainties and assumptions. The future results of Crosstex Energy, L.P., Crosstex Energy, Inc. and their respective affiliates (collectively known as “Crosstex”) may differ materially from those expressed in the forward-looking statements contained throughout this presentation and in documents filed with the SEC. Many of the factors that will determine these results are beyond Crosstex’s ability to control or predict. These statements are necessarily based upon various assumptions involving judgments with respect to the future, including, among others, prices and market demand for natural gas, natural gas liquids (NGLs), and crude oil; drilling levels; the ability to achieve synergies and revenue growth; national, international, regional and local economic, competitive and regulatory conditions and developments; technological developments; capital markets conditions; inflation rates; interest rates; the political and economic stability of oil producing nations; energy markets; weather conditions; business and regulatory or legal decisions; the pace of deregulation of retail natural gas and electricity; the timing and success of business development efforts; and other factors discussed in Crosstex’s Annual Reports or Form 10-K for the year ended December 31, 2011 and their other filings with the Securities and Exchange Commission. You are cautioned not to put undue reliance on any forward-looking statement. Crosstex has no obligation to publicly update or revise any forward looking statement, whether as a result of new information, future events or otherwise. 2 |
|
|
Non-GAAP Financial Information 3 This presentation contains non-generally accepted accounting principle financial measures that Crosstex refers to as adjusted EBITDA, distributable cash flow, gross operating margin, growth capital expenditures, maintenance capital expenditures and segment cash flow. Adjusted EBITDA is defined as net income (loss) plus interest expense, provision for income taxes and depreciation and amortization expense, impairments, stock-based compensation, loss on extinguishment of debt, (gain) loss on noncash derivatives, transaction costs associated with successful transactions, minority interest and certain severance and exit expenses, and accrued expense of a legal judgment under appeal, less (gain) loss on sale of property. Distributable cash flow is defined as earnings before certain noncash charges and the (gain) loss on the sale of assets less maintenance capital expenditures. Gross operating margin is defined as revenue minus the cost of purchased gas and natural gas liquids. Segment cash flow is defined as revenue minus the cost of purchased gas and natural gas liquids and operating and maintenance expenditures. The amounts included in the calculation of these measures are computed in accordance with generally accepted accounting principles (GAAP) with the exception of maintenance capital expenditures. Growth capital expenditures is defined as all construction-related direct labor and material costs, as well as indirect construction costs including general engineering costs and the costs of funds used in construction. Maintenance capital expenditures are capital expenditures made to replace partially or fully depreciated assets in order to maintain the existing operating capacity of the assets and to extend their useful lives. Crosstex believes these measures are useful to investors because they may provide users of this financial information with meaningful comparisons between current results and prior-reported results and a meaningful measure of Crosstex’s cash flow after it has satisfied the capital and related requirements of its operations. Adjusted EBITDA, distributable cash flow, growth capital expenditures, maintenance capital expenditures, and gross operating margin, as defined above, are not measures of financial performance or liquidity under GAAP. They should not be considered in isolation or as an indicator of Crosstex’s performance. Furthermore, they should not be seen as measures of liquidity or a substitute for metrics prepared in accordance with GAAP. |
|
|
Welcome and Introduction Mike Garberding Executive Vice President & Chief Financial Officer 4 |
|
|
Agenda Company & Industry Overview Pg. 6 Business Overview by Asset – Louisiana, Texas & Ohio River Valley Pg. 27 Growth Projects Pg. 60 Business Development Opportunities Pg. 65 Financial Overview Pg. 72 Closing Remarks Pg. 83 Appendix Pg. 85 5 |
|
|
Company & Industry Overview Barry Davis President and Chief Executive Officer 6 |
|
|
Expect to achieve 2012 adjusted EBITDA of approximately $214 MM despite commodity headwinds * Capitalized on our franchise position in south Louisiana to grow natural gas liquids (NGL) and crude business Deadwood facility in Permian basin operating at capacity within first year of operations Grew fee-based NGL business: began construction of Cajun-Sibon I, initiated Cajun-Sibon II Grew fee-based crude/condensate business: completed Riverside Phase I, began construction of Riverside Phase II Diversified geographically: acquired Ohio River Valley assets and established Permian JV Strong YOY dividend / distribution growth: XTEX distributions declared of $1.32/unit (+7%); XTXI dividends declared of $0.48/share (+20%) Raised ~$650 MM of equity and debt capital over past 12 months to fund growth projects and acquisitions No near-term maturities and over $600 MM of available liquidity Successful Execution Maximize earnings, growth of existing businesses 2012 Accomplishments 7 Our Strategy Enhance scale, diversification Maintain solid financial performance, balance sheet We did what we said we would do. * 2012 estimates are preliminary, based on unaudited numbers and are subject to change. |
|
|
Compelling Investment Opportunity 8 Positioned to benefit from a robust energy environment The Right Opportunities: Transformative Growth Ability to deliver transformative growth with a keen focus on fee-based projects that have geographic and product diversity The Right People: Experienced Team High quality management with significant industry experience Dynamic Energy Market Provides creative solutions that are tailored to customers’ needs Integrated Midstream Energy Solutions The Right Platform: Strategic Asset Base Strategically located assets and the right MLP / GP structure |
|
|
Critical Trends for 2013+ Robust industry environment with focus on rich gas and crude Slow development of lean gas in near term Ethane supply is currently out-stripping demand Scale and diversity are highly valued in marketplace 9 |
|
|
Projected U.S. Supply/Demand Balance * Pipeline Infrastructure Capital Spending Needed Per Year in the U.S.*** Dynamic Energy Market 10 (Liquid Petroleum Products Volume, 000 Bbl/d) (2011 – 2035, $MM) Surging U.S. Production Requires the Re-Piping of America, With Expected Midstream Investment of $10 Billion Annually for 20+ years *** * Source: PIRA Energy Group ** Source: Energy Information Administration (EIA) *** Source: Interstate Natural Gas Association of America | 2005 | 2006 | 2007 | 2008 | 2009 | 2010 | 2011 | 2012 | 2013 | 2014 | 2015 | 2016 | 2017 | 2018 | 2019 | 2020 | 70% Decrease in Imports U.S. Shale Gas Marketed Production ** (Bcf/d) |
|
|
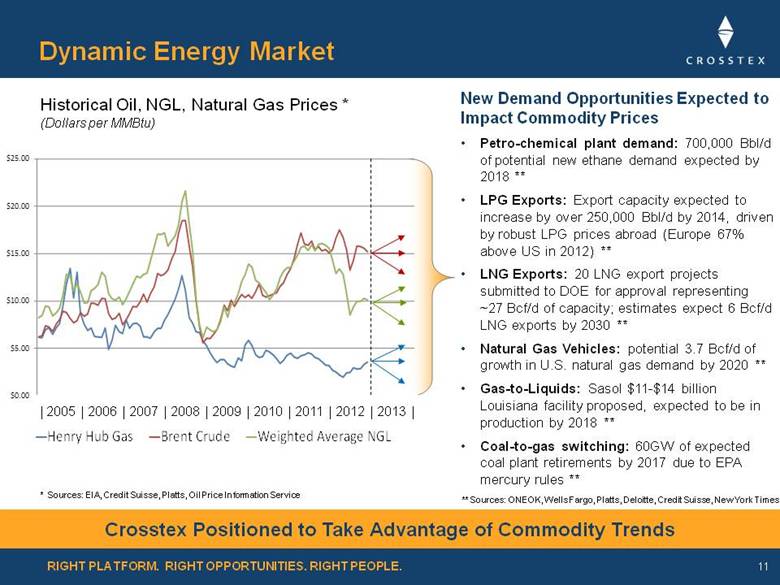
Dynamic Energy Market New Demand Opportunities Expected to Impact Commodity Prices Petro-chemical plant demand: 700,000 Bbl/d of potential new ethane demand expected by 2018 ** LPG Exports: Export capacity expected to increase by over 250,000 Bbl/d by 2014, driven by robust LPG prices abroad (Europe 67% above US in 2012) ** LNG Exports: 20 LNG export projects submitted to DOE for approval representing ~27 Bcf/d of capacity; estimates expect 6 Bcf/d LNG exports by 2030 ** Natural Gas Vehicles: potential 3.7 Bcf/d of growth in U.S. natural gas demand by 2020 ** Gas-to-Liquids: Sasol $11-$14 billion Louisiana facility proposed, expected to be in production by 2018 ** Coal-to-gas switching: 60GW of expected coal plant retirements by 2017 due to EPA mercury rules ** 11 Historical Oil, NGL, Natural Gas Prices * (Dollars per MMBtu) Crosstex Positioned to Take Advantage of Commodity Trends * Sources: EIA, Credit Suisse, Platts, Oil Price Information Service ** Sources: ONEOK, Wells Fargo, Platts, Deloitte, Credit Suisse, New York Times | 2005 | 2006 | 2007 | 2008 | 2009 | 2010 | 2011 | 2012 | 2013 | |
|
|
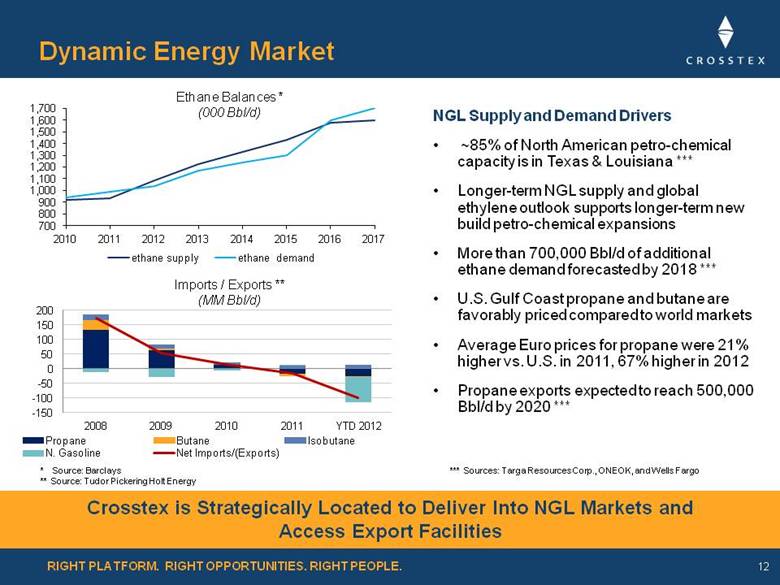
Dynamic Energy Market 12 Crosstex is Strategically Located to Deliver Into NGL Markets and Access Export Facilities NGL Supply and Demand Drivers ~85% of North American petro-chemical capacity is in Texas & Louisiana *** Longer-term NGL supply and global ethylene outlook supports longer-term new build petro-chemical expansions More than 700,000 Bbl/d of additional ethane demand forecasted by 2018 *** U.S. Gulf Coast propane and butane are favorably priced compared to world markets Average Euro prices for propane were 21% higher vs. U.S. in 2011, 67% higher in 2012 Propane exports expected to reach 500,000 Bbl/d by 2020 *** * Source: Barclays ** Source: Tudor Pickering Holt Energy Ethane Balances * (000 Bbl/d) Imports / Exports ** (MM Bbl/d) *** Sources: Targa Resources Corp., ONEOK, and Wells Fargo |
|
|
Compelling Investment Opportunity 13 Positioned to benefit from a robust energy environment The Right Opportunities: Transformative Growth Ability to deliver transformative growth with a keen focus on fee-based projects that have geographic and product diversity The Right People: Experienced Team High quality management with significant industry experience Dynamic Energy Market Provides creative solutions that are tailored to customers’ needs Integrated Midstream Energy Solutions The Right Platform: Strategic Asset Base Strategically located assets and the right MLP / GP structure |
|
|
Crosstex Midstream Services in 2007 14 The Midstream Value Chain A critical part of energy infrastructure responsible for moving product from well-head to consumption |
|
|
Crosstex Midstream Services Today 15 The Midstream Value Chain A critical part of energy infrastructure responsible for moving product from well-head to consumption |
|
|
Tailored Customer Service 16 Partnering with Crosstex was a significant factor in Devon’s successful acquisition of Chief Oil & Gas’ North Texas properties in 2006. Since the acquisition, we have effectively worked with Crosstex to develop efficient processes which ensure Devon’s production gets to market in a timely and proficient manner. - Greg Dodd, Vice President - Marketing & Supply, Devon Energy Deadwood is a key asset for Apache in the Permian Basin, and Crosstex Energy helped make it possible for us to realize its full potential through an innovative midstream solution. Crosstex is a valued partner that delivered the way it said it would. - John Christmann, Regional Vice President - Permian, Apache Corp. |
|
|
Compelling Investment Opportunity 17 Positioned to benefit from a robust energy environment The Right Opportunities: Transformative Growth Ability to deliver transformative growth with a keen focus on fee-based projects that have geographic and product diversity The Right People: Experienced Team High quality management with significant industry experience Dynamic Energy Market Provides creative solutions that are tailored to customers’ needs Integrated Midstream Energy Solutions The Right Platform: Strategic Asset Base Strategically located assets and the right MLP / GP structure |
|
|
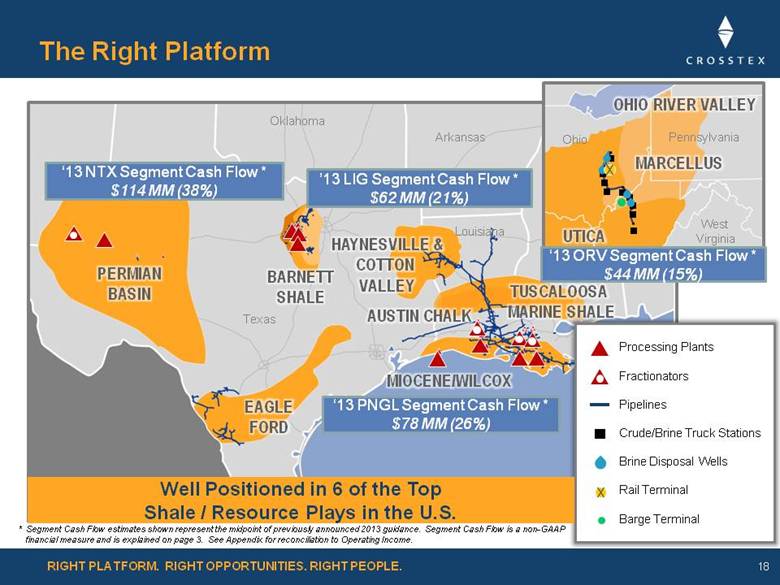
The Right Platform 18 Pennsylvania Ohio West Virginia Texas Oklahoma Louisiana Arkansas ‘13 NTX Segment Cash Flow * $114 MM (38%) ‘13 PNGL Segment Cash Flow * $78 MM (26%) ’13 LIG Segment Cash Flow * $62 MM (21%) ‘13 ORV Segment Cash Flow * $44 MM (15%) Processing Plants Fractionators Pipelines Crude/Brine Truck Stations Brine Disposal Wells Rail Terminal Barge Terminal * Segment Cash Flow estimates shown represent the midpoint of previously announced 2013 guidance. Segment Cash Flow is a non-GAAP financial measure and is explained on page 3. See Appendix for reconciliation to Operating Income. Well Positioned in 6 of the Top Shale / Resource Plays in the U.S. |
|
|
Dist./Q Split Level < $0.2500 2% / 98% < $0.3125 15% / 85% < $0.3750 25% / 75% > $0.3750 50% / 50% The Right Platform 19 Public Shareholders Public Unitholders 2% GP Interest 100% IDRs Crosstex Energy, Inc. (NASDAQ: XTXI) Directors / Executive Officers * Crosstex Energy Services, L.P. All Assets and Operations Crosstex Energy, L.P. (NASDAQ: XTEX) GSO Crosstex Holdings Current Position 100% 64% 77% 23% 17% 17% 2% Crosstex Energy GP, LLC * GSO’s investment in XTXI is included in percentage ownership. |
|
|
Compelling Investment Opportunity 20 Positioned to benefit from a robust energy environment The Right Opportunities: Transformative Growth Ability to deliver transformative growth with a keen focus on fee-based projects that have geographic and product diversity The Right People: Experienced Team High quality management with significant industry experience Dynamic Energy Market Provides creative solutions that are tailored to customers’ needs Integrated Midstream Energy Solutions The Right Platform: Strategic Asset Base Strategically located assets and the right MLP / GP structure |
|
|
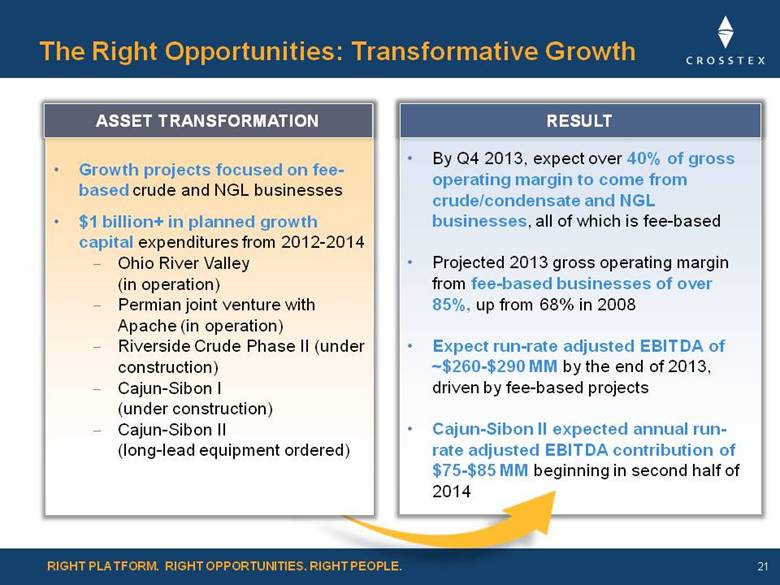
By Q4 2013, expect over 40% of gross operating margin to come from crude/condensate and NGL businesses, all of which is fee-based Projected 2013 gross operating margin from fee-based businesses of over 85%, up from 68% in 2008 Expect run-rate adjusted EBITDA of ~$260-$290 MM by the end of 2013, driven by fee-based projects Cajun-Sibon II expected annual run-rate adjusted EBITDA contribution of $75-$85 MM beginning in second half of 2014 Growth projects focused on fee-based crude and NGL businesses $1 billion+ in planned growth capital expenditures from 2012-2014 Ohio River Valley (in operation) Permian joint venture with Apache (in operation) Riverside Crude Phase II (under construction) Cajun-Sibon I (under construction) Cajun-Sibon II (long-lead equipment ordered) The Right Opportunities: Transformative Growth 21 ASSET TRANSFORMATION RESULT |
|
|
22 Note: Segment Cash Flow is a non-GAAP financial measure and is explained on page 3. See Appendix for reconciliation to Operating Income. * 2013 estimates represent the midpoint of previously announced 2013 guidance. Crude / Condensate / NGL / Brine 41% Gas 59% Commodity Sensitive 14% Fee-Based 86% Crude / Condensate / NGL / Brine 59% Gas 41% Fee-Based 87% Est. Q4-14 Run Rate NGL 8% Gas 92% Commodity Sensitive 30% Fee-Based 70% 2010 Commodity Sensitive 13% The Right Opportunities: Transformative Growth 2013 * Segment Cash Flows by Product Segment Cash Flows by Contract Type |
|
|
23 The Right Opportunities: Transformative Growth Distribution and Dividend Growth Projections 4th Quarter Annualized XTEX Distribution CAGR: 13.5% XTXI Dividend CAGR: 28.6% Defined large scale growth projects in 2013 and 2014 will drive distribution and dividend growth in 2014 and beyond We anticipate annual distribution growth rates of 8 percent to 10 percent per year and dividend growth rates of 20 percent to 25 percent per year Note: Segment Cash Flow is a non-GAAP financial measure and is explained on page 3. See Appendix for reconciliation to Operating Income * 2013 estimates represent the midpoint of previously announced 2013 guidance. |
|
|
Compelling Investment Opportunity 24 Positioned to benefit from a robust energy environment The Right Opportunities: Transformative Growth Ability to deliver transformative growth with a keen focus on fee-based projects that have geographic and product diversity The Right People: Experienced Team High quality management with significant industry experience Dynamic Energy Market Provides creative solutions that are tailored to customers’ needs Integrated Midstream Energy Solutions The Right Platform: Strategic Asset Base Strategically located assets and the right MLP / GP structure |
|
|
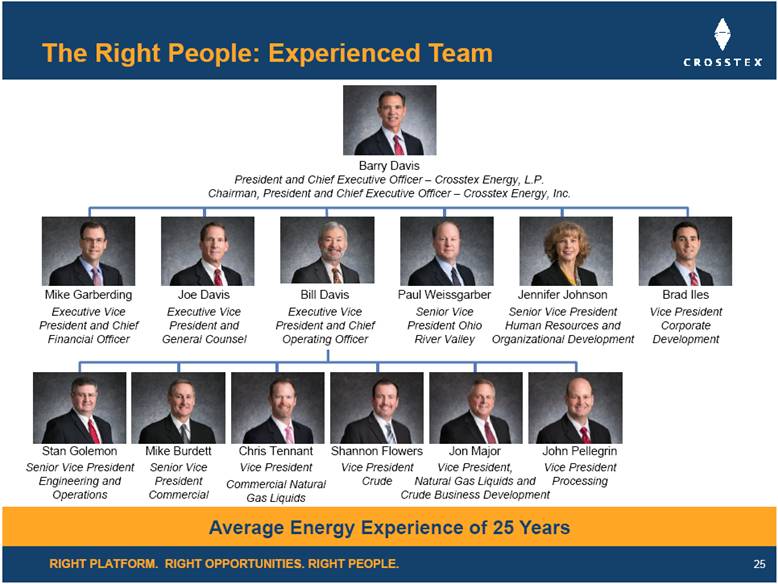
The Right People: Experienced Team 25 Barry Davis President and Chief Executive Officer – Crosstex Energy, L.P. Chairman, President and Chief Executive Officer – Crosstex Energy, Inc. Mike Garberding Executive Vice President and Chief Financial Officer Joe Davis Executive Vice President and General Counsel Paul Weissgarber Senior Vice President Ohio River Valley Jennifer Johnson Senior Vice President Human Resources and Organizational Development Brad Iles Vice President Corporate Development Chris Tennant Vice President Commercial Natural Gas Liquids Stan Golemon Senior Vice President Engineering and Operations Mike Burdett Senior Vice President Commercial Shannon Flowers Vice President Crude Jon Major Vice President, Natural Gas Liquids and Crude Business Development Bill Davis Executive Vice President and Chief Operating Officer Average Energy Experience of 25 Years John Pellegrin Vice President Processing |
|
|
26 The Right Opportunities $1 billion+ in planned growth capital expenditures from 2012 - 2014 By Q4 ’14, approximately 60% of gross operating margin expected to come from fee-based crude/ condensate, NGL and brine business Expect run-rate adjusted EBITDA of ~$260-$290 MM by the end of 2013 The Right Platform Active in 6 of major basins, provides geographic and product diversity Franchise position in south Louisiana NGL markets provides strategic footprint for growth Projected 2013 gross operating margin from fee-based business of over 85% Dynamic Energy Market Domestic production growth rates unprecedented in modern history INGAA projects ~$10 billion per year in infrastructure spending needed to meet market needs Focus in liquids-rich and crude resource plays Crosstex: Compelling Investment Opportunity |
|
|
Business Overview by Asset 27 Bill Davis Executive Vice President, Chief Operating Officer |
|
|
The Right Platform 28 Pennsylvania Ohio West Virginia Texas Oklahoma Louisiana Arkansas Well Positioned in 6 of the Top Shale / Resource Plays in the U.S. Processing Plants Fractionators Pipelines Crude/Brine Truck Stations Brine Disposal Wells Rail Terminal Barge Terminal |
|
|
Louisiana Assets PNGL Chris Tennant Vice President, Commercial Natural Gas Liquids LIG Mike Burdett Senior Vice President, Commercial 29 |
|
|
Louisiana Assets: Solid Franchise Position 30 Processing Plants Fractionators Pipelines Storage Third Party Facility Louisiana Mississippi Texas Mont Belvieu |
|
|
PNGL: The Right Platform for NGL Growth 31 Louisiana Mississippi Texas Mont Belvieu Sabine Pass Blue Water Pelican Napoleonville Riverside Eunice Plaquemine Processing Plants Fractionators PNGL Pipeline Cajun-Sibon Expansion NGL Storage Third Party Facility |
|
|
Note: Segment Cash Flow is a non-GAAP financial measure and is explained in greater detail on page 3. See Appendix for reconciliation to Operating Income. * 2012 estimates are preliminary, based on unaudited numbers and are subject to change. ** 2013 estimates represent the midpoint of previously announced 2013 guidance. Segment Cash Flows ($MM) Volumes PNGL: Segment Cash Flows & Volumes Positioned for Growth Processing Assets 4 processing plants with total capacity of 1.7 Bcf/d 3 fractionation plants with total capacity of 53,800 Bbl/d 440 miles of NGL pipelines connected to plants 3.1 MM Bbl of underground NGL storage capacity 32 Crude Handling Assets 2 crude terminals with total capacity of 7,000 Bbl/d $39 $51 $48 $78 2010 2011 2012E* 2013E** |
|
|
PNGL: The Right Opportunities Current Trends Prolific upstream drilling activity Current shortage of fractionation capacity Robust petro-chemical margins Expanding Gulf Coast petro-chemical markets and NGL export facilities Competitive Advantages Growth projects utilize existing asset network versus standalone greenfield development Downstream delivery optionality – pipeline, barge, truck, rail Established relationship with petro-chemical and refinery customers Strategically located assets allow customers to diversify fractionation locations away from single hub Access to premium markets 33 +1.3 MM Bbl/d or 48% Increase Source: Bentek U.S. NGL Production |
|
|
PNGL Case Study: Production Growth vs. Louisiana Demand 34 CAGR -10.5% CAGR -4.4% CAGR 3.3% * Ethane production is back calculated using EIA’s total NGL production and Moody’s NGL basket composition. |
|
|
PNGL Case Study: Louisiana Demand 35 Potential 87,000 Bbl/d Increase in Ethane Demand, Plus Additional Upside As Feedstock Mix Shifts Towards Ethane Source: Hodson Report estimates, December 2012 Current Capacity Potential Expansions Company Location/Unit C2 bbls / day C3 bbls / day Ethylene Capacity (MM Lbs / Yr) Ethylene Capacity (MM Lbs / Yr) Dow Plaquemine LHC2, LA 23,000 7,000 1,100 - Dow Plaquemine LHC3, LA 15,000 31,000 1,600 - Dow St. Charles, LA 20,000 42,000 2,200 880 ExxonMobil Baton Rouge, LA 31,000 7,000 2,175 - LyondellBasell Clinton, LA 23,000 5,000 1,050 - Sasol NA Lake Charles, LA 26,000 - 1,020 2,200 Shell Norco GO1, LA 13,000 20,000 1,250 - Shell Norco OL5, LA 19,000 33,000 1,880 - Westlake Lake Charles #1, LA 32,000 - 1,250 250 Westlake Lake Charles #2, LA 22,000 10,000 1,150 235 Williams Olefins Geismar, LA 28,000 9,000 1,350 600 Total in Louisiana 247,000 161,000 16,025 4,165 Total U.S. Current Ethylene Capacity 58,700 % of Total U.S. Capacity Currently in Louisiana 27% Current Feedstock |
|
|
PNGL: Short-Term & Long-Term Strategy Short-Term Strategy Fully utilize existing asset capacity Reactivate and leverage idle assets Short-term optimization – spot deals, trans-loading condensate, and receipt of stranded NGL & crude barrels Increase supply security and delivery capabilities for our customers Long-Term Strategy Contract, manage and optimize supply and fractionation contracts across multiple shale developments and market hubs such as Permian Basin, North Texas, Mont Belvieu and Louisiana Leverage franchise position to take advantage of local production growth Expand Cajun-Sibon platform through bolt-on growth projects 36 |
|
|
Plaquemine LIG: Franchise System in Louisiana 37 Gibson Louisiana Mississippi Texas |
|
|
LIG: Solid History of Segment Cash Flows & Volumes LIG Transmission Assets 2,000 miles of pipeline Plaquemine Plant 225 MMcf/d treating and cryogenic plant Gibson Plant 110 MMcf/d cryogenic plant 38 Segment Cash Flows ($MM) Volumes (000 MMBtu/d) $82 $95 $80 $62 Note: Segment Cash Flow is a non-GAAP financial measure and is explained in greater detail on page 3. See Appendix for reconciliation to Operating Income. * 2012 estimates are preliminary, based on unaudited numbers and are subject to change. ** 2013 estimates represent the midpoint of previously announced 2013 guidance. |
|
|
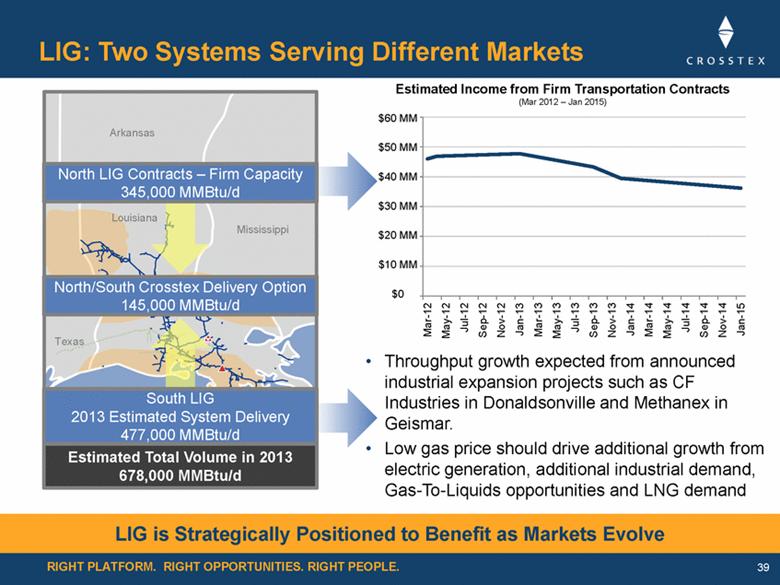
RIGHT PLATFORM. RIGHT OPPORTUNITIES. RIGHT PEOPLE. LIG: Two Systems Serving Different Markets •Throughput growth expected from announced industrial expansion projects such as CF Industries in Donaldsonville and Methanex in Geismar. •Low gas price should drive additional growth from electric generation, additional industrial demand, Gas-To-Liquids opportunities and LNG demand 39 LIG is Strategically Positioned to Benefit as Markets Evolve Mar-12 May-12 Jul-12 Sep-12 Nov-12 Jan-13 Mar-13 May-13 Jul-13 Sep-13 Nov-13 Jan-14 Mar-14 May-14 Jul-14 Sep-14 Nov-14 Jan-15 Estimated Income from Firm Transportation Contracts (Mar 2012 – Jan 2015) North LIG Contracts – Firm Capacity 345,000 MMBtu/d South LIG 2013 Estimated System Delivery 477,000 MMBtu/d North/South Crosstex Delivery Option 145,000 MMBtu/d Estimated Total Volume in 2013 678,000 MMBtu/d Mississippi Louisiana Arkansas Texas $60 MM $50 MM $40 MM $30 MM $20 MM $10 MM $0 |
|
|
LIG: Current Trends & Competitive Advantages Current Trends Tuscaloosa Marine Shale / Austin Chalk activity in central Louisiana continues in early stages of development. Participants are Anadarko, EOG, Halcon, Encana, Devon, Goodrich, & Nelson Energy/Pryme Energy Low gas prices – low feedstock costs for petro-chemical, fertilizer and methanol manufacturers have resulted in planned plant expansions and new greenfield projects along the Mississippi River 40 Competitive Advantages Full suite of midstream services offered to producers and industrials Long-term, take-or-pay transportation contracts in north LIG Excellent relationships with end users forged over multiple years of service Positioned to take advantage of new developments around assets |
|
|
LIG: Growth Strategies Short-Term Strategy Protect and maximize income from existing business Identify and develop processing opportunities across the LIG system Aggressively pursue wellhead supply and strategic interconnects throughout LIG Austin Chalk/Tuscaloosa Marine Shale plays Deep drilling opportunities in Gulf of Mexico Industrial plant expansions along the Mississippi River Long-Term Strategy Expand franchise position – wellhead to plant to end user value chain Exceptional connectivity to interstate markets – connected to 7 major interstate pipelines Pursue acquisitions and asset consolidations Capitalize on access to river markets on south LIG 41 Well Positioned to Take Advantage of New and Existing Shale Developments |
|
|
Texas Assets North Texas / West Texas Mike Burdett Senior Vice President, Commercial Howard Energy Bill Davis Executive Vice President, Chief Operating Officer 42 |
|
|
Texas Assets: Solid Franchise Position 43 Processing Plant Fractionator Pipelines Texas New Mexico |
|
|
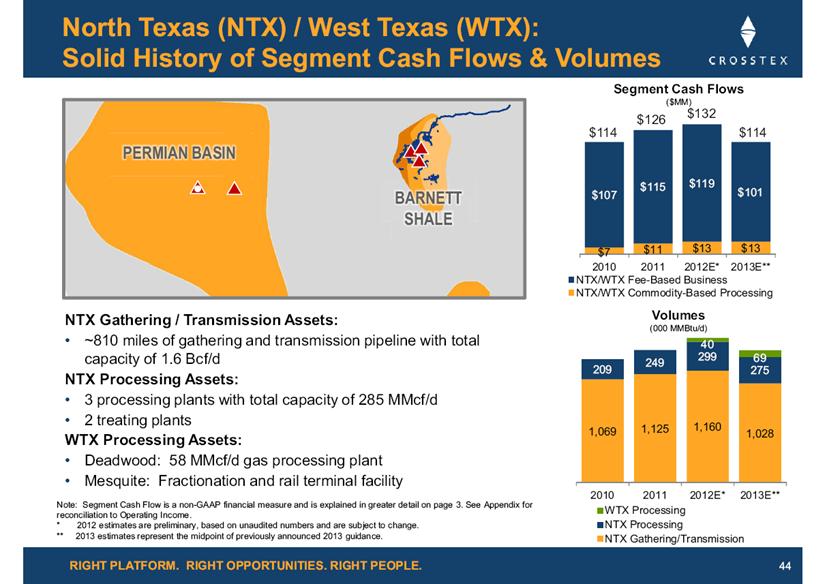
RIGHT PLATFORM. RIGHT OPPORTUNITIES. RIGHT PEOPLE. North Texas (NTX) / West Texas (WTX): Solid History of Segment Cash Flows & Volumes NTX Gathering / Transmission Assets: ~810 miles of gathering and transmission pipeline with total capacity of 1.6 Bcf/d NTX Processing Assets: 3 processing plants with total capacity of 285 MMcf/d 2 treating plants WTX Processing Assets: Deadwood: 58 MMcf/d gas processing plant Mesquite: Fractionation and rail terminal facility 44 Segment Cash Flows ($MM) Volumes (000 MMBtu/d) $7 $11 $13 $13 $107 $115 $119 $101 2010 2011 2012E* 2013E** NTX/WTX Fee-Based Business NTX/WTX Commodity-Based Processing 1,069 1,125 1,160 1,028 209 249 299 275 40 69 2010 2011 2012E* 2013E** WTX Processing NTX Processing NTX Gathering/Transmission $114 $126 $132 $114 PERMIAN BASIN BARNETT SHALE Note: Segment Cash Flow is a non-GAAP financial measure and is explained in greater detail on page 3. See Appendix for reconciliation to Operating Income. * 2012 estimates are preliminary, based on unaudited numbers and are subject to change. ** 2013 estimates represent the midpoint of previously announced 2013 guidance. |
|
|
North Texas Barnett Shale: Strategically Positioned Assets 45 Dry/Lean Rich/Wet Processing Plant North Texas Pipeline North Texas Gathering Silver Creek Azle Goforth |
|
|
NTX: Current Trends & Competitive Advantages Current Trends Improved rig efficiency, pad drilling, completion technology, longer laterals, reduced drilling and completion costs mitigates impact of fewer rigs Higher initial flow rates and estimated ultimate recoveries (EURs) Drilling in rich areas remains focus for 2013 Competitive Advantage Strong position in Core and Tier 1 areas 50% of future drilling expected to occur within 3 miles of existing infrastructure Significant exposure to rich portion of play Lower wellhead pressures than most competitors - enhances production 46 * Source: Credit Suisse Monthly Well Completions per Rig * Barnett Shale EURs * (Bcfe) |
|
|
West Texas Permian Basin: Platform for Growth 47 Deadwood Gas Plant Mesquite Terminal Processing Plant Fractionator Apache Acreage Apache Deadwood Gathering Mesquite Liquids Pipeline Chevron Liquids Pipeline Enterprise Gas Pipeline |
|
|
Glasscock County WTX: Current Trends & Competitive Advantages Current Trends Producers targeting multiple pay zones Competitive Advantage Strategic relationship with Apache Corp, which is one of the most active drillers in the Permian basin Mesquite assets provide logistical flexibility for NGLs and crude 48 Mesquite Plant Central Basin Platform + N/NW Shelf Midland Basin Cline Shale Mesquite Plant Delaware Basin Glasscock County Wolfcamp Shale Source: Wells – Rig Data Regions – Apache 11.14.12 |
|
|
NTX / WTX Assets: Short-Term & Long-Term Strategy NTX Short-Term Strategy Grow via opportunistic acquisitions and consolidations Keep plants full via offloads Focused optimization programs Capitalize on continued steady drilling in liquids-rich areas Increase market share by enhancing producer relationships, provide alternate tie-in points, lowering pressures Long-Term Strategy Strategic acquisitions / JV’s / exchanges Renegotiate and extend key contracts Consolidate G & P assets – strategic areas Enhance established strong position to benefit as prices rebound WTX Short-Term Strategy Expand Deadwood – JV partner and 3rd party gas Optimize Mesquite – NGL pipe/rail, crude trans-loading Long-Term Strategy Develop additional plant and gathering infrastructure Leverage Mesquite’s location & capabilities to grow propane, crude trans-loading and trucking businesses Develop crude gathering business 49 |
|
|
Strategic partnership to pursue opportunities in Eagle Ford Shale; Crosstex, Quanta Services and GE each own 30.6% 500 miles of pipeline in western Eagle Ford with lean and rich gas capabilities Anticipated 2013 distribution of $10-$15 million Howard Energy Partners: Eagle Ford Footprint Howard Energy Pipelines 50 |
|
|
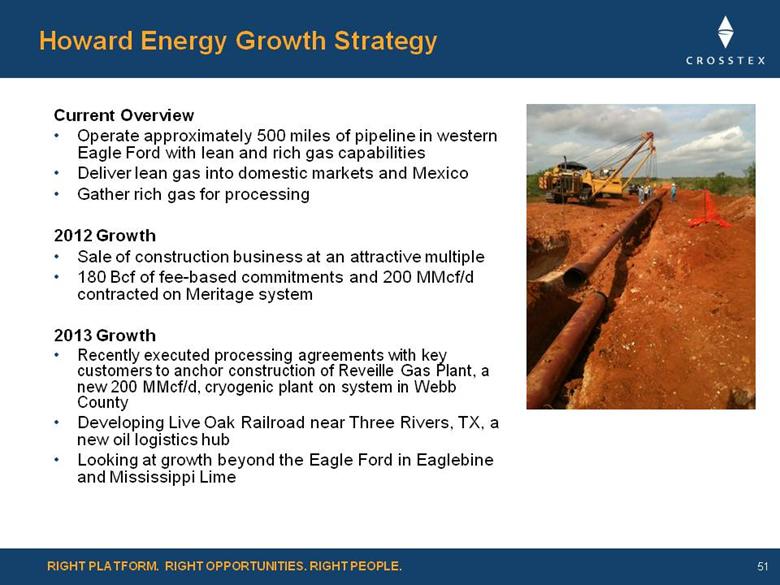
Howard Energy Growth Strategy Current Overview Operate approximately 500 miles of pipeline in western Eagle Ford with lean and rich gas capabilities Deliver lean gas into domestic markets and Mexico Gather rich gas for processing 2012 Growth Sale of construction business at an attractive multiple 180 Bcf of fee-based commitments and 200 MMcf/d contracted on Meritage system 2013 Growth Recently executed processing agreements with key customers to anchor construction of Reveille Gas Plant, a new 200 MMcf/d, cryogenic plant on system in Webb County Developing Live Oak Railroad near Three Rivers, TX, a new oil logistics hub Looking at growth beyond the Eagle Ford in Eaglebine and Mississippi Lime 51 |
|
|
Ohio River Valley (ORV) Assets Paul Weissgarber Senior Vice President of ORV 52 |
|
|
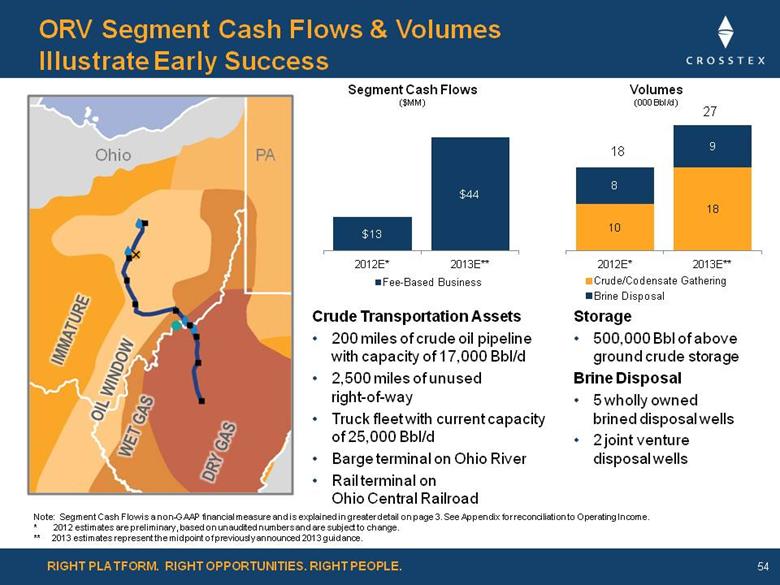
Ohio River Valley Assets: A Great Platform for Growth 53 Killbuck Black Run Sego Corning Lowell Bells Run & Eureka Nutter Brooksville Stockley Ohio Pennsylvania West Virginia Ohio River Valley Crude Pipeline Crude & Brine Truck Stations Brine Disposal Well Rail Terminal Barge Terminal X |
|
|
Crude Transportation Assets 200 miles of crude oil pipeline with capacity of 17,000 Bbl/d 2,500 miles of unused right-of-way Truck fleet with current capacity of 25,000 Bbl/d Barge terminal on Ohio River Rail terminal on Ohio Central Railroad ORV Segment Cash Flows & Volumes Illustrate Early Success 54 Storage 500,000 Bbl of above ground crude storage Brine Disposal 5 wholly owned brined disposal wells 2 joint venture disposal wells Segment Cash Flows ($MM) Volumes (000 Bbl/d) 18 27 Ohio PA Note: Segment Cash Flow is a non-GAAP financial measure and is explained in greater detail on page 3. See Appendix for reconciliation to Operating Income. * 2012 estimates are preliminary, based on unaudited numbers and are subject to change. ** 2013 estimates represent the midpoint of previously announced 2013 guidance. |
|
|
ORV: Current Trends Illustrate Great Potential 55 Source: ITG 2 3 1 ORV Pipeline Current Well Results Rex Energy’s Brace #1H well (Carroll County): Tested at a peak rate of 285 Boe/d of condensate, 339 Boe/d of natural gas, and 470 Boe/d of NGL Gulfport’s Boy Scout 1-33H (Harrison County): Tested at a peak rate of 1,560 Boe/d of condensate, 888 Boe/d of natural gas, and 1,008 Boe/d of NGL Gulfport’s Ryser 1-25H (Harrison County): Tested at a peak rate of 1,488 Boe/d of condensate, 777 Boe/d of natural gas, and 649 Boe/d of NGL 2 3 1 |
|
|
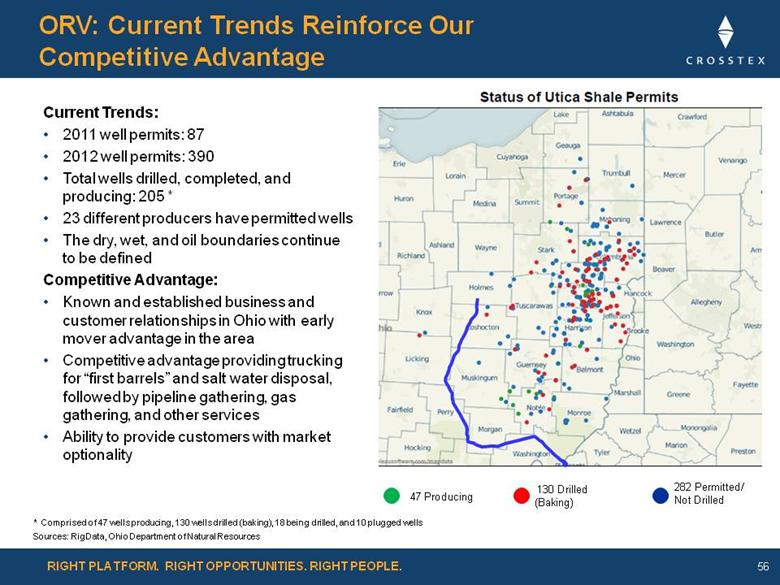
ORV: Current Trends Reinforce Our Competitive Advantage 56 Current Trends: 2011 well permits: 87 2012 well permits: 390 Total wells drilled, completed, and producing: 205 * 23 different producers have permitted wells The dry, wet, and oil boundaries continue to be defined Competitive Advantage: Known and established business and customer relationships in Ohio with early mover advantage in the area Competitive advantage providing trucking for “first barrels” and salt water disposal, followed by pipeline gathering, gas gathering, and other services Ability to provide customers with market optionality 130 Drilled (Baking) 282 Permitted/ Not Drilled 47 Producing Sources: RigData, Ohio Department of Natural Resources * Comprised of 47 wells producing, 130 wells drilled (baking), 18 being drilled, and 10 plugged wells |
|
|
ORV Case Study: Condensate Focus Condensate Facts Higher gravity oil (>45-50° API) considered condensate Condensate often has methane, ethane and propane components (NGLs) The natural gasoline (C5/C6 stream) produced from natural gas processing plants is sometimes referred to as plant condensate ORV Condensate Market Local refineries currently have capacity to serve ~190 wells (38,000 Bbl/d) condensate supply; expanding to be able to serve ~265 wells (53,000 Bbl/d) As volumes ramp up in near term, any additional volumes over this amount will have to leave the region 57 Distillation Comparison * (Percent of Volume) Local Refinery Condensate Supply & Demand ** (in Bbl/d) * Note: missing fraction is light ends. Source is IHS Purvin & Gurtz ** Source: Crosstex research |
|
|
ORV: Growth and Expansion Opportunities 58 SHORT-TERM STRATEGY - KEY GROWTH PROJECTS Project 1 Truck condensate to Marathon’s Canton refinery Online Project 2 Barge condensate from Bells Run Station Online Increase Condensate Volume (Truck/Barge) Project 3 Rail condensate from Black Run Station Expected Q2-Q3 2013 Project 4 Complete brine disposal well in West Virginia Online Project 5 Drill additional brine disposal well in Ohio Expected Q2 2013 Project 6 Achieve efficiency gains with our trucking capabilities by upgrading technology Completed Increase Condensate Volume (Rail) Improved Efficiency / Pricing Increase Brine Water Volume |
|
|
ORV: Our Future Looks Bright 59 Build additional storage for condensate at Bells Run as a market hub Expand presence in condensate stabilization and product marketing Work with third parties and end users to expand crude/condensate gathering and take-away system through utilizing existing right-of-way as production ramps up Leverage rail terminal and truck fleet to gather crude volumes as crude oil window gets developed MEDIUM AND LONG-TERM STRATEGY – KEY GROWTH INITIATIVES |
|
|
60 Growth Projects Stan Golemon Senior Vice President of Engineering & Operations Chris Tennant Vice President , Commercial Natural Gas Liquids |
|
|
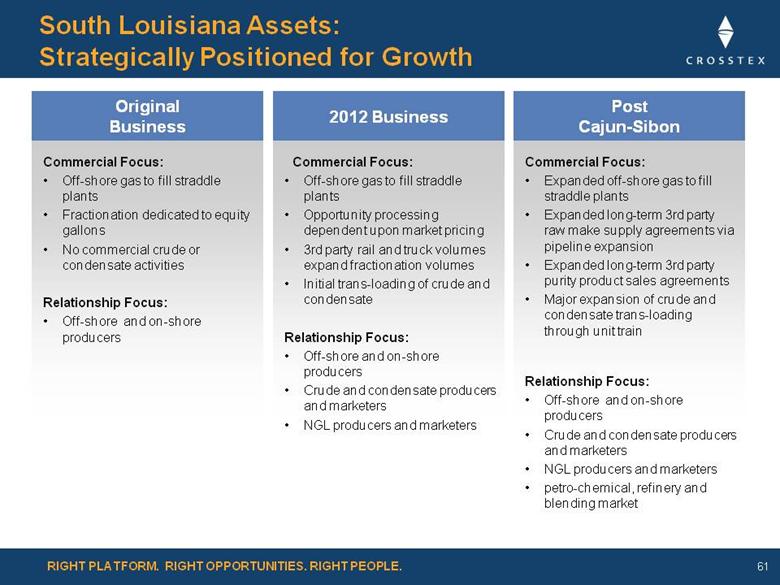
Commercial Focus: Off-shore gas to fill straddle plants Fractionation dedicated to equity gallons No commercial crude or condensate activities Relationship Focus: Off-shore and on-shore producers Commercial Focus: Off-shore gas to fill straddle plants Opportunity processing dependent upon market pricing 3rd party rail and truck volumes expand fractionation volumes Initial trans-loading of crude and condensate Relationship Focus: Off-shore and on-shore producers Crude and condensate producers and marketers NGL producers and marketers Commercial Focus: Expanded off-shore gas to fill straddle plants Expanded long-term 3rd party raw make supply agreements via pipeline expansion Expanded long-term 3rd party purity product sales agreements Major expansion of crude and condensate trans-loading through unit train Relationship Focus: Off-shore and on-shore producers Crude and condensate producers and marketers NGL producers and marketers petro-chemical, refinery and blending market 61 South Louisiana Assets: Strategically Positioned for Growth Post Cajun-Sibon 2012 Business Original Business |
|
|
PNGL Cajun-Sibon I: Leverage Franchise Position in S. LA NGL Markets to Expand Fee-Based NGL Services 62 Sabine Pass Blue Water Pelican Napoleonville Plaquemine Eunice Processing Plants Fractionators PNGL Pipeline NGL Storage Third Party Plant Gibson Riverside Mont Belvieu |
|
|
PNGL Cajun-Sibon II: Taking Advantage of the Market’s Support by Further Optimizing our Assets 63 Sabine Pass Blue Water Pelican Napoleonville Plaquemine Eunice Processing Plants Fractionators PNGL Pipeline Bayou Jack Pipeline NGL Storage Third Party Plant Gibson Riverside Mont Belvieu |
|
|
Riverside Crude Terminal Activity Phase I modifications allowed for crude trans-loading from rail to barge at approximately 4,500 Bbl/d, in service since January 2012 Phase II development includes new storage tank facilities, upgraded pipeline connections and improved barge delivery capabilities on the Mississippi River with trans-loading capacity of approximately 15,000 Bbl/d Phases I and II are projected to average approximately $10 MM annually of stable fee-based cash flow Addition of unit train capabilities are currently under review 64 Site Location: Riverside Plant |
|
|
Business Development Opportunities Brad Iles Vice President of Corporate Development Jon Major Vice President of Business Development 65 |
|
|
Abundant Shale Opportunities Create High Demand for S. Louisiana Capabilities Key Macro Trends Shale crude and wet gas driving liquid hydrocarbon expansions across U.S. Abundant supply of ethane fueling petro-chemical resurgence along U.S. Gulf Coast Continued low gas prices drive overall competitiveness of energy hungry industries, repurposing of transmission pipelines Lack of supply to market infrastructure driving heavy midstream development activities Basins 66 Crosstex Shale Plays |
|
|
Well-Positioned Across the Value Chain Leveraging NGL logistics and marketing expertise Access to Gulf Coast Markets via Cajun Sibon I & II, Eunice, and Riverside connectivity Crude and condensate rail, barge, and pipeline logistics Experience in large scale shale development Barnett and Haynesville early movers Capability to provide full services for rich gas, condensate and crude development 67 ... |
|
|
Focused on Building On Our Existing Platforms: Permian 68 Opportunities Deadwood Plant is currently full Short-term: insufficient crude pipeline takeaway from the Permian Long-Term: crude pipeline takeaway to Cushing and Houston is sufficient for volume forecasts Solutions Expand Deadwood with cryo from inventory Utilize Mesquite rail capacity to provide crude trans-loading services Focus on crude gathering and logistics to deliver crude to long haul pipelines Leverage Mesquite to provide long-term crude optionality for producers |
|
|
Focused on Building On Our Existing Platforms: Utica 69 Opportunities Utica condensate production forecasts are bullish, local market will absorb initially Natural gasoline and condensate will compete, spillover will leave Ohio Trucking, rail, and condensate logistics to start, pipeline to follow when volumes support Long term market for purity NGL’s is NOT the Appalachian market NGL export solutions will be required The US Gulf Coast is a logical target market Solutions Leverage existing rail, storage, trucking and barge assets to clear the liquids market Provide condensate stabilization services Become a receiver of Utica NGL export volumes by rail in south Louisiana Develop liquids gathering and processing solutions leveraging position in Ohio |
|
|
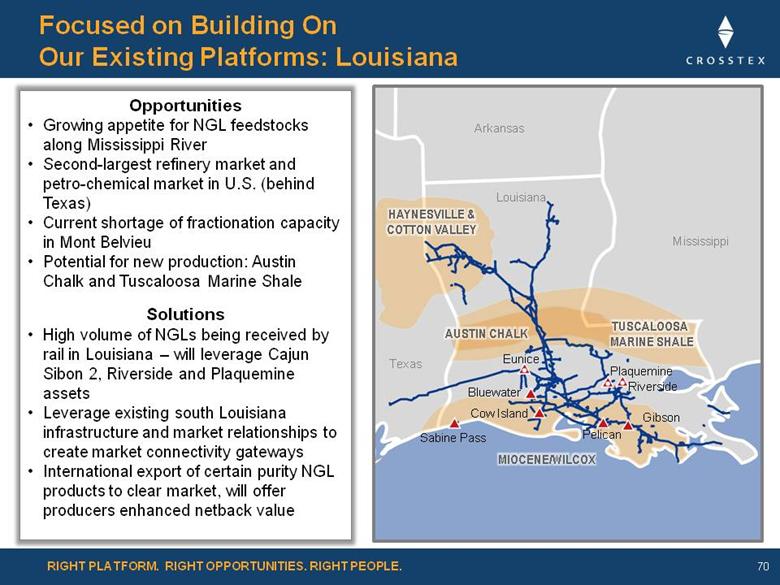
70 Louisiana Refineries Opportunities Growing appetite for NGL feedstocks along Mississippi River Second-largest refinery market and petro-chemical market in U.S. (behind Texas) Current shortage of fractionation capacity in Mont Belvieu Potential for new production: Austin Chalk and Tuscaloosa Marine Shale Solutions High volume of NGLs being received by rail in Louisiana – will leverage Cajun Sibon 2, Riverside and Plaquemine assets Leverage existing south Louisiana infrastructure and market relationships to create market connectivity gateways International export of certain purity NGL products to clear market, will offer producers enhanced netback value Pelican Riverside Plaquemine Eunice Bluewater Sabine Pass Gibson Cow Island Mississippi Louisiana Texas Arkansas Focused on Building On Our Existing Platforms: Louisiana |
|
|
Complementary Growth Projects Could Represent $1 Billion in Additional Capital Investments 71 Texas Potential Projects Potential Timing New Permian Processing Facility 2013 New cryogenic processing plant to accommodate additional volumes Permian Crude Gathering System 2014 Develop crude oil gathering and logistics solution to deliver crude into long-haul pipelines ORV Potential Projects New Condensate Solution 2014 Stabilizing solutions and logistics gateways to export spillover liquids, future pipeline New Processing Facilities 2014 Develop facilities to extend our operations into gathering and processing Louisiana Potential Projects Riverside Phase III 2014 Develop unit train facility with 30,000-50,000 Bbl/d of crude oil handling capability Cajun Sibon Phases III & IV 2015 Significant expansion of fractionation and storage capacity leveraging Cajun-Sibon II Propane and Butane Export Terminal 2015 Terminal to export LPG to South American or Far East markets Napoleonville Storage Expansion 2015 Potential to triple butane storage capacity for local refineries |
|
|
Financial Overview Mike Garberding Executive Vice President & Chief Financial Officer 72 |
|
|
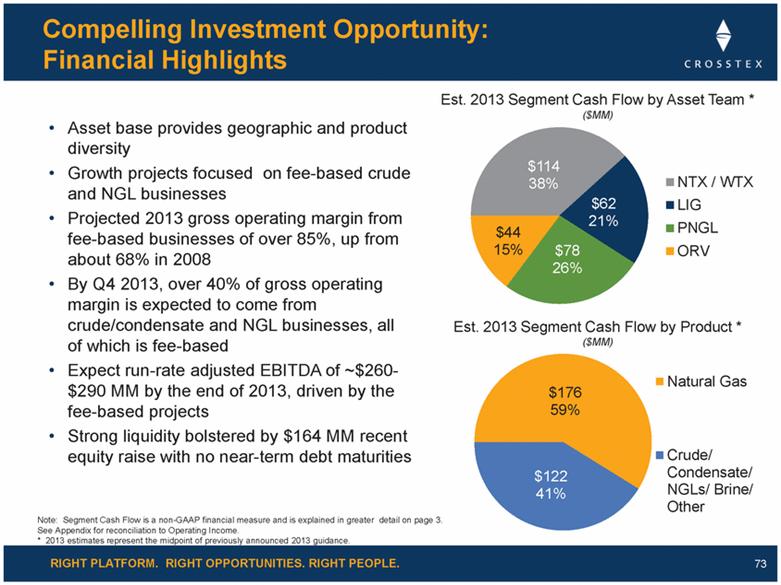
RIGHT PLATFORM. RIGHT OPPORTUNITIES. RIGHT PEOPLE. Compelling Investment Opportunity: Financial Highlights • Asset base provides geographic and product diversity • Growth projects focused on fee-based crude and NGL businesses • Projected 2013 gross operating margin from fee-based businesses of over 85%, up from about 68% in 2008 • By Q4 2013, over 40% of gross operating margin is expected to come from crude/condensate and NGL businesses, all of which is fee-based • Expect run-rate adjusted EBITDA of ~$260-$290 MM by the end of 2013, driven by the fee-based projects • Strong liquidity bolstered by $164 MM recent equity raise with no near-term debt maturities 73 Note: Segment Cash Flow is a non-GAAP financial measure and is explained in greater detail on page 3. See Appendix for reconciliation to Operating Income. * 2013 estimates represent the midpoint of previously announced 2013 guidance. $114 38% $62 21% $78 26% $44 15% NTX / WTX LIG PNGL ORV Est. 2013 Segment Cash Flow by Asset Team * ($MM) Est. 2013 Segment Cash Flow by Product * ($MM) $176 59% $122 41% Natural Gas Crude/ Condensate/ NGLs/ Brine/ Other |
|
|
~ 86% Fee-based business Successful Focus on Fee-Based Margin 74 2013 * 2012 estimates are preliminary, based on unaudited numbers and are subject to change. ** 2013 estimates represent the midpoint of previously announced 2013 guidance. |
|
|
* Adjusted EBITDA and Distributable cash flow are non-GAAP financial measures, and are explained in greater detail in “Non-GAAP Financial Information” on page 3. See Appendix for reconciliation to Net Loss. ** Adjusted EBITDA growth percentages represent 2013 estimates versus 2012 estimates that are preliminary, based on unaudited numbers and are subject to change. *** Distribution and dividend growth percentages represent annualized fourth-quarter 2013 estimates versus 2012 fourth-quarter announced distributions and dividends. 2013 Guidance 75 Low Midpoint High Crosstex Energy, L.P. Adjusted EBITDA* $220 $235 $250 Distributable Cash Flow (DCF) * $130 $144 $160 Distribution Per Unit $1.36 $1.41 $1.46 Distribution Coverage 1.0x 1.1x 1.2x Adjusted EBITDA Growth** 4% 11% 18% Distribution Growth*** 6% 15% 21% Growth Capital $465 $465 $465 Maintenance Capital $13 $13 $13 Crosstex Energy, Inc. Cash available for dividends $26 $28 $31 Dividend Per Share $0.53 $0.57 $0.63 Dividend Growth*** 17% 42% 75% Key Assumptions for Forecast Weighted Average Liquids Price ($/gal) 0.75 0.86 0.93 Brent Crude Price ($/Bbl) 95 108 117 Natural Gas Price ($/MMBtu) 4.50 4.10 3.50 Natural Gas Liquids to Gas Ratio 189% 238% 302% (Amounts in MM except for prices, percentages, ratios, per unit and per share amounts) |
|
|
Note: Growth capital expenditures, adjusted EBITDA, and distributable cash flow are non-GAAP financial measures and are explained in greater detail in “Non-GAAP Financial Information” on page 3. See Appendix for reconciliations to Net Loss * 2012 estimates are preliminary, based on unaudited numbers and are subject to change. ** 2013 estimates represent the midpoint of previously announced 2013 guidance. *** Q4 2013 estimated annualized guidance ranges shown. $260-$290 ($ in MM) Growth Trends: Growth Capital Expenditures, Adjusted EBITDA & DCF Capital expenditures in 2012 and 2013 drive adjusted EBITDA and DCF growth Q4 2013 annualized adjusted EBITDA expected to be $260-$290 MM Cajun-Sibon II expected annual run-rate adjusted EBITDA contribution of $75-$85 MM beginning in second half of 2014 76 Adjusted EBITDA $175-$205 ($ in MM) Distributable Cash Flow ($ in MM) Growth Capital Expenditures |
|
|
Growth Capex by Asset Team ($ in MM) Planned 2013 Capital Expenditures 77 Maintenance Capex by Asset Team ($ in MM) Note: Growth capital expenditures and maintenance capital expenditures are non-GAAP financial measures and are explained in greater detail on page 3. |
|
|
2013 2014 Annualized Impact Operating Income Opportunity Potential by Growth Project ($MM) Growth Projects Make Significant Impact 78 |
|
|
Strong Driving Distribution / Dividend Growth Expect defined large scale growth projects in 2013 and 2014 to drive distribution and dividend growth in 2014 and beyond 79 XTEX Distribution Growth Projection 4th Quarter Annualized Distribution (Dollars/Unit) 13.5% CAGR 28.6% CAGR XTXI Dividend Growth Projection 4th Quarter Annualized Distribution (Dollars/Share) |
|
|
Managing Commodity Risk: Hedging Strategy Key hedging principles: Only contracted volumes with high degree of certainty are considered hedgeable Production reliability and plant runtime are also considered As a result, hedgeable volume as a percentage of total volume at risk (VAR) is 73% for percent-of-liquids and 23% for processing margin Only utilize product-specific hedges in the forward liquids market No use of crude hedging instruments to manage our NGL exposure If commodity markets make hedging uneconomic (for example, when ethane is trading as a gas equivalent), our hedge position will remain below target levels 80 |
|
|
2013 Hedge Positions 81 2013 Hedged Volume as a % of Hedgeable Volume Q1 Q2 Q3 Q4 (Volumes in MM gallons) Percent-of-Liquids Total VAR Volumes 7.10 6.81 7.18 7.41 Total Hedgeable Volumes 5.25 4.98 5.22 5.39 Total Hedged Volumes 3.15 2.60 1.83 2.30 % of Hedgeable 60% 52% 35% 43% Processing Margin Total VAR Volumes 29.13 23.75 23.83 23.82 Total Hedgeable Volumes 5.80 5.74 5.58 5.58 Total Hedged Volumes 1.94 1.80 1.19 1.49 % of Hedgeable 33% 31% 21% 27% |
|
|
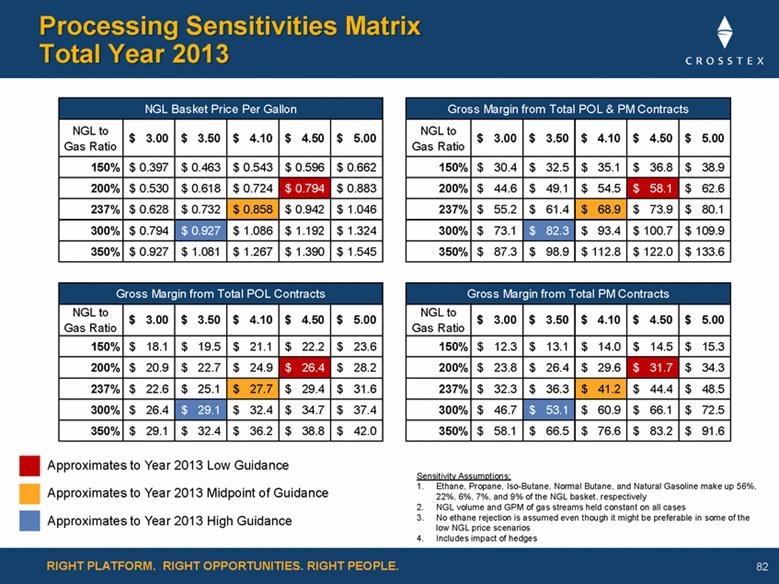
RIGHT PLATFORM. RIGHT OPPORTUNITIES. RIGHT PEOPLE. Processing Sensitivities Matrix Total Year 2013 Sensitivity Assumptions: 1. Ethane, Propane, Iso-Butane, Normal Butane, and Natural Gasoline make up 56% , 22% , 6% , 7% , and 9% of the NGL basket, respectively 2. NGL volume and GPM of gas streams held constant on all cases 3. No ethane rejection is assumed even though it might be preferable in some of the low NGL price scenarios 4. Includes impact of hedges NGL to Gas Ratio3.00 $ 3.50 $ 4.10 $ 4.50 $ 5.00 $ NGL to Gas Ratio3.00 $ 3.50 $ 4.10 $ 4.50 $ 5.00 $ 150% 0.397 $ 0.463 $ 0.543 $ 0.596 $ 0.662 $ 150% 30.4 $ 32.5 $ 35.1 $ 36.8 $ 38.9 $ 200% 0.530 $ 0.618 $ 0.724 $ 0.794 $ 0.883 $ 200% 44.6 $ 49.1 $ 54.5 $ 58.1 $ 62.6 $ 237% 0.628 $ 0.732 $ 0.858 $ 0.942 $ 1.046 $ 237% 55.2 $ 61.4 $ 68.9 $ 73.9 $ 80.1 $ 300% 0.794 $ 0.927 $ 1.086 $ 1.192 $ 1.324 $ 300% 73.1 $ 82.3 $ 93.4 $ 100.7 $ 109.9 $ 350% 0.927 $ 1.081 $ 1.267 $ 1.390 $ 1.545 $ 350% 87.3 $ 98.9 $ 112.8 $ 122.0 $ 133.6 $ NGL to Gas Ratio3.00 $ 3.50 $ 4.10 $ 4.50 $ 5.00 $ NGL to Gas Ratio3.00 $ 3.50 $ 4.10 $ 4.50 $ 5.00 $ 150% 18.1 $ 19.5 $ 21.1 $ 22.2 $ 23.6 $ 150% 12.3 $ 13.1 $ 14.0 $ 14.5 $ 15.3 $ 200% 20.9 $ 22.7 $ 24.9 $ 26.4 $ 28.2 $ 200% 23.8 $ 26.4 $ 29.6 $ 31.7 $ 34.3 $ 237% 22.6 $ 25.1 $ 27.7 $ 29.4 $ 31.6 $ 237% 32.3 $ 36.3 $ 41.2 $ 44.4 $ 48.5 $ 300% 26.4 $ 29.1 $ 32.4 $ 34.7 $ 37.4 $ 300% 46.7 $ 53.1 $ 60.9 $ 66.1 $ 72.5 $ 350% 29.1 $ 32.4 $ 36.2 $ 38.8 $ 42.0 $ 350% 58.1 $ 66.5 $ 76.6 $ 83.2 $ 91.6 $ NGL Basket Price Per GallonGross Margin from Total POL & PM ContractsGross Margin from Total POL ContractsGross Margin from Total PM Contracts Approximates to Year 2013 Low Guidance Approximates to Year 2013 Midpoint of Guidance Approximates to Year 2013 High Guidance 82 |
|
|
Closing Remarks Barry Davis President and Chief Executive Officer 83 |
|
|
Well Positioned for the Future Maximizing earnings and growth of our existing assets Enhancing scale and diversification Running our assets efficiently and managing our balance sheet conservatively Executing the growth projects that are underway, and pursuing new opportunities Expanding our NGL business and crude business to generate stable cash flows Developing gas processing and transportation projects in new rich-gas areas 84 We Believe We Have a Transformative Growth Opportunity Ahead |
|
|
Appendix 85 |
|
|
* 2012 estimates are preliminary, based on unaudited numbers and are subject to change. ** 2013 estimates represent the midpoint of previously announced 2013 guidance. *** Other includes LOC fees, stock based compensation and gains or losses on derivatives Reconciliation: Segment Cash Flow to Operating Income 86 |
|
|
* 2012 estimates are preliminary, based on unaudited numbers and are subject to change. ** 2013 estimates represent the midpoint of previously announced 2013 guidance. *** Other adjustments includes stock-based compensation, loss on extinguishment of debt, (gain) loss on noncash derivatives, transaction costs associated with successful transactions, minority interest and certain severance and exit expenses, and accrued expense of a legal judgment under appeal, less (gain) loss on sale of property Reconciliation: Net Loss to Adjusted EBITDA and Distributable Cash Flow 87 |
|
|
Analyst Conference January 23, 2013 |