Use these links to rapidly review the document
TABLE OF CONTENTS
INDEX TO FINANCIAL STATEMENTS
UNITED STATES
SECURITIES AND EXCHANGE COMMISSION
Washington, D.C. 20549
Form 10-K
ý |
ANNUAL REPORT PURSUANT TO SECTION 13 or 15(d) OF THE SECURITIES EXCHANGE ACT OF 1934 |
|
For the fiscal year ended December 31, 2011 |
||
OR |
||
o |
TRANSITION REPORT PURSUANT TO SECTION 13 OR 15(d) OF THE SECURITIES EXCHANGE ACT OF 1934 |
|
For the transition period from to |
||
Commission file number: 000-50067
CROSSTEX ENERGY, L.P.
(Exact name of registrant as specified in its charter)
| Delaware (State of organization) |
16-1616605 (I.R.S. Employer Identification No.) |
|
2501 CEDAR SPRINGS DALLAS, TEXAS (Address of principal executive offices) |
75201 (Zip Code) |
(Registrant's
telephone number, including area code)
(214) 953-9500
SECURITIES REGISTERED PURSUANT TO SECTION 12(b) OF THE ACT:
| Title of Each Class | Name of Exchange on which Registered | |
|---|---|---|
| Common Units Representing Limited | The NASDAQ Global Select Market | |
| Partnership Interests |
SECURITIES REGISTERED PURSUANT TO SECTION 12(g) OF THE ACT: None.
Indicate by check mark if registrant is a well-known seasoned issuer, as defined in Rule 405 of the Securities Act. Yes o No ý
Indicate by check mark if registrant is not required to file reports pursuant to Section 13 or Section 15(d) of the Act. Yes o No ý
Indicate by check mark whether registrant (1) has filed all reports required to be filed by Section 13 or 15(d) of the Securities Exchange Act of 1934 during the preceding 12 months (or for such shorter period that the registrant was required to file such reports), and (2) has been subject to such filing requirements for the past 90 days. Yes ý No o
Indicate by check mark whether the registrant has submitted electronically and posted on its corporate Web site, if any, every Interactive Data File required to be submitted and posted pursuant to Rule 405 of Regulation S-T (§ 232.405 of this chapter) during the preceding 12 months (or for such shorter period that the registrant was required to submit and post such files). Yes ý No o
Indicate by check mark if disclosure of delinquent filers pursuant to Item 405 of Regulation S-K (§229.405 of this chapter) is not contained herein, and will not be contained, to the best of registrant's knowledge, in definitive proxy or information statements incorporated by reference in Part III of this Form 10-K or any amendment to this Form 10-K. ý
Indicate by check mark whether the registrant is a large accelerated filer, an accelerated filer, a non-accelerated filer, or a smaller reporting company. See the definitions of "large accelerated filer," "accelerated filer" and "smaller reporting company" in Rule 12b-2 of the Securities Exchange Act. (Check one):
| Large accelerated filer o | Accelerated filer ý | Non-accelerated filer o (Do not check if a smaller reporting company) |
Smaller reporting company o |
Indicate by check mark whether the registrant is a shell company (as defined in Rule 12b-2 of the Act). Yes o No ý
The aggregate market value of the Common Units representing limited partner interests held by non-affiliates of the registrant was approximately $457,405,664 on June 30, 2011, based on $18.15 per unit, the closing price of the Common Units as reported on The NASDAQ Global Select Market on such date.
At February 14, 2012, there were 50,863,334 common units outstanding.
DOCUMENTS INCORPORATED BY REFERENCE:
None.
2
General
Crosstex Energy, L.P. is a publicly traded Delaware limited partnership formed in 2002. Our common units are traded on The NASDAQ Global Select Market under the symbol "XTEX". Our business activities are conducted through our subsidiary, Crosstex Energy Services, L.P., a Delaware limited partnership (the "Operating Partnership") and the subsidiaries of the Operating Partnership. Our executive offices are located at 2501 Cedar Springs, Dallas, Texas 75201, and our telephone number is (214) 953-9500. Our Internet address is www.crosstexenergy.com. We post the following filings in the "Investors" section of our website as soon as reasonably practicable after they are electronically filed with or furnished to the Securities and Exchange Commission: our annual report on Form 10-K; our quarterly reports on Form 10-Q; our current reports on Form 8-K; and any amendments to those reports or statements filed or furnished pursuant to Section 13(a) or 15(d) of the Securities Exchange Act of 1934, as amended. All such filings on our web-site are available free of charge. In this report, the terms "Partnership" and "Registrant," as well as the terms "our," "we," "us" and "its," are sometimes used as abbreviated references to Crosstex Energy, L.P. itself or Crosstex Energy, L.P. together with its consolidated subsidiaries, including the Operating Partnership.
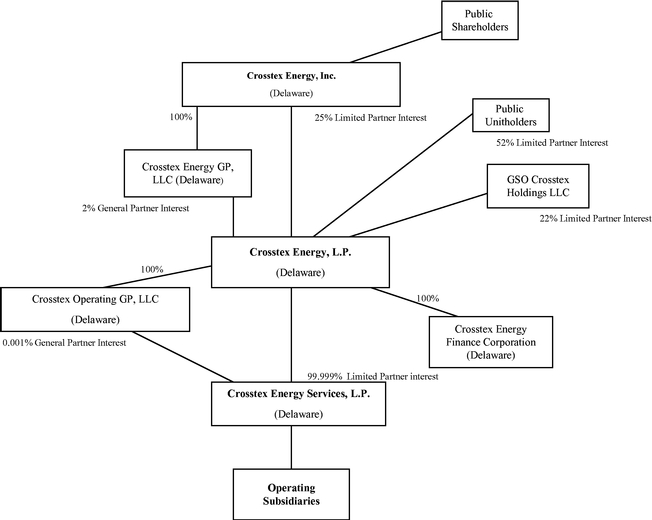
Crosstex Energy GP, LLC, a Delaware limited liability company, is our general partner. Crosstex Energy GP, LLC manages our operations and activities. Crosstex Energy GP, LLC is a wholly owned subsidiary of Crosstex Energy, Inc., or CEI. Crosstex Energy, Inc.'s shares are traded on The NASDAQ
3
Global Select Market under the symbol "XTXI." The following diagram depicts the organization and ownership of the Partnership as of December 31, 2011.
The following terms as defined generally are used in the energy industry and in this document:
/d =
per day
Bbls = barrels
Bcf = billion cubic feet
Btu = British thermal units
CO2= Carbon dioxide
Gal = gallon
Mcf = thousand cubic feet
MMBtu = million British thermal units
MMcf = million cubic feet
NGL = natural gas liquid and natural gas liquids
Capacity volumes for our facilities are measured based on physical volume and stated in cubic feet (Bcf, Mcf or MMcf). Throughput volumes are measured based on energy content and stated in British thermal units (Btu or MMBtu). A volume capacity of 100 MMcf generally correlates to volume capacity of 100,000 MMBtu. Fractionated volumes are measured based on physical volumes and stated in gallons (Gal).
4
Our Operations
Crosstex Energy, L.P. is an independent midstream energy company engaged in the gathering, transmission, processing and marketing of natural gas, natural gas liquids, or NGLs, and providing terminal services for crude oil. We connect the wells of natural gas producers in our market areas to our gathering systems, process natural gas for the removal of NGLs, fractionate NGLs into purity products and market those products for a fee, transport natural gas and ultimately provide natural gas to a variety of markets. We purchase natural gas from natural gas producers and other supply sources and sell that natural gas to utilities, industrial consumers, other marketers and pipelines. We operate processing plants that process gas transported to the plants by major interstate pipelines or from our own gathering systems under a variety of fee arrangements. In addition, we purchase natural gas from producers not connected to our gathering systems for resale and sell natural gas on behalf of producers for a fee.
We focus on the gathering, processing, transmission and marketing of natural gas and NGLs, which we manage as regional reporting segments. Our geographic focus is in the North Texas Barnett Shale (NTX) and in Louisiana, which has two reportable business segments (the Crosstex LIG system and the south Louisiana processing and NGL assets, or PNGL). Our combined midstream assets consist of over 3,300 miles of natural gas gathering and transmission and NGL pipelines, nine natural gas processing plants and three fractionators. Our gathering systems consist of a network of pipelines that collect natural gas from points near producing wells and transport it to larger pipelines for further transmission. Our transmission pipelines primarily receive natural gas from our gathering systems and from third party gathering and transmission systems and deliver natural gas to industrial end-users, utilities and other pipelines. Our processing plants remove NGLs and CO2 from a natural gas stream and our fractionators separate the NGLs into separate NGL products, including ethane, propane, iso-butane and normal butanes and natural gasoline. See Note 14 to the consolidated financial statements for financial information about these operating segments.
Our assets include the following:
Our Business Strategy
Our business strategy consists of three overarching objectives which are to maximize earnings and growth of our existing businesses, to enhance the scale and diversification of our assets and to continue our focus on operational excellence. We believe we were successful in executing our business strategy during 2011, and we will continue to pursue these objectives in 2012.
Maximize earnings and growth of existing businesses. We intend to leverage our franchise position, infrastructure and customer relationships by expanding existing systems to meet new or increased demand for our gathering, transmission, processing and marketing services. For example, we completed two expansion projects in north Texas in the Barnett Shale natural gas play. We added compression and
5
gathering lines at two separate locations increasing capacity by approximately 50 MMcf/d at an aggregate cost of approximately $44.2 million which generated gross operating margin of $17.0 million in 2011 as discussed more fully under "Recent Growth Developments" below.
Enhance scale and diversification of our assets. We look to grow and diversify by acquiring and/or building assets in new areas to serve as a platform for growth with a focus on emerging shale play areas with NGL and crude oil exposure. We expanded our asset scale and diversification during 2011 through our joint investment with Apache Corporation in the Permian Basin, through our equity investment in Howard Energy Partners in the Eagle Ford Shale play in south Texas and by adding crude oil terminals at our south Louisiana facilities. During 2011, we also began work on a project to expand our NGL pipeline system and our fractionation facilities in south Louisiana with construction commencing in 2012 and a planned completion date in mid 2013. These projects and the potential growth from these projects will help to provide additional scale and geographic diversity. All of these projects are discussed more fully under "Recent Growth Developments."
Continue to focus on operational excellence as we execute our business strategy. We have a continued focus on operating our existing asset base to maximize cost efficiencies, provide flexibility for our customers and provide reliable capacity for our customers, while maintaining a high level of safety, environmental integrity, innovation and customer service. We have developed tools to monitor pressures across our systems providing the opportunity to adjust operating modes. This improves reliability, reduces fuel consumption and enhances customer service. We continue to optimize our processing plant performance to improve ethane recovery. We are also in the top quartile of safety performance in the midstream industry due to our systematic focus on safety across the organization.
Recent Growth Developments
North Texas Expansion Projects. We expanded our natural gas gathering system in north Texas with the construction of a $28.3 million, 15-mile pipeline extension to serve major Barnett Shale producers. The project, which is supported by volumetric commitments, commenced operation in March 2011 and provides customers in southwest Tarrant County with greater takeaway capacity to accommodate their transportation requirements. This expansion contributed $9.5 million to our gross operating margin in 2011. Gross operating margin is a non-GAAP financial measure and is discussed under "Item 6. Selected Financial Data-Non-GAAP Financial Measures."
We also entered into a 10-year firm gathering and compression agreement with a major Barnett Shale producer for an additional 50 MMcf/d on our north Texas gathering system. In March 2011, we completed construction of a compressor station at a cost of $15.9 million that increased capacity on an existing gathering line for this additional volume. This expansion contributed $7.5 million to our gross operating margin in 2011.
Permian Basin Apache Joint Investment. We and Apache Corporation jointly have committed to invest $85.0 million in a new-build natural gas processing facility in the Permian Basin in Glasscock County, which we refer to as our Deadwood Plant. Crosstex and Apache have funded the processing project equally and each holds a 50 percent undivided working interest in the assets. We installed a refrigeration plant with a capacity of 20 MMcf per day, and we commenced operation of this facility in February 2012. A cryogenic gas processing facility with a capacity of 50 MMcf/day is under construction and is expected to be operational in June 2012. We are managing the construction of and will operate the processing facilities. The project gives us a footprint for growth in the Permian Basin where we will pursue additional business opportunities.
We also purchased and upgraded a nearby rail terminal and fractionator (which we renamed the Mesquite Terminal) in Midland County to serve initially as a rail terminal for the Deadwood Plant NGL and third party raw-make NGLs. These NGLs will be transported to our Eunice fractionation
6
facility in south central Louisiana for fractionation and sales. We own 100 percent of the terminal and fractionator. The Mesquite Terminal began receiving rawmake NGLs in February 2012 from the Deadwood Plant when we commenced its operation and from another producer via existing NGL pipelines or trucks. We have invested $12.7 million in this project. This facility will provide NGL takeaway for the constrained Permian infrastructure until a long-term pipeline solution becomes available.
Cajun-Sibon NGL expansion. The Cajun-Sibon NGL pipeline expansion will be an extension of our existing 440-mile Cajun-Sibon NGL pipeline that is connected to our fractionation facilities in south central Louisiana. The approximately 130-mile, 12-inch-diameter extension will have an initial capacity of 70,000 Bbls/d of NGLs. It will originate from interconnections to major Mont Belvieu supply pipelines and will provide connectivity for NGLs from the Permian Basin, Mid-Continent, Barnett Shale, Eagle Ford, and Rocky Mountain areas to our NGL fractionation facilities and end-user petrochemical customers in Louisiana. The project also includes the expansion of our Eunice NGL fractionation facilities from 15,000 Bbls/d to 55,000 Bbls/d, which will increase our interconnected fractionation capacity in Louisiana to approximately 97,000 Bbls/d.
We executed a long-term ethane sales agreement with Williams Olefins, a subsidiary of the Williams Companies, which provides us a secure market for ethane generated by our Eunice fractionation facility, the key product in the project. On the supply side, we have equity supply from our Texas gas plants and have received sufficient long-term supply commitments to proceed with the construction of this project. We are negotiating additional long-term commitments for the remaining capacity.
The Cajun-Sibon project expands our strategic footprint of our PNGL assets so we can take advantage of the increasing demand for fractionation and NGL handling as producers pursue the development of liquids-rich natural gas shale plays. The current estimated capital for this project is $230.0 million. We expect the facilities will be operational in the first half of 2013.
Partnership with Howard Energy Partners. In June 2011, we made a strategic equity investment in Howard Energy which provides us with an important growth platform in the rapidly developing Eagle Ford Shale play in south Texas, a new geographic area for us. Howard Energy owns midstream assets and provides midstream and construction services to Eagle Ford Shale producers.
Crosstex and Quanta Services, a leading pipeline construction contractor in the energy industry, each provided an initial capital contribution of $35.0 million for an ownership interest of about 35.0 percent each in Howard Energy. Howard Energy's management team has extensive midstream experience and, together with our experience in large scale and emerging shale developments and Quanta's construction experience, provide the depth and overall ability to develop and execute additional midstream projects in the Eagle Ford.
Crude Oil Terminals. We have modified the rail, truck, pipeline and barge facilities at our Eunice and Riverside fractionators to serve as crude oil terminals, thereby expanding the functionality of these facilities. They are ready to receive 5,000 to 6,000 Bbls/d of crude oil and condensate in aggregate and began receiving deliveries in January 2012 as part of phase one of the project. We are currently in discussions with several potential customers to contract additional crude oil volumes, and these terminal facilities could be expanded. The additional expansion at our Riverside plant could add 8,000 barrels of capacity by the second half of 2012.
These projects enable us to take advantage of the crude pricing differentials in today's market by providing quick access to the premium Louisiana market. Regional infrastructure bottlenecks have created differentials to the markets of Louisiana Gulf Coast crude, Louisiana Light Sweet, which benefits our physical asset position. We earn a volume based fee for providing this terminal service.
7
Our Assets
North Texas Assets. Our gathering systems in north Texas, or NTG, consist of approximately 670 miles of gathering lines that had an average throughput of approximately 773,000 MMBtu/d for the year ended December 31, 2011. Our processing facilities in north Texas include three gas processing plants with total processing throughput that averaged 249,000 MMBtu/d for the year ended December 31, 2011. Our transmission asset, referred to as the North Texas Pipeline, or NTP, consists of a 140-mile pipeline from an area near Fort Worth, Texas to a point near Paris, Texas and related facilities. The NTP connects production from the Barnett Shale to markets in north Texas and to markets accessed by the Natural Gas Pipeline Company, or NGPL, Kinder Morgan, Houston Pipeline, or HPL, Atmos and Gulf Crossing. For the year ended December 31, 2011, the average throughput on the NTP was approximately 352,000 MMBtu/d.
Crosstex LIG Assets. The Crosstex LIG gathering and transmission pipeline system is comprised of a north and south system and had an average throughput of approximately 912,000 MMbtu/d for the year ended December 31, 2011. Our LIG system in the south has a capacity in excess of 1.5 Bcf/d and over 1,000 miles of transmission and gathering lines. The system also includes two operating, on-system processing plants, our Plaquemine and Gibson plants, with an average throughput of 247,000 MMBtu/d for the year ended December 31, 2011. The Plaquemine plant also has a fractionation capacity of 10,800 Bbls/d of liquid products which we plan to connect to our south Louisiana NGL system in 2012. Total volume for fractionated liquids at Plaquemine averaged 2,800 Bbls/d for the year ended December 31, 2011. The south system has access to both rich and lean gas supplies from onshore production in south central and southeast Louisiana. Crosstex LIG has a variety of transportation and industrial sales customers in the south, with the majority of its sales being made into the industrial Mississippi River corridor between Baton Rouge and New Orleans.
Our Crosstex LIG system in the north, comprised of 63 miles of 24" mainline and 9 miles of gathering lateral pipeline, serves the natural gas fields south of Shreveport, Louisiana and extends into the Haynesville Shale gas play in north Louisiana. The north Louisiana system has a capacity of 485 MMcf/d and interconnects with interstate pipelines of ANR Pipeline, Columbia Gulf Transmission, Texas Gas Transmission, Trunkline Gas and Tennessee Gas Pipeline. We have firm transportation agreements for 440 MMcf/d on the north system with weighted average lives of approximately five years. Our north Louisiana system is connected to our south Louisiana system and has the capacity to move approximately 145 MMcf/d of gas to our markets in the south.
PNGL Assets. Our south Louisiana natural gas processing and liquids assets include processing and fractionation capabilities, underground storage and approximately 440 miles of liquids transport lines. Total processing throughput averaged 829,000 MMBtu/d for the year ended December 31, 2011.
8
9
Transco. The plant processed approximately 61,000 MMBtu/d for the year ended December 31, 2011. Offshore volumes supplying this plant have been declining during 2010 and 2011. We are looking for additional offshore supply for this plant. See Note 3(c) of the Notes to Consolidated Financial Statements for further discussion on the Sabine plant.
Industry Overview
The following diagram illustrates the gathering, processing, fractionation and transmission process.
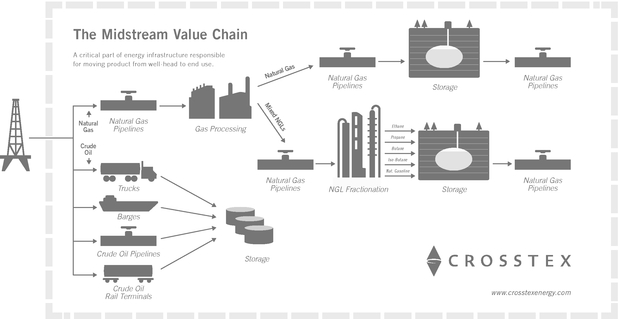
The midstream natural gas industry is the link between the exploration and production of natural gas and the delivery of its components to end-user markets. The midstream industry is generally characterized by regional competition based on the proximity of gathering systems and processing plants to natural gas producing wells.
Natural gas gathering. The natural gas gathering process follows the drilling of wells into gas-bearing rock formations. After a well has been completed, it is connected to a gathering system. Gathering systems typically consist of a network of small diameter pipelines and, if necessary, compression and treating systems that collect natural gas from points near producing wells and transport it to larger pipelines for further transmission.
Compression. Gathering systems are operated at pressures that will maximize the total natural gas throughput from all connected wells. Because wells produce gas at progressively lower field pressures as they age, it becomes increasingly difficult to deliver the remaining production in the ground against the higher pressure that exists in the connected gathering system. Natural gas compression is a mechanical
10
process in which a volume of gas at an existing pressure is compressed to a desired higher pressure, allowing gas that no longer naturally flows into a higher-pressure downstream pipeline to be brought to market. Field compression is typically used to allow a gathering system to operate at a lower pressure or provide sufficient discharge pressure to deliver gas into a higher-pressure downstream pipeline. The remaining natural gas in the ground will not be produced if field compression is not installed because the gas will be unable to overcome the higher gathering system pressure. In contrast, a declining well can continue delivering natural gas if the field compression is installed.
Natural gas processing. The principal components of natural gas are methane and ethane, but most natural gas also contains varying amounts of heavier NGLs and contaminants, such as water and CO2, sulfur compounds, nitrogen or helium. Natural gas produced by a well may not be suitable for long-haul pipeline transportation or commercial use and may need to be processed to remove the heavier hydrocarbon components and contaminants. Natural gas in commercial distribution systems mostly consists of methane and ethane, and moisture and other contaminants have been removed so there are negligible amounts of them in the gas stream. Natural gas is processed to remove unwanted contaminants that would interfere with pipeline transportation or use of the natural gas and to separate those hydrocarbon liquids from the gas that have higher value as NGLs. The removal and separation of individual hydrocarbons through processing is possible due to differences in weight, boiling point, vapor pressure and other physical characteristics. Natural gas processing involves the separation of natural gas into pipeline-quality natural gas and a mixed NGL stream and the removal of contaminants.
NGL fractionation. NGLs are separated into individual, more valuable components during the fractionation process. NGL fractionation facilities separate mixed NGL streams into discrete NGL products: ethane, propane, isobutane, normal butane, natural gasoline and stabilized condensate. Ethane is primarily used in the petrochemical industry as feedstock for ethylene, one of the basic building blocks for a wide range of plastics and other chemical products. Propane is used as a petrochemical feedstock in the production of ethylene and propylene and as a heating fuel, an engine fuel and industrial fuel. Isobutane is used principally to enhance the octane content of motor gasoline. Normal butane is used as a petrochemical feedstock in the production of ethylene and butylene (a key ingredient in synthetic rubber), as a blend stock for motor gasoline and to derive isobutene through isomerization. Natural gasoline, a mixture of pentanes and heavier hydrocarbons, is used primarily as motor gasoline blend stock or petrochemical feedstock.
Natural gas transmission. Natural gas transmission pipelines receive natural gas from mainline transmission pipelines, processing plants, and gathering systems and deliver it to industrial end-users, utilities and to other pipelines.
Crude oil terminals. Crude oil rail terminals are an integral part of ensuring the movement of new crude oil production from the developing shale plays in the United States and Canada. In general, the crude oil rail unloading terminals are used to unload rail cars, store crude oil volumes for 3rd parties until the oil is re-delivered to premium markets via pipelines, trucks or rail to delivery points.
Balancing Supply and Demand
When we purchase natural gas, we establish a margin normally by selling it for physical delivery to third-party users. We can also use over-the-counter derivative instruments or enter into future delivery obligations under futures contracts on the NYMEX. Through these transactions, we seek to maintain a position that is balanced between purchases, on the one hand, and sales or future delivery obligations, on the other hand. Our policy is not to acquire and hold natural gas futures contracts or derivative products for the purpose of speculating on price changes.
11
Competition
The business of providing gathering, transmission, processing and marketing services for natural gas and NGLs is highly competitive. We face strong competition in obtaining natural gas supplies and in the marketing and transportation of natural gas and NGLs. Our competitors include major integrated and independent E&P oil companies, natural gas producers, interstate and intrastate pipelines and other natural gas gatherers and processors. Competition for natural gas supplies is primarily based on geographic location of facilities in relation to production or markets, the reputation, efficiency and reliability of the gatherer and the pricing arrangements offered by the gatherer. Many of our competitors offer more services or have greater financial resources and access to larger natural gas supplies than we do. Our competition varies in different geographic areas.
In marketing natural gas and NGLs, we have numerous competitors, including marketing affiliates of interstate pipelines, major integrated oil and gas companies, and local and national natural gas producers, gatherers, brokers and marketers of widely varying sizes, financial resources and experience. Local utilities and distributors of natural gas are, in some cases, engaged directly, and through affiliates, in marketing activities that compete with our marketing operations.
We face strong competition for acquisitions and development of new projects from both established and start-up companies. Competition increases the cost to acquire existing facilities or businesses, and results in fewer commitments and lower returns for new pipelines or other development projects. Many of our competitors have greater financial resources or lower cost of capital, or are willing to accept lower returns or greater risks. Our competition differs by region and by the nature of the business or the project involved.
Natural Gas Supply
Our gathering and transmission pipelines have connections with major intrastate and interstate pipelines, which we believe have ample natural gas supplies in excess of the volumes required for the operation of these systems. We evaluate well and reservoir data that is either publicly available or furnished by producers or other service providers in connection with the construction and acquisition of our gathering systems to determine the availability of natural gas supply for the systems and/or obtain a minimum volume commitment from the producer that results in a rate of return on investment. Based on these facts, we believe that there should be adequate natural gas supply to recoup our investment with an adequate rate of return. We do not routinely obtain independent evaluations of reserves dedicated to our systems due to the cost and relatively limited benefit of such evaluations. Accordingly, we do not have estimates of total reserves dedicated to our systems or the anticipated life of such producing reserves.
Credit Risk and Significant Customers
We are diligent in attempting to ensure that we issue credit to only credit-worthy customers. However, our purchase and resale of gas exposes us to significant credit risk, as the margin on any sale is generally a very small percentage of the total sale price. Therefore, a credit loss can be very large relative to our overall profitability.
During the year ended December 31, 2011, we had only one customer, Dow Hydrocarbons & Resources LLC, that represented greater than 10.0% of our revenue. While this customer represented 12.3% of consolidated revenues, the loss of this customer would not have a material impact on our results of operations because the gross operating margins received from transactions with this customer are not material to our total gross operating margin, and we believe the sales to this customer could be replaced with other buyers at comparable sales prices.
12
Regulation
Regulation by FERC of Interstate Natural Gas Pipelines. We do not own any interstate natural gas pipelines, so the Federal Energy Regulatory Commission, or FERC, does not directly regulate our operations under the National Gas Act, or NGA. However, FERC's regulation of interstate natural gas pipelines influences certain aspects of our business and the market for our products. In general, FERC has authority over natural gas companies that provide natural gas pipeline transportation services in interstate commerce and its authority to regulate those services includes:
While we do not own any interstate pipelines, we do transport gas in interstate commerce. The rates, terms and conditions of service under which we transport natural gas in our pipeline systems in interstate commerce are subject to FERC jurisdiction under Section 311 of the Natural Gas Policy Act, or NGPA. In addition, FERC has adopted, or is in the process of adopting, various regulations concerning natural gas market transparency that will apply to some of our pipeline operations. The maximum rates for services provided under Section 311 of the NGPA may not exceed a "fair and equitable rate," as defined in the NGPA. The rates are generally subject to review every three years by FERC or by an appropriate state agency. The inability to obtain approval of rates at acceptable levels could result in refund obligations, the inability to achieve adequate returns on investments in new facilities and the deterrence of future investment or growth of the regulated facilities.
Regulation by FERC of Interstate NGL Pipelines. As of December 31, 2011, we did not own any interstate NGL pipelines. However, as discussed in "Recent Growth Developments," we intend to begin construction in 2012 of an expansion of the Cajun-Sibon NGL pipeline that is connected to our fractionation facilities in south central Louisiana. This expansion is scheduled to be operational in the first half of 2013. Once operational, the expansion will be subject to regulation by FERC as a common carrier under the Interstate Commerce Act, the Energy Policy Act of 1992 and related rules and orders. FERC regulation requires that interstate oil pipeline rates, including rates for transportation of NGLs, be filed with FERC and that these rates be "just and reasonable" and not unduly discriminatory.
Rates of interstate NGL pipelines are currently regulated by FERC primarily through an annual indexing methodology, under which pipelines increase or decrease their rates in accordance with an index adjustment specified by FERC. For the five-year period beginning in 2010, FERC established an annual index adjustment equal to the change in the producer price index for finished goods plus 2.65%. This adjustment is subject to review every five years. Under FERC's regulations, an NGL pipeline can request a rate increase that exceeds the rate obtained through application of the indexing methodology by using a cost-of-service approach, but only after the pipeline establishes that a substantial divergence exists between the actual costs experienced by the pipeline and the rates resulting from application of the indexing methodology.
The Interstate Commerce Act permits interested persons to challenge proposed new or changed rates and authorizes FERC to suspend the effectiveness of such rates for up to seven months and investigate such rates. If, upon completion of an investigation, FERC finds that the new or changed rate is unlawful, it is authorized to require the pipeline to refund revenues collected in excess of the just and reasonable rate during the term of the investigation. The just and reasonable rate used to calculate refunds cannot be lower than the last tariff rate approved as just and reasonable. FERC may
13
also investigate, upon complaint or on its own motion, rates that are already in effect and may order a carrier to change its rates prospectively. Upon an appropriate showing, a shipper may obtain reparations for charges in excess of a just and reasonable rate for a period of up to two years prior to the filing of a complaint.
Intrastate Pipeline Regulation. Our intrastate natural gas pipeline operations are subject to regulation by various agencies of the states in which they are located. Most states have agencies that possess the authority to review and authorize natural gas transportation transactions and the construction, acquisition, abandonment and interconnection of physical facilities. Some states also have state agencies that regulate transportation rates, service terms and conditions and contract pricing to ensure their reasonableness and to ensure that the intrastate pipeline companies that they regulate do not discriminate among similarly situated customers.
Gathering Pipeline Regulation. Section 1(b) of the NGA exempts natural gas gathering facilities from the jurisdiction of FERC under the NGA. We own a number of natural gas pipelines that we believe meet the traditional tests FERC has used to establish a pipeline's status as a gatherer not subject to FERC jurisdiction. State regulation of gathering facilities generally includes various safety, environmental and, in some circumstances, nondiscriminatory take requirements, and in some instances complaint-based rate regulation.
We are subject to some state ratable take and common purchaser statutes. The ratable take statutes generally require gatherers to take, without undue discrimination, natural gas production that may be tendered to the gatherer for handling. Similarly, common purchaser statutes generally require gatherers to purchase without undue discrimination as to source of supply or producer. These statutes are designed to prohibit discrimination in favor of one producer over another producer or one source of supply over another source of supply.
Sales of Natural Gas. The price at which we sell natural gas currently is not subject to federal regulation and, for the most part, is not subject to state regulation. Our natural gas sales are affected by the availability, terms and cost of pipeline transportation. As noted above, the price and terms of access to pipeline transportation are subject to extensive federal and state regulation. FERC is continually proposing and implementing new rules and regulations affecting those segments of the natural gas industry, most notably interstate natural gas transmission companies that remain subject to FERC's jurisdiction. These initiatives also may affect the intrastate transportation of natural gas under certain circumstances. We cannot predict the ultimate impact of these regulatory changes on our natural gas marketing operations, but we do not believe that we will be affected by any such FERC action in a manner that is materially different from the natural gas marketers with whom we compete.
Environmental Matters
General. Our operation of processing and fractionation plants, pipelines and associated facilities in connection with the gathering and processing natural gas and the transportation, fractionation and storage of NGLs is subject to stringent and complex federal, state and local laws and regulations relating to release of hazardous substances or wastes into the environment or otherwise relating to protection of the environment. As with the industry generally, compliance with existing and anticipated environmental laws and regulations increases our overall costs of doing business, including costs of planning, constructing, and operating plants, pipelines, and other facilities. Included in our construction and operation costs are capital cost items necessary to maintain or upgrade equipment and facilities. Similar costs are likely upon changes in laws or regulations and upon any future acquisition of operating assets.
Any failure to comply with applicable environmental laws and regulations, including those relating to equipment failures and obtaining required governmental approvals, may result in the assessment of administrative, civil or criminal penalties, imposition of investigatory or remedial activities and, in less
14
common circumstances, issuance of injunctions or construction bans or delays. We believe that we currently hold all material governmental approvals required to operate our major facilities. As part of the regular evaluation of our operations, we routinely review and update governmental approvals as necessary. We believe that our operations and facilities are in substantial compliance with applicable environmental laws and regulations and that the cost of compliance with such laws and regulations currently in effect will not have a material adverse effect on our operating results or financial condition.
The clear trend in environmental regulation is to place more restrictions and limitations on activities that may affect the environment, and thus there can be no assurance as to the amount or timing of future expenditures for environmental compliance or remediation, and actual future expenditures may be different from the amounts we currently anticipate. Moreover, risks of process upsets, accidental releases or spills are associated with our possible future operations, and we cannot assure you that we will not incur significant costs and liabilities, including those relating to claims for damage to property and persons as a result of any such upsets, releases, or spills. In the event of future increases in environmental costs, we may be unable to pass on those cost increases to our customers. A discharge of hazardous substances or wastes into the environment could, to the extent losses related to the event are not insured, subject us to substantial expense, including both the cost to comply with applicable laws and regulations and to pay fines or penalties that may be assessed and the cost related to claims made by neighboring landowners and other third parties for personal injury or damage to natural resources or property. We will attempt to anticipate future regulatory requirements that might be imposed and plan accordingly to comply with changing environmental laws and regulations and to minimize costs with respect to more stringent future laws and regulations or more rigorous enforcement of existing laws and regulations.
Hazardous Substances and Waste. To a large extent, the environmental laws and regulations affecting our operations relate to the release of hazardous substances or solid wastes into soils, groundwater and surface water, and include measures to prevent and control pollution. These laws and regulations generally regulate the generation, storage, treatment, transportation and disposal of solid and hazardous wastes, and may require investigatory and corrective actions at facilities where such waste may have been released or disposed. For instance, the Comprehensive Environmental Response, Compensation and Liability Act, or CERCLA, also known as the "Superfund" law, and comparable state laws, impose liability without regard to fault or the legality of the original conduct, on certain classes of persons that contributed to a release of "hazardous substance" into the environment. Potentially liable persons include the owner or operator of the site where a release occurred and companies that disposed or arranged for the disposal of the hazardous substances found at the site. Under CERCLA, these persons may be subject to joint and several liability for the costs of cleaning up the hazardous substances that have been released into the environment, for damages to natural resources, and for the costs of certain health studies. CERCLA also authorizes the EPA and, in some cases, third parties to take actions in response to threats to the public health or the environment and to seek to recover from the potentially responsible classes of persons the costs they incur. It is not uncommon for neighboring landowners and other third parties to file claims for personal injury and property damage allegedly caused by hazardous substances or other wastes released into the environment. Although "petroleum" as well as natural gas and NGLs are excluded from CERCLA's definition of a "hazardous substance," in the course of ordinary operations, we may generate wastes that may fall within the definition of a "hazardous substance." In addition, there are other laws and regulations that can create liability for releases of petroleum, natural gas or NGLs. Moreover, we may be responsible under CERCLA or other laws for all or part of the costs required to clean up sites at which such wastes have been disposed. We have not received any notification that we may be potentially responsible for cleanup costs under CERCLA or any analogous federal or state laws.
We also generate, and may in the future generate, both hazardous and nonhazardous solid wastes that are subject to requirements of the federal Resource Conservation and Recovery Act, or RCRA,
15
and/or comparable state statutes. From time to time, the Environmental Protection Agency, or EPA, and state regulatory agencies have considered the adoption of stricter disposal standards for nonhazardous wastes, including crude oil and natural gas wastes. Moreover, it is possible that some wastes generated by us that are currently considered as nonhazardous may in the future be designated as "hazardous wastes," resulting in the wastes being subject to more rigorous and costly management and disposal requirements. Changes in applicable laws or regulations may result in an increase in our capital expenditures or plant operating expenses or otherwise impose limits or restrictions on our production and operations.
We currently own or lease, and have in the past owned or leased, and in the future we may own or lease, properties that have been used over the years for natural gas gathering, treating or processing and for NGL fractionation, transportation or storage. Solid waste disposal practices within the NGL industry and other oil and natural gas related industries have improved over the years with the passage and implementation of various environmental laws and regulations. Nevertheless, some hydrocarbons and other solid wastes have been disposed of on or under various properties owned or leased by us during the operating history of those facilities. In addition, a number of these properties may have been operated by third parties over whom we had no control as to such entities' handling of hydrocarbons or other wastes and the manner in which such substances may have been disposed of or released. These properties and wastes disposed thereon may be subject to CERCLA, RCRA, and analogous state laws. Under these laws, we could be required to remove or remediate previously disposed wastes or property contamination if present, including groundwater contamination, or to take action to prevent future contamination.
Air Emissions. Our current and future operations are subject to the federal Clean Air Act and comparable state laws and regulations. These laws and regulations regulate emissions of air pollutants from various industrial sources, including our facilities, and impose various controls together with monitoring and reporting requirements. Pursuant to these laws and regulations, we may be required to obtain environmental agency pre-approval for the construction or modification of certain projects or facilities expected to produce air emissions or result in an increase in existing air emissions, obtain and comply with the terms of air permits, which include various emission and operational limitations, or use specific emission control technologies to limit emissions. We likely will be required to incur certain capital expenditures in the future for air pollution control equipment in connection with maintaining or obtaining governmental approvals addressing air-emission related issues. Failure to comply with applicable air statutes or regulations may lead to the assessment of administrative, civil or criminal penalties, and may result in the limitation or cessation of construction or operation of certain air emission sources. Although we can give no assurances, we believe such requirements will not have a material adverse effect on our financial condition or operating results, and the requirements are not expected to be more burdensome to us than any similarly situated company.
Air emissions associated with operations in the Barnett Shale area have come under recent scrutiny. In 2010 and 2011, the Texas Commission on Environmental Quality (TCEQ) conducted comprehensive monitoring of air emissions in the Barnett Shale area, in response to public concerns about high concentrations of benzene and other potential emissions in the air near drilling sites and natural gas processing facilities. In addition, environmental groups have advocated increased regulation in the Barnett Shale area and these groups as well as at least one state representative further advocated a moratorium on permits for new gas wells until TCEQ completes its analysis. Also, the EPA entered into a settlement in 2010 that required it to reevaluate regulations for the control of air emissions from the oil and natural gas industry. As a result, the EPA proposed regulations in July 2011, which are currently pending adoption, that would establish new air pollution standards for the oil and natural gas industry, including new source performance standards for volatile organic compounds and sulfur dioxide and an air toxics standard for oil and natural gas production and for natural gas transmission and storage. Changes in laws or regulations imposing emission limitations, pollution
16
control technology requirements or other regulatory requirements or any restriction on permitting of natural gas production facilities in the Barnett Shale area could have an adverse effect on our business.
Climate Change. In response to concerns suggesting that emissions of certain gases, commonly referred to as "greenhouse gases" (including carbon dioxide and methane), may be contributing to warming of the earth's atmosphere, EPA is taking steps that would result in the regulation of greenhouse gases as pollutants under the federal Clean Air Act.
In October 2009, EPA promulgated its Mandatory Reporting Rule for greenhouse gases, which requires the monitoring and reporting of greenhouse gas emissions on an annual basis. All of our facilities operating combustion sources, such as engines, or natural gas fractionation facilities are subject to the greenhouse gas reporting requirements included in the October 2009 final rule. The first annual greenhouse gas emissions inventory for Crosstex affected facilities was filed by Crosstex in September 2011. In November 2010 and further in December 2011, EPA expanded the scope of the Mandatory Reporting Rule to include petroleum and natural gas pipeline systems, which applies the Mandatory Reporting Rule's requirements to, among other sources, fugitive and vented methane emissions from the oil and gas sector, including natural gas transmission compression. Our transmission compression facilities as well as gathering compressor stations with large amine treating capacities are now required to report under this expanded rule, with the first report due to the EPA on September 28, 2012. Although the Mandatory Reporting Rule does not control greenhouse gas emission levels from any facilities, it has still caused us to incur monitoring and reporting costs for emissions that are subject to the rule. Further, the rule's new requirements for reporting of fugitive and vented methane emissions from the oil and gas industry can be expected to increase our monitoring and reporting costs from here on forward.
After a series of regulatory actions finalized by EPA between December 2009 and May 2010, greenhouse gases became pollutants "subject to regulation" under the Clean Air Act's Prevention of Significant Deterioration (PSD) air quality permit program for stationary sources, and the largest of these sources have also become subject to permitting requirements under the Clean Air Act's Title V permitting program. As a result, new major stationary sources of greenhouse gas emissions, and modifications of existing major stationary sources that significantly increase their greenhouse gas emissions will require a permit setting forth Best Available Control Technology (BACT) for those emissions. EPA has, through its "Tailoring Rule," acted to limit these permitting requirements to only the largest sources of greenhouse gas emissions initially, but these new requirements could in the future affect our operations and our ability to obtain air permits for new or modified facilities.
The U.S. Congress has also considered legislation to mandate reductions of greenhouse gas emissions, and almost half of the states, either individually or through multi-state regional initiatives, have already taken legal measures intended to reduce greenhouse gas emissions, primarily through the planned development of greenhouse gas emission inventories and/or greenhouse gas cap and trade programs.
Because regulation of Green House Gas ("GHG") emissions is relatively new, further regulatory, legislative and judicial developments are likely to occur. Such developments may affect how these GHG initiatives will impact us. In addition to these regulatory developments, recent judicial decisions have allowed certain tort claims alleging property damage to proceed against GHG emissions sources may increase our litigation risk for such claims. Due to the uncertainties surrounding the regulation of and other risks associated with GHG emissions, we cannot predict the financial impact of related developments on us.
Federal or state legislative or regulatory initiatives that regulate or restrict emissions of greenhouse gases in areas in which we conduct business could adversely affect the demand for the products we store, transport, and process, and depending on the particular program adopted could increase the costs of our operations, including costs to operate and maintain our facilities, install new emission controls on our facilities, acquire allowances to authorize our greenhouse gas emissions, pay any taxes
17
related to our greenhouse gas emissions and/or administer and manage a greenhouse gas emissions program. We may be unable to recover any such lost revenues or increased costs in the rates we charge our customers, and any such recovery may depend on events beyond our control, including the outcome of future rate proceedings before the FERC or state regulatory agencies and the provisions of any final legislation or regulations. Reductions in our revenues or increases in our expenses as a result of climate control initiatives could have adverse effects on our business, financial position, results of operations and prospects.
Certain scientific studies on climate change suggest that stronger storms may occur in the future in certain of the areas in which we operate, although the scientific studies are not unanimous. Due to their location, our operations along the Gulf Coast are vulnerable to operational and structural damages resulting from hurricanes and other severe weather systems and our insurance may not cover all associated losses. We are taking steps to mitigate physical risks from storms, but no assurance can be given that future storms will not have a material adverse effect on our business.
Clean Water Act. The Federal Water Pollution Control Act, also known as the Clean Water Act, and comparable state laws impose restrictions and strict controls regarding the discharge of pollutants, including natural gas liquid related wastes, into state waters or waters of the United States. Regulations promulgated pursuant to these laws require that entities that discharge into federal and state waters obtain National Pollutant Discharge Elimination System, or NPDES, and/or state permits authorizing these discharges. The Clean Water Act and analogous state laws assess administrative, civil and criminal penalties for discharges of unauthorized pollutants into the water and impose substantial liability for the costs of removing spills from such waters. In addition, the Clean Water Act and analogous state laws require that individual permits or coverage under general permits be obtained by covered facilities for discharges of storm water runoff. We believe that we are in substantial compliance with Clean Water Act permitting requirements as well as the conditions imposed thereunder, and that continued compliance with such existing permit conditions will not have a material effect on our results of operations.
It is customary to recover natural gas from deep shale formations through the use of hydraulic fracturing, combined with sophisticated horizontal drilling. Hydraulic fracturing is an important and commonly used process in the completion of wells by our customers. Hydraulic fracturing involves the injection of water, sand and chemical additives under pressure into rock formations to stimulate gas production. Due to public concerns raised regarding potential impacts of hydraulic fracturing on groundwater quality, legislative and regulatory efforts at the federal level and in some states have been initiated to require or make more stringent the permitting and other regulatory requirements for hydraulic fracturing operations. At the federal level, the U.S. Congress has introduced legislation that would amend the federal Safe Drinking Water Act to subject hydraulic fracturing operations to regulation under that Act and to require the disclosure of chemicals used by the oil and gas industry in the hydraulic fracturing process. As support for the chemical disclosure requirements included in the legislation, sponsors of the legislation asserted that chemicals used in the fracturing process could adversely affect drinking water supplies. Disclosure of chemicals used in the fracturing process could make it easier for third parties opposing hydraulic fracturing to initiate legal proceedings against producers and service providers based on allegations that specific chemicals used in the fracturing process could adversely affect groundwater. If adopted, this or other similar legislation could establish an additional level of regulation and permitting of hydraulic fracturing operations at the federal level, which could lead to operational delays, increased operating costs and additional regulatory burdens that could make it more difficult for our customers to perform hydraulic fracturing. In addition, during the first quarter of 2010, the EPA initiated a detailed scientific study of hydraulic fracturing and its potential impacts on surface and ground waters. The initial study results are expected to be available in late 2012. In early 2010, EPA also indicated in a website posting that it intended to regulate hydraulic fracturing under the Safe Drinking Water Act and require permitting for any well where hydraulic fracturing was conducted with the use of diesel as an additive. While industry groups have challenged
18
EPA's website posting as improper rulemaking, the Agency's position, if upheld could require additional permitting and could lead to operations delays, increased costs and regulatory burdens that could make it more difficult for our customers to perform hydraulic fracturing. State and local governments have also considered proposed regulations addressing public concerns related to hydraulic fracturing operations. Some state and local governments in regions where shale development is underway have considered or imposed moratoriums on drilling operations using hydraulic fracturing until further study of the potential environmental and human health impacts by EPA or the relative state agencies are completed. Any increased federal, state or local regulation could reduce the volumes of natural gas that our customers move through our gathering systems which would materially adversely affect our revenues and results of operations.
Employee Safety. We are subject to the requirements of the Occupational Safety and Health Act, referred to as OSHA, and comparable state laws that regulate the protection of the health and safety of workers. In addition, the OSHA hazard communication standard requires that information be maintained about hazardous materials used or produced in operations and that this information be provided to employees, state and local government authorities and citizens. We believe that our operations are in substantial compliance with the OSHA requirements, including general industry standards, record keeping requirements, and monitoring of occupational exposure to regulated substances.
DOT Safety Regulations. Our pipelines are subject to regulation by the U.S. Department of Transportation (DOT). DOT's Pipeline Hazardous Material Safety Administration (PHMSA), acting through the Office of Pipeline Safety (OPS), administers the national regulatory program to assure the safe transportation of natural gas, petroleum, and other hazardous materials by pipeline. OPS develops regulations and other approaches to risk management to assure safety in design, construction, testing, operation, maintenance, and emergency response of pipeline facilities. These safety regulations are listed under 49 CFR, Parts 192 and 195. Pipelines that transport natural gas are governed under 49 CFR 192. Pipelines that transport crude oil, carbon dioxide, NGL and petroleum products are governed under 49 CFR 195. PHMSA requires any entity which owns or operates pipeline facilities to comply with the regulations under these and referenced regulations, regarding access to and allow copying of records, and to make certain reports and provide information as required by the Secretary of Transportation. The Pipeline Integrity Management in High Consequence Areas, amendments to 49 CFR Part 192 and 195 (PIM) requires operators of transmission pipelines to ensure the integrity of their pipelines through hydrostatic pressure testing, the use of in-line inspection tools or through risk-based direct assessment techniques. On December 13, 2011, the Senate passed, and on January 3, 2012, the President signed into law, H.R. 2845, "Pipeline Safety, Regulatory Certainty, and Job Creation Act of 2011," which increases potential penalties for pipeline safety violations, gives new rulemaking authority to the DOT with respect to shut-off valves on transmission pipeline facilities constructed or entirely replaced after the rule is promulgated, requires DOT to revise incident notification guidance, and imposes new records requirements on pipeline owners and operators. The new legislation also requires the DOT to study and report to Congress on other areas of pipeline safety, including expanding the reach of the integrity management regulations beyond high consequences areas, but restricts DOT from promulgating expanded integrity management rules during the review period and for a period following submittal of its report to Congress unless the rulemaking is needed to address a present condition that poses a risk to public safety, property, or the environment. In addition to federal regulations, the Railroad Commission of Texas, or TRRC, regulates our pipelines in Texas under its own pipeline safety regulations, including integrity management rules. We believe that our pipeline operations are in substantial compliance with applicable PHMSA and TRRC requirements; however, due to the possibility of new or amended laws and regulations or reinterpretation of existing laws and regulations, there can be no assurance that future compliance with the PHMSA or TRRC requirements will not have a material adverse effect on our results of operations or financial positions.
19
Office Facilities
We occupy approximately 95,400 square feet of space at our executive offices in Dallas, Texas under a lease expiring in June 2014, and approximately 25,100 square feet of office space for our Louisiana operations in Houston, Texas with lease terms expiring in April 2023. We have approximately 17,000 square feet of office space in Fort Worth, Texas with lease terms expiring in April 2013 and currently have this space sub-leased to other tenants.
Employees
As of December 31, 2011, we (through our subsidiaries) employed approximately 494 full-time employees. Approximately 179 of our employees were general and administrative, engineering, accounting and commercial personnel and the remainder were operational employees. We are not party to any collective bargaining agreements, and we have not had any significant labor disputes in the past. We believe that we have good relations with our employees.
The following risk factors and all other information contained in this report should be considered carefully when evaluating us. These risk factors could affect our actual results. Other risks and uncertainties, in addition to those that are described below, may also impair our business operations. If any of the following risks occur, our business, financial condition or results of operations could be affected materially and adversely. In that case, we may be unable to make distributions to our unitholders and the trading price of our common unit could decline. These risk factors should be read in conjunction with the other detailed information concerning us set forth in our accompanying financial statements and notes and contained in "Item 7. Management's Discussion and Analysis of Financial Condition and Results of Operations" included herein.
Risks Inherent In Our Business
Our profitability is dependent upon prices and market demand for natural gas and NGLs, which are beyond our control and have been volatile.
We are subject to significant risks due to fluctuations in commodity prices. We are directly exposed to these risks primarily in the gas processing component of our business. For the year ended December 31, 2011 approximately 10.7% of our total gross operating margin was generated under percent of liquids (POL) contracts. Under these contracts we receive a fee in the form of a percentage of the liquids recovered and the producer bears all the cost of the natural gas shrink. Accordingly, our revenues under these contracts are directly impacted by the market price of NGLs.
We also realize processing gross operating margins under processing margin (margin) contracts. For the year ended December 31, 2011 approximately 19.3% of our total gross operating margin was generated under processing margin contracts. We have a number of processing margin contracts with our Plaquemine, Gibson, Eunice, Bluewater, and Pelican processing plants. Under this type of contract, we pay the producer for the full amount of inlet gas to the plant, and we make a margin based on the difference between the value of liquids recovered from the processed natural gas as compared to the value of the natural gas volumes lost ("shrink") and the cost of fuel used in processing. The shrink and fuel losses are referred to as plant thermal reduction or PTR. Our margins from these contracts can be greatly reduced or eliminated during periods of high natural gas prices relative to liquids prices.
We are also indirectly exposed to commodity prices due to the negative impacts on production and the development of production of natural gas and NGLs connected to or near our assets and on our margins for transportation between certain market centers. Low prices for these products will reduce the demand for our services and volumes on our systems.
20
In the past, the prices of natural gas and NGLs have been extremely volatile and we expect this volatility to continue. For example, prices of natural gas in 2011 were below the market price realized throughout most of 2010 while prices for oil and NGLs were higher than 2010 market prices. Crude oil prices (based on the New York Mercantile Exchange (the "NYMEX") futures daily close prices for the prompt month) in 2011 ranged from a low of $75.67 per Bbl in October 2011 to a high of $113.93 per Bbl in April 2011. Weighted average NGL prices in 2011 (based on the Oil Price Information Service (OPIS) Napoleonville daily average spot liquids prices) ranged from a low of $0.99 per gallon in February 2011 to a high of $1.35 per gallon in May 2011. Natural gas prices (based on Gas Daily Henry Hub closing prices) during 2011 ranged from a high of $4.92 per MMBtu in June 2011 to a low of $2.79 per MMBtu in November 2011.
The markets and prices for natural gas and NGLs depend upon factors beyond our control. These factors include the supply and demand for oil, natural gas and NGLs, which fluctuate with changes in market and economic conditions and other factors, including:
Changes in commodity prices may also indirectly impact our profitability by influencing drilling activity and well operations, and thus the volume of gas we gather and process. The volatility in commodity prices may cause our gross operating margin and cash flows to vary widely from period to period. Our hedging strategies may not be sufficient to offset price volatility risk and, in any event, do not cover all of our throughput volumes. Moreover, hedges are subject to inherent risks, which we describe in "Item 7A. Quantitative and Qualitative Disclosure about Market Risk." Our use of derivative financial instruments does not eliminate our exposure to fluctuations in commodity prices and interest rates and has in the past and could in the future result in financial losses or reduce our income. For a discussion of our risk management activities, please read "Item 7A. Quantitative and Qualitative Disclosure about Market Risk."
Our substantial indebtedness could limit our flexibility and adversely affect our financial health.
We have a substantial amount of indebtedness. As of December 31, 2011, we had approximately $713.4 million of indebtedness outstanding primarily comprised of $725.0 million (including $11.6 million of original issue discount) of senior unsecured notes. As of December 31, 2011, there was $85.0 million of borrowing and $69.0 million in outstanding letters of credit, under the bank credit
21
facility leaving approximately $331.0 million available for future borrowing based on a borrowing capacity of $485.0 million. Based on the January amendment to increase the credit facility borrowing capacity to $635.0 million and borrowings outstanding as of December 31, 2011, the Partnership's available borrowing would be $481.0 million.
Our substantial indebtedness could limit our flexibility and adversely affect our financial health. For example, it could:
In addition, our ability to make scheduled payments or to refinance our obligations depends on our successful financial and operating performance. We cannot assure you that our operating performance will generate sufficient cash flow or that our capital resources will be sufficient for payment of our debt obligations in the future. Our financial and operating performance, cash flow and capital resources depend upon prevailing economic conditions and certain financial, business and other factors, many of which are beyond our control.
If our cash flow and capital resources are insufficient to fund our debt service obligations, we may be forced to sell material assets or operations, obtain additional capital or restructure our debt. In the event that we are required to dispose of material assets or operations or restructure our debt to meet our debt service and other obligations, we cannot assure you as to the terms of any such transaction or how quickly any such transaction could be completed, if at all.
We may not be able to access new capital to fund our acquisition and growth strategies which could impair our ability to fund future capital needs and to grow.
Global financial markets and economic conditions have been disrupted and volatile over the past several years. These conditions and current weak world economic conditions have made, and could in the future make, it difficult to obtain funding for our capital needs. As a result, the cost of raising money in the debt and equity capital markets could increase substantially while the availability of funds from those markets could diminish significantly. Due to these factors, we cannot be certain that new debt or equity financing will be available to us on acceptable terms or at all. Without adequate funding, we may be unable to execute our growth strategy, complete future acquisitions or future construction projects or other capital expenditures, take advantage of other business opportunities or respond to competitive pressures, any of which could have a material adverse effect on our revenues and results of operations. Further, our customers may increase collateral requirements from us, including letters of credit which reduce available borrowing capacity, or reduce the business they transact with us to reduce their credit exposure to us.
Due to our lack of asset diversification, adverse developments in our gathering, transmission, processing and NGL services businesses would materially impact our financial condition.
We rely exclusively on the revenues generated from our gathering, transmission, processing, crude terminal and NGL services businesses and as a result our financial condition depends upon prices of, and continued demand for, natural gas and NGLs. Due to our lack of asset diversification, an adverse
22
development in one of these businesses would have a significantly greater impact on our financial condition and results of operations than if we maintained more diverse assets.
We may not be successful in balancing our purchases and sales.
We are a party to certain long-term gas sales commitments that we satisfy through supplies purchased under long-term gas purchase agreements. When we enter into those arrangements, our sales obligations generally match our purchase obligations. However, over time the supplies that we have under contract may decline due to reduced drilling or other causes and we may be required to satisfy the sales obligations by buying additional gas at prices that may exceed the prices received under the sales commitments. In addition, a producer could fail to deliver contracted volumes or deliver in excess of contracted volumes, or a consumer could purchase more or less than contracted volumes. Any of these actions could cause our purchases and sales not to be balanced. If our purchases and sales are not balanced, we will face increased exposure to commodity price risks and could have increased volatility in our operating income.
We have made commitments to purchase natural gas in production areas based on production-area indices and to sell the natural gas into market areas based on market-area indices, pay the costs to transport the natural gas between the two points and capture the difference between the indices as margin. Changes in the index prices relative to each other (also referred to as basis spread) can significantly affect our margins or even result in losses. For example, we are a party to one contract with a term to 2019 to supply approximately 150,000 MMBtu/day of gas. We buy gas for this contract on several different production-area indices on our NTP and sell the gas into a different market area index. For the year ended December 31, 2011 we have recorded a loss of approximately $13.3 million on this contract, and we currently expect that we will record a loss of approximately $13.0 million to $17.0 million on this contract in 2012. Reduced supplies and narrower basis spreads in recent periods have increased the losses on this contract, and greater losses on this contract could occur in future periods if these conditions persist or become worse. For additional information on this contract, please see "Item 7. Management's Discussion and Analysis of Financial Condition and Results of Operations—Overview."
We must continually compete for natural gas supplies, and any decrease in our supplies of natural gas could adversely affect our financial condition and results of operations.
Our gathering systems are connected to natural gas wells from which production will naturally decline over time, which means that its cash flows associated with these sources of natural gas will likely also decline over time. In order to maintain or increase throughput levels in our natural gas gathering systems and asset utilization rates at our processing plants and to fulfill our current sales commitments, we must continually contract for new natural gas supplies. We may not be able to obtain additional contracts for natural gas supplies. The primary factors affecting our ability to connect new wells to our gathering facilities include our success in contracting for existing natural gas supplies that are not committed to other systems and the level of drilling activity near our gathering systems. If we are unable to maintain or increase the throughput on our systems by accessing new natural gas supplies to offset the natural decline in reserves, our business and financial results could be materially, adversely affected. In addition, our future growth will depend in part upon whether we can contract for additional supplies at a greater rate than the rate of natural decline in our currently connected supplies.
Fluctuations in energy prices can greatly affect production rates and investments by third parties in the development of new oil and natural gas reserves. Natural gas prices were relatively low in 2011 and continue to be depressed. Prolonged periods of low natural gas prices may put downward pressure on future drilling activity which may result in lower volumes. Tax policy changes or additional regulatory restrictions on development could also have a negative impact on drilling activity, reducing supplies of
23
natural gas available to our systems. Additional governmental regulation of, or delays in issuance of permits for, the offshore exploration and production industry may negatively impact current and future volumes from offshore pipelines supplying our processing plants. We have no control over producers and depend on them to maintain sufficient levels of drilling activity. A material decrease in natural gas production or in the level of drilling activity in our principal geographic areas for a prolonged period, as a result of depressed commodity prices or otherwise, likely would have a material adverse effect on our results of operations and financial position.
A substantial portion of our assets is connected to natural gas reserves that will decline over time, and the cash flows associated with those assets will decline accordingly.
A substantial portion of our assets, including our gathering systems, is dedicated to certain natural gas reserves and wells for which the production will naturally decline over time. Accordingly, our cash flows associated with these assets will also decline. If we are unable to access new supplies of natural gas either by connecting additional reserves to our existing assets or by constructing or acquiring new assets that have access to additional natural gas reserves, our cash flows may decline.
We are vulnerable to operational, regulatory and other risks due to our concentration of assets in south Louisiana and the Gulf of Mexico, including the effects of adverse weather conditions such as hurricanes.
Our operations and revenues will be significantly impacted by conditions in south Louisiana and the Gulf of Mexico because we have a significant portion of our assets located in these two areas. Our concentration of activity in Louisiana and the Gulf of Mexico makes us more vulnerable than many of our competitors to the risks associated with these areas, including:
Because a significant portion of our operations could experience the same condition at the same time, these conditions could have a relatively greater impact on our results of operations than they might have on other midstream companies who have operations in more diversified geographic areas.
Our use of derivative financial instruments does not eliminate our exposure to fluctuations in commodity prices and interest rates and has in the past and could in the future result in financial losses or reduce our income.
Our operations expose us to fluctuations in commodity prices, and our credit facility exposes us to fluctuations in interest rates. We use over-the-counter price and basis swaps with other natural gas merchants and financial institutions. Use of these instruments is intended to reduce our exposure to short-term volatility in commodity prices. As of December 31, 2011, we have hedged only portions of our expected exposures to commodity price risk. In addition, to the extent we hedge our commodity price risk using swap instruments, we will forego the benefits of favorable changes in commodity prices. Although we do not currently have any financial instruments to eliminate our exposure to interest rate fluctuations, we may use financial instruments in the future to offset our exposure to interest rate fluctuations.
Even though monitored by management, our hedging activities may fail to protect us and could reduce our earnings and cash flow. Our hedging activity may be ineffective or adversely affect cash flow and earnings because, among other factors:
24
Our financial statements may reflect gains or losses arising from exposure to commodity prices for which we are unable to enter into fully effective hedges. In addition, the standards for cash flow hedge accounting are rigorous. Even when we engage in hedging transactions that are effective economically, these transactions may not be considered effective cash flow hedges for accounting purposes. Our earnings could be subject to increased volatility to the extent our derivatives do not continue to qualify as cash flow hedges, and, if we assume derivatives as part of an acquisition, to the extent we cannot obtain or choose not to seek cash flow hedge accounting for the derivatives we assume. Please read "Item 7A. Quantitative and Qualitative Disclosures about Market Risk" for a summary of our hedging activities.
A reduction in demand for NGL products by the petrochemical, refining or other industries or by the fuel markets could materially adversely affect our results of operations and financial condition.
The NGL products we produce have a variety of applications, including as heating fuels, petrochemical feedstocks and refining blend stocks. A reduction in demand for NGL products, whether because of general or industry specific economic conditions, new government regulations, global competition, reduced demand by consumers for products made with NGL products (for example, reduced petrochemical demand observed due to lower activity in the automobile and construction industries), increased competition from petroleum-based feedstocks due to pricing differences, mild winter weather for some NGL applications or other reasons, could result in a decline in the volume of NGL products we handle or reduce the fees we charge for our services. Our NGL products and the demand for these products are affected as follows:
25
season of October through March. Demand for our propane may be reduced during periods of warmer-than-normal weather.
NGLs and products produced from NGLs also compete with global markets. Any reduced demand for ethane, propane, normal butane, isobutane or natural gasoline in the markets we access for any of the reasons stated above could adversely affect demand for the services we provide as well as NGL prices, which would negatively impact our results of operations and financial condition.
Growing our business by constructing new pipelines and processing facilities subjects us to construction risks, risks that natural gas or NGL supplies will not be available upon completion of the facilities and risks of construction delay and additional costs due to obtaining rights-of-way and complying with federal, state and local laws.
One of the ways we intend to grow our business is through the construction of additions to our existing gathering systems and construction of new pipelines and gathering and processing facilities. The construction of pipelines and gathering and processing and fractionation facilities requires the expenditure of significant amounts of capital, which may exceed our expectations. Generally, we may have only limited natural gas or NGL supplies committed to these facilities prior to their construction. Moreover, we may construct facilities to capture anticipated future growth in production in a region in which anticipated production growth does not materialize. We may also rely on estimates of proved reserves in our decision to construct new pipelines and facilities, which may prove to be inaccurate because there are numerous uncertainties inherent in estimating quantities of proved reserves. As a result, new facilities may not be able to attract enough natural gas to achieve our expected investment return, which could adversely affect our results of operations and financial condition. In addition, we face the risks of construction delay and additional costs due to obtaining rights-of-way and local permits and complying with federal or state laws and city ordinances, particularly as we expand our operations into more urban, populated areas such as the Barnett Shale.
If we do not make acquisitions on economically acceptable terms or efficiently and effectively integrate the acquired assets with our asset base, our future growth will be limited.
Our ability to grow depends, in part, on our ability to make acquisitions that result in an increase in cash generated from operations on a per unit basis. If we are unable to make accretive acquisitions either because we are (1) unable to identify attractive acquisition candidates or negotiate acceptable purchase contracts with them, (2) unable to obtain financing for these acquisitions on economically acceptable terms or (3) outbid by competitors, then our future growth and our ability to increase distributions will be limited.
26
From time to time, we may evaluate and seek to acquire assets or businesses that we believe complement our existing business and related assets. We may acquire assets or businesses that we plan to use in a manner materially different from their prior owner's use. Any acquisition involves potential risks, including:
Management's assessment of these risks is necessarily inexact and may not reveal or resolve all existing or potential problems associated with an acquisition. Realization of any of these risks could adversely affect our operations and cash flows. If we consummate any future acquisition, our capitalization and results of operations may change significantly, and you will not have the opportunity to evaluate the economic, financial and other relevant information that we will consider in determining the application of these funds and other resources.
Additionally, our ability to grow our asset base in the near future through acquisitions may be limited due to constrained capital markets.
The terms of our credit facility and indenture may restrict our current and future operations, particularly our ability to respond to changes in business or to take certain actions.
Our credit agreement and the indenture governing our senior notes contain, and any future indebtedness we incur will likely contain, a number of restrictive covenants that impose significant operating and financial restrictions, including restrictions on our ability to engage in acts that may be in our best long-term interest. These agreements include covenants that, among other things, restrict our ability to:
27
In addition, our credit facility requires us to satisfy and maintain specified financial ratios and other financial condition tests. Our ability to meet those financial ratios and tests can be affected by events beyond our control, and we cannot assure you that we will meet those ratios and tests.
A breach of any of these covenants could result in an event of default under our credit facility and indenture. Upon the occurrence of such an event of default, all amounts outstanding under the applicable debt agreements could be declared to be immediately due and payable and all applicable commitments to extend further credit could be terminated. If we are unable to repay the accelerated debt under our senior secured credit facility, the lenders under our senior secured credit facility could proceed against the collateral granted to them to secure that indebtedness. We have pledged substantially all of our assets as collateral under our senior secured credit facility. If indebtedness under our senior secured credit facility or indentures is accelerated, we cannot assure you that we will have sufficient assets to repay the indebtedness. The operating and financial restrictions and covenants in these debt agreements and any future financing agreements may adversely affect our ability to finance future operations or capital needs or to engage in other business activities.
We do not own most of the land on which our pipelines and compression facilities are located, which could disrupt our operations.
We do not own most of the land on which our pipelines and compression facilities are located, and we are therefore subject to the possibility of more onerous terms and/or increased costs to retain necessary land use if we do not have valid rights-of-way or leases or if such rights-of-way or leases lapse or terminate. We sometimes obtain the rights to land owned by third parties and governmental agencies for a specific period of time. Our loss of these rights, through our inability to renew right-of-way contracts, leases or otherwise, could cause us to cease operations on the affected land, increase costs related to continuing operations elsewhere, and reduce our revenue.
We expect to encounter significant competition in any new geographic areas into which we seek to expand and our ability to enter such markets may be limited.
If we expand our operations into new geographic areas, we expect to encounter significant competition for natural gas supplies and markets. Competitors in these new markets will include companies larger than us, which have both lower cost of capital and greater geographic coverage, as well as smaller companies, which have lower total cost structures. As a result, we may not be able to successfully develop acquired assets and markets located in new geographic areas and our results of operations could be adversely affected.
We may not be able to retain existing customers or acquire new customers, which would reduce our revenues and limit our future profitability.
The renewal or replacement of existing contracts with our customers at rates sufficient to maintain current revenues and cash flows depends on a number of factors beyond our control, including competition from other pipelines, and the price of, and demand for, natural gas in the markets we
28
serve. The inability of our management to renew or replace our current contracts as they expire and to respond appropriately to changing market conditions could have a negative effect on our profitability.
In particular, our ability to renew or replace our existing contracts with industrial end-users and utilities impacts our profitability. For the year ended December 31, 2011, approximately 49% of our sales of gas that was transported using our physical facilities were to industrial end-users and utilities. As a consequence of the increase in competition in the industry and volatility of natural gas prices, end-users and utilities are reluctant to enter into long-term purchase contracts. Many end-users purchase natural gas from more than one natural gas company and have the ability to change providers at any time. Some of these end-users also have the ability to switch between gas and alternate fuels in response to relative price fluctuations in the market. Because there are numerous companies of greatly varying size and financial capacity that compete with us in the marketing of natural gas, we often compete in the end-user and utilities markets primarily on the basis of price.
We depend on certain key customers, and the loss of any of our key customers could adversely affect our financial results.
We derive a significant portion of our revenues from contracts with key customers. To the extent that these and other customers may reduce volumes of natural gas purchased or transported under existing contracts, we would be adversely affected unless we were able to make comparably profitable arrangements with other customers. Certain agreements with key customers provide for minimum volumes of natural gas or natural gas services that require the customer to transport, process or purchase until the expiration of the term of the applicable agreement, subject to certain force majeure provisions. Customers may default on their obligations to transport, process or purchase the minimum volumes of natural gas or natural gas services required under the applicable agreements.
We are exposed to the credit risk of our customers and counterparties, and a general increase in the nonpayment and nonperformance by our customers could have an adverse effect on our financial condition and results of operations.
Risks of nonpayment and nonperformance by our customers are a major concern in our business. We are subject to risks of loss resulting from nonpayment or nonperformance by our customers and other counterparties, such as our lenders and hedging counterparties. Any increase in the nonpayment and nonperformance by our customers could adversely affect our results of operations and reduce our ability to make distributions to our unitholders.
Federal, state or local regulatory measures could adversely affect our business.
Our natural gas gathering and processing activities generally are exempt from FERC regulation under the Natural Gas Act. However, the distinction between FERC-regulated transmission services and federally unregulated gathering services is the subject of substantial, on-going litigation, so the classification and regulation of our gathering facilities are subject to change based on future determinations by FERC and the courts. Natural gas gathering may receive greater regulatory scrutiny at both the state and federal levels since FERC has less extensively regulated the gathering activities of interstate pipeline transmission companies and a number of such companies have transferred gathering facilities to unregulated affiliates. Our gathering operations also may be or become subject to safety and operational regulations relating to the design, installation, testing, construction, operation, replacement and management of gathering facilities. Additional rules and legislation pertaining to these matters are considered or adopted from time to time. We cannot predict what effect, if any, such changes might have on our operations, but the industry could be required to incur additional capital expenditures and increased costs depending on future legislative and regulatory changes.
29
The rates, terms and conditions of service under which we transport natural gas in our pipeline systems in interstate commerce are subject to FERC regulation under Section 311 of the Natural Gas Policy Act. Under these regulations, we are required to justify our rates for interstate transportation service on a cost-of-service basis, every three years. Our intrastate natural gas pipeline operations are subject to regulation by various agencies of the states in which they are located. Should FERC or any of these state agencies determine that our rates for Section 311 transportation service or intrastate transportation service should be lowered, our business could be adversely affected.
The Cajun-Sibon NGL pipeline is scheduled to be operational in the first half of 2013. The rates for service on that pipeline will be regulated by FERC under the Interstate Commerce Act, the Energy Policy Act of 1992 and regulations and orders promulgated thereunder. In 2012, we intend to request FERC's authorization of the initial rates to be charged for transportation service on the Cajun-Sibon NGL pipeline. FERC may not approve the proposed initial rates or may otherwise limit the revenues we may collect for transporting NGLs on the pipeline.
When the Cajun-Sibon NGL pipeline is operational, our rates may be subject to decrease and we may be required to pay refunds or reparations. The Interstate Commerce Act permits interested persons to challenge proposed new or changed rates and authorizes FERC to suspend the effectiveness of such rates for up to seven months and investigate such rates. If, upon completion of an investigation, FERC finds that the new or changed rate is unlawful, it is authorized to require the pipeline to refund revenues collected in excess of the just and reasonable rate during the term of the investigation. The just and reasonable rate used to calculate refunds cannot be lower than the last tariff rate approved as just and reasonable. FERC may also investigate, upon complaint or on its own motion, rates that are already in effect and may order a carrier to change its rates prospectively. Upon an appropriate showing, a shipper may obtain reparations for charges in excess of a just and reasonable for a period of up to two years prior to the filing of a complaint.
FERC's primary ratemaking methodology for NGL pipelines is the annual indexing methodology, under which pipelines increase or decrease their rates in accordance with an index adjustment specified by FERC. Under FERC's regulations, an NGL pipeline can request a rate increase that exceeds the rate obtained through application of the indexing methodology by using a cost-of-service approach, but only after the pipeline establishes that a substantial divergence exists between the actual costs experienced by the pipeline and the rates resulting from application of the indexing methodology. If we are limited to the increases permitted under the indexing methodology, we may be unable to collect revenues sufficient to recover our cost of service.
Other state and local regulations also affect our business. We are subject to some ratable take and common purchaser statutes in the states where we operate. Ratable take statutes generally require gatherers to take, without undue discrimination, natural gas production that may be tendered to the gatherer for handling. Similarly, common purchaser statutes generally require gatherers to purchase without undue discrimination as to source of supply or producer. These statutes have the effect of restricting our right as an owner of gathering facilities to decide with whom we contract to purchase or transport natural gas. Federal law leaves any economic regulation of natural gas gathering to the states, and some of the states in which we operate have adopted complaint-based or other limited economic regulation of natural gas gathering activities. States in which we operate that have adopted some form of complaint-based regulation, like Texas, generally allow natural gas producers and shippers to file complaints with state regulators in an effort to resolve grievances relating to natural gas gathering access and rate discrimination.
The states in which we conduct operations administer federal pipeline safety standards under the Natural Gas Pipeline Safety Act of 1968. These standards only apply to certain gathering lines based on the gathering line's operating pressure and proximity to people. Because of their pressure and location, substantial portions of our gathering facilities are not regulated under that statute. The gathering line
30
exemptions, however, may be restricted in the future, and they do not apply to our natural gas transmission pipelines. In response to recent pipeline accidents in other parts of the country, Congress and the Department of Transportation, or DOT, have passed or are considering heightened pipeline safety requirements, including gathering lines.
Compliance with pipeline integrity and other pipeline safety regulations issued by the United States Department of Transportation or those issued by the TRRC could result in substantial expenditures for testing, repairs and replacement. TRRC regulations require periodic testing of all intrastate pipelines meeting certain size and location requirements. Our costs relating to compliance with the required testing under the TRRC regulations, adjusted to exclude costs associated with discontinued operations, were approximately at $1.3 million, $1.4 million, and $1.1 million for the years ended December 31, 2011, 2010, and 2009, respectively. We expect the costs for compliance with TRRC and DOT regulations to be approximately $2.0 million during 2012. If our pipelines fail to meet the safety standards mandated by the TRRC or the DOT regulations, then we may be required to repair or replace sections of such pipelines, the cost of which cannot be estimated at this time.
As our operations continue to expand into and around urban, or more populated areas, such as the Barnett Shale, we may incur additional expenses to mitigate noise, odor and light that may be emitted in our operations, and expenses related to the appearance of our facilities. Municipal and other local or state regulations are imposing various obligations, including, among other things, regulating the location of our facilities, imposing limitations on the noise levels of our facilities and requiring certain other improvements that increase the cost of our facilities. We are also subject to claims by neighboring landowners for nuisance related to the construction and operation of our facilities, which could subject us to damages for declines in neighboring property values due to our construction and operation of facilities.
Our business involves hazardous substances and may be adversely affected by environmental regulation.
Many of the operations and activities of our gathering systems, processing plants, fractionators and other facilities are subject to significant federal, state and local environmental laws and regulations. The obligations imposed by these laws and regulations include obligations related to air emissions and discharge of pollutants from our facilities and the cleanup of hazardous substances and other wastes that may have been released at properties currently or previously owned or operated by us or locations to which we have sent wastes for treatment or disposal. Various governmental authorities have the power to enforce compliance with these laws and regulations and the permits issued under them, and violators are subject to administrative, civil and criminal penalties, including civil fines, injunctions or both. Strict, joint and several liability may be incurred under these laws and regulations for the remediation of contaminated areas. Private parties, including the owners of properties near our facilities or upon or through which our gathering systems traverse, may also have the right to pursue legal actions to enforce compliance as well as to seek damages for non-compliance with environmental laws and regulations for releases of contaminants or for personal injury or property damage.
There is inherent risk of the incurrence of significant environmental costs and liabilities in our business due to our handling of natural gas and other petroleum substances, air emissions related to our operations, historical industry operations, waste disposal practices and the prior use of natural gas flow meters containing mercury. In addition, the possibility exists that stricter laws, regulations or enforcement policies could significantly increase our compliance costs and the cost of any remediation that may become necessary. We may incur material environmental costs and liabilities. Furthermore, our insurance may not provide sufficient coverage in the event an environmental claim is made against us.
Our business may be adversely affected by increased costs due to stricter pollution control requirements or liabilities resulting from non-compliance with required operating or other regulatory
31
permits. New environmental laws or regulations, including, for example, legislation relating to the control of greenhouse gas emissions, or changes in existing environmental laws or regulations might adversely affect our products and activities, including processing, storage and transportation, as well as waste management and air emissions. Federal and state agencies could also impose additional safety requirements, any of which could affect our profitability. Changes in laws or regulations could also limit our production or the operation of our assets or adversely affect our ability to comply with applicable legal requirements or the demand for natural gas, which could adversely affect our business and our profitability.
Our business involves many hazards and operational risks, some of which may not be fully covered by insurance.
Our operations are subject to the many hazards inherent in the gathering, compressing, processing and storage of natural gas and NGLs, including:
These risks could result in substantial losses due to personal injury and/or loss of life, severe damage to and destruction of property and equipment and pollution or other environmental damage and may result in curtailment or suspension of our related operations. We are not fully insured against all risks incident to our business. In accordance with typical industry practice, we do not have any property insurance on any of our underground pipeline systems that would cover damage to the pipelines. We are not insured against all environmental accidents that might occur, other than those considered to be sudden and accidental. If a significant accident or event occurs that is not fully insured, it could adversely affect our operations and financial condition.
The adoption of derivatives legislation by the United States Congress could have an adverse effect on our ability to hedge risks associated with our business.
The United States Congress has adopted comprehensive financial reform legislation that establishes federal oversight and regulation of the over-the-counter derivatives market and entities, such as us, that participate in that market. The new legislation was signed into law by the President on July 21, 2010, and requires the Commodities Futures Trading Commission (the "CFTC") and the SEC to promulgate rules and regulations implementing the new legislation within 360 days from the date of enactment. The CFTC has also promulgated regulations that set position limits for certain futures and option contracts in the major energy markets. The financial reform legislation may also require us to comply with margin requirements in connection with our derivative activities, although the application of those provisions to us is uncertain at this time. The CFTC has proposed regulations that may provide to us the certainty that we will not be required to comply with margin requirements, but the timing of the adoption of any such regulations, and their scope, are uncertain. If margin requirements and other trading structures apply to us, the new legislation and any new regulations could significantly increase the cost of derivative contracts, materially alter the terms of derivative contracts, reduce the availability of derivatives to protect against risks we encounter, and reduce our ability to monetize or restructure our existing derivative contracts. If we reduce our use of derivatives as a result of the legislation and regulations, our results of operations may become more volatile and our cash flows may be less predictable, which could adversely affect our ability to plan for and fund capital expenditures. Finally, the legislation was intended, in part, to reduce the volatility of oil and natural gas prices, which
32
some legislators attributed to speculative trading in derivatives and commodity instruments related to oil and natural gas. Our revenues could therefore be adversely affected if a consequence of the legislation and regulations is to lower commodity prices. Any of these consequences could have a material, adverse effect on our financial condition and results of operations.
Climate change legislation and regulatory initiatives could result in increased operating costs and reduced demand for the natural gas and NGL services we provide.
On December 15, 2009, the EPA published its findings that emissions of carbon dioxide, methane and other greenhouse gases ("GHGs") present an endangerment to public health and the environment because emissions of such gases are, according to the EPA, contributing to warming of the earth's atmosphere and other climatic changes. These findings allowed the EPA to proceed with the adoption and implementation of regulations restricting emissions of GHGs under existing provisions of the federal Clean Air Act. Accordingly, the EPA has adopted two sets of regulations under the Clean Air Act that would require a reduction in emissions of GHGs from motor vehicles and could trigger permit review for GHG emissions from certain stationary sources. Moreover, on October 30, 2009, the EPA published a "Mandatory Reporting of Greenhouse Gases" final rule that establishes a new comprehensive scheme requiring operators of stationary sources emitting more than established annual thresholds of carbon dioxide-equivalent GHGs to inventory and report their GHG emissions annually on a facility-by-facility basis, which was expanded by a rule promulgated on November 30, 2010 to include owners and operators of onshore oil and natural gas production, processing, transmission, storage and distribution facilities. Reporting emissions from such onshore activities is required on an annual basis beginning in 2012 for emissions occurring in 2011.
In addition, both houses of Congress have actively considered legislation to reduce emissions of GHGs, and almost half of the states have already taken legal measures to reduce emissions of GHGs, primarily through the planned development of GHG emission inventories and/or regional GHG cap and trade programs. Most of these cap and trade programs work by requiring either major sources of emissions, such as electric power plants, or major producers of fuels, such as refineries and NGL fractionation plants, to acquire and surrender emission allowances with the number of allowances available for purchase reduced each year until the overall GHG emission reduction goal is achieved. The adoption of legislation or regulations imposing reporting or permitting obligations on, or limiting emissions of GHGs from, our equipment and operations could require us to incur additional costs to reduce emissions of GHGs associated with our operations, could adversely affect our performance of operations in the absence of any permits that may be required to regulate emission of greenhouse gases, or could adversely affect demand for the natural gas we gather, process or otherwise handle in connection with our services.
We typically do not obtain independent evaluations of natural gas reserves dedicated to our gathering pipeline systems; therefore, volumes of natural gas on our systems in the future could be less than we anticipate.
We typically do not obtain independent evaluations of natural gas reserves connected to our gathering systems due to the unwillingness of producers to provide reserve information as well as the cost of such evaluations. Accordingly, we do not have independent estimates of total reserves dedicated to our gathering systems or the anticipated life of such reserves. If the total reserves or estimated life of the reserves connected to our gathering systems is less than we anticipate and we are unable to secure additional sources of natural gas, then the volumes of natural gas transported on our gathering systems in the future could be less than anticipated. A decline in the volumes of natural gas on our systems could have a material adverse effect on our results of operations and financial condition.
33
Our success depends on key members of our management, the loss or replacement of whom could disrupt our business operations.
We depend on the continued employment and performance of the officers of our general partner and key operational personnel. Our general partner has entered into employment agreements with each of its executive officers. If any of these officers or other key personnel resign or become unable to continue in their present roles and are not adequately replaced, our business operations could be materially adversely affected. We do not maintain any "key man" life insurance for any officers.
Increased regulation of hydraulic fracturing could result in reductions or delays in natural gas production by our customers, which could adversely impact our revenues.
A portion of our customers' natural gas production is developed from unconventional sources, such as deep gas shales, that require hydraulic fracturing as part of the completion process. Hydraulic fracturing involves the injection of water, sand and chemicals under pressure into the formation to stimulate gas production. Hydraulic fracturing activities are generally regulated by state oil and gas commissions. In recent years, however, there have been federal legislative and administrative agency initiatives that would subject the process to increased regulation at the federal level. Legislation to amend the Safe Drinking Water Act to repeal the exemption for hydraulic fracturing from definition of "underground injection" and require federal permitting and regulatory control of hydraulic fracturing, as well as legislative proposals to require disclosure of the chemical constituents of the fluids used in the fracturing process, were proposed in recent sessions of Congress. The U.S. Congress continues to consider legislation to amend the Safe Drinking Water Act. Scrutiny of hydraulic fracturing activities continues in other ways, with the EPA having commenced a multi-year study of the potential environmental impacts of hydraulic fracturing, the results of which are anticipated to be available in late 2012. Several states have also proposed or adopted legislative or regulatory requirements imposing disclosure obligation with respect to the composition of hydraulic fracturing . We cannot predict whether any additional legislation or regulations will be enacted and if so, what the provisions would be. If additional levels of regulation and permits were required through the adoption of new laws and regulations at the federal or state level, that could lead to delays, increased operating costs and process prohibitions that could reduce the volumes of natural gas that move through our gathering systems which would materially adversely affect our revenue and results of operations.
Risk Inherent In An Investment In the Partnership
Cash distributions are not guaranteed and may fluctuate with our performance and the establishment of financial reserves.
Because distributions on our common units are dependent on the amount of cash we generate, distributions may fluctuate based on our performance. The actual amount of cash that is available to be distributed each quarter will depend on numerous factors, some of which are beyond our control and the control of our general partner. Cash distributions are dependent primarily on cash flow, including cash flow from financial reserves and working capital borrowings and not solely on profitability, which is affected by non-cash items. Therefore, cash distributions might be made during periods when we record losses and might not be made during periods when we record profits.
We may not have sufficient available cash from operating surplus each quarter to enable us to make cash distributions at our current distribution rate under our cash distribution policy. The amount of cash we can distribute on our units principally depends upon the amount of cash we generate from our operations, which will fluctuate from quarter to quarter based on, among other things:
34
In addition, the actual amount of cash we will have available for distribution will depend on other factors, some of which are beyond our control, including:
Crosstex Energy, Inc., or CEI, controls our general partner and owned a 25.0% fully diluted limited partner interest in us as of December 31, 2011. Our general partner has conflicts of interest and limited fiduciary responsibilities, which may permit our general partner to favor its own interests.
As of December 31, 2011, CEI indirectly owned an aggregate fully diluted limited partner interest of approximately 25.0% in us. In addition, CEI owns and controls our general partner. Due to its control of our general partner and the size of its limited partner interest in us, CEI effectively controls all limited partnership decisions, including any decisions related to the removal of our general partner. Conflicts of interest may arise in the future between CEI and its affiliates, including our general partner, on the one hand, and our partnership, on the other hand. As a result of these conflicts our general partner may favor its own interests and those of its affiliates over our interests. These conflicts include, among others, the following situations:
Conflicts Relating to Control
35
Conflicts Relating to Costs
Our unitholders have no right to elect our general partner or the directors of its general partner and have limited ability to remove our general partner.
Unlike the holders of common stock in a corporation, unitholders have only limited voting rights on matters affecting our business, and therefore limited ability to influence management's decisions regarding our business. Unitholders did not elect our general partner or the board of directors of its general partner and have no right to elect our general partner or the board of directors of its general partner on an annual or other continuing basis.
Furthermore, if unitholders are dissatisfied with the performance of our general partner, they will have little ability to remove our general partner. The general partner generally may not be removed except upon the vote of the holders of 662/3% of the outstanding units voting together as a single class. Affiliates of the general partner controlled approximately 25.0% of all the limited partner units as December 31, 2011.
In addition, unitholders' voting rights are further restricted by the partnership agreement. It provides that any units held by a person that owns 20.0% or more of any class of units then outstanding, other than our general partner, its affiliates, their transferees and persons who acquired such units with the prior approval of the board of directors of the general partner's general partner, cannot be voted on any matter. In addition, the partnership agreement contains provisions limiting the ability of unitholders to call meetings or to acquire information about our operations, as well as other provisions limiting the unitholders' ability to influence the manner or direction of management.
As a result of these provisions, it will be more difficult for a third party to acquire our partnership without first negotiating such a purchase with our general partner and, as a result, our unitholders are less likely to receive a takeover premium.
Cost reimbursements due our general partner may be substantial and will reduce the cash available for distribution to our unitholders.
Prior to making any distributions on the units, we reimburse our general partner and its affiliates, including officers and directors of our general partner, for all expenses they incur on our behalf. The
36
reimbursement of expenses could adversely affect our ability to make distributions to our unitholders. Our general partner has sole discretion to determine the amount of these expenses.
The control of our general partner may be transferred to a third party without unitholder consent.
The general partner may transfer its general partner interest to a third party in a merger or in a sale of all or substantially all of its assets without the consent of the unitholders. Furthermore, there is no restriction in the partnership agreement on the ability of the owner of the general partner from transferring its ownership interest in the general partner to a third party. The new owner of the general partner would then be in a position to replace the board of directors and officers of the general partner with its own choices and to control the decisions taken by the board of directors and officers.
Our general partner's absolute discretion in determining the level of cash reserves may adversely affect our ability to make cash distributions to our unitholders.
Our partnership agreement requires our general partner to deduct from operating surplus cash reserves that in its reasonable discretion are necessary to fund our future operating expenditures. In addition, the partnership agreement permits our general partner to reduce available cash by establishing cash reserves for the proper conduct of our business, to comply with applicable law or agreements to which we are a party or to provide funds for future distributions to partners. These cash reserves will affect the amount of cash available for distribution to our unitholders.
Our partnership agreement contains provisions that reduce the remedies available to our unitholders for actions that might otherwise constitute a breach of fiduciary duty by our general partner.
Our partnership agreement limits the liability and reduces the fiduciary duties of our general partner to our unitholders. The partnership agreement also restricts the remedies available to our unitholders for actions that would otherwise constitute breaches of our general partner's fiduciary duties. If you choose to purchase a common unit, you will be treated as having consented to the various actions contemplated in the partnership agreement and conflicts of interest that might otherwise be considered a breach of fiduciary duties under applicable state law.
We may issue additional units without our unitholders' approval, which would dilute our unitholders' ownership interests.
We may issue an unlimited number of limited partner interests of any type without the approval of our unitholders. The issuance of additional limited partner interests will have the following effects:
Our general partner has a limited call right that may require our unitholders to sell their common units at an undesirable time or price.
If at any time our general partner and its affiliates own more than 80.0% of the common units, our general partner will have the right, but not the obligation, which it may assign to any of its affiliates or to us, to acquire all, but not less than all, of the common units held by unaffiliated persons at a price not less than their then-current market price. As a result, our unitholders may be required to sell their common units at an undesirable time or price and may therefore not receive any return on their investment. Our unitholders may also incur a tax liability upon a sale of their units.
37
Our unitholders may not have limited liability if a court finds that unitholder action constitutes control of our business.
Our unitholders could be held liable for our obligations to the same extent as a general partner if a court determined that the right or the exercise of the right by our unitholders to remove or replace our general partner, to approve amendments to our partnership agreement, or to take other action under our partnership agreement constituted participation in the "control" of our business, to the extent that a person who has transacted business with the partnership reasonably believes, based on our unitholders' conduct, that our unitholders are a general partner. Our general partner generally has unlimited liability for the obligations of the partnership, such as its debts and environmental liabilities, except for those contractual obligations of the partnership that are expressly made without recourse to our general partner. In addition, Section 17-607 of the Delaware Revised Uniform Limited Partnership Act provides that a limited partner who receives a distribution and knew at the time of the distribution that the distribution was in violation of that section may be liable to the limited partnership for the amount of the distribution for a period of three years from the date of the distribution. The limitations on the liability of holders of limited partner interests for the obligations of a limited partnership have not been clearly established in some of the other states in which we do business.
Tax Risks to Our Unitholders
Our tax treatment depends on our status as a partnership for federal income tax purposes, as well as our not being subject to entity level taxation by individual states. If the IRS treats us as a corporation or we become subject to entity level taxation for state tax purposes, it would substantially reduce the amount of cash available for distribution to you.
The anticipated after-tax economic benefit of an investment in us depends largely on our being treated as a partnership for federal income tax purposes. We have not requested, and do not plan to request, a ruling from the IRS on this or any other matter affecting us.
If we were treated as a corporation for federal income tax purposes, we would pay additional tax on our income at corporate rates of up to 35.0% (under the law as of the date of this report) and we would probably pay state income taxes as well. In addition, distributions to unitholders would generally be taxed again as corporate distributions and none of our income, gains, losses, or deductions would flow through to unitholders. Because a tax would be imposed upon us as a corporation, the cash available for distribution to unitholders would be substantially reduced. Therefore, treatment of us as a corporation would result in a material reduction in the anticipated cash flow and after-tax return to the unitholders and thus would likely result in a material reduction in the value of the common units.
Current law may change so as to cause us to be treated as a corporation for federal income tax purposes or otherwise subject us to entity-level taxation. At the federal level, members of Congress have considered substantive changes to the existing U.S. tax laws that would have affected certain publicly traded partnerships. Although the legislation considered would not have appeared to affect our tax treatment, we are unable to predict whether any such change or other proposals will ultimately be enacted. Moreover, any modification to the federal income tax laws and interpretations thereof may or may not be applied retroactively. At the state level, because of widespread state budget deficits, several states are evaluating ways to subject partnerships to entity level taxation through the imposition of state income, franchise and other forms of taxation. For example, we are required to pay Texas franchise tax at a maximum effective rate of 1.0% of our gross income apportioned to Texas in the prior year. If federal income tax or material amounts of additional state tax were to be imposed on us, the cash available for distribution to unitholders could be reduced and/or the value of an investment in our common units would be adversely impacted. Our partnership agreement provides that, if a law is enacted or existing law is modified or interpreted in a manner that subjects us to taxation as a corporation or otherwise subjects us to entity-level taxation for federal, state, or local income tax
38
purposes, the minimum quarterly distribution amount and the target distribution amounts will be decreased to reflect the impact of that law on us.
If the IRS contests the federal income tax positions we take, the market for our common units may be adversely impacted and the costs of any contest could reduce the cash available for distribution to our unitholders.
We have not requested any ruling from the IRS with respect to our treatment as a partnership for federal income tax purposes or any other matter affecting us. The IRS may adopt positions that differ from our counsel's conclusions expressed in this annual report or from the positions we take. It may be necessary to resort to administrative or court proceedings to sustain some or all of our counsel's conclusions or the positions we take. A court may not agree with all of our counsel's conclusions or the positions we take. Any contest with the IRS may materially and adversely impact the market for our common units and the prices at which our common units trade. In addition, our costs of any contest with the IRS will be borne by us and therefore indirectly by our unitholders and our general partner since such costs will reduce the amount of cash available for distribution by us.
Unitholders may be required to pay taxes on their share of our taxable income even if they do not receive any cash distributions from us.
Because our unitholders will be treated as partners to whom we will allocate taxable income which could be different in amount than the cash we distribute, they will be required to pay federal income taxes and, in some cases, state and local income taxes on their share of our taxable income even if they do not receive cash distributions from us. Unitholders may not receive cash distributions from us equal to their share of our taxable income or even the tax liability that results from that income.
Tax gain or loss on the disposition of our common units could be different than expected.
Unitholders who sell common units will recognize gain or loss equal to the difference between the amount realized and their tax basis in those common units. Because distributions in excess of the unitholders' allocable share of total net taxable income decrease the unitholder's tax basis in his or her units, the amount, if any, of such prior excess distributions with respect to the units sold by the unitholder, will, in effect, become taxable income to the unitholder if the common unit is sold at a price greater than the tax basis in that common unit, even if the price received is less than the original cost. Furthermore, a substantial portion of the amount realized, whether or not representing gain, may be taxed as ordinary income to the unitholder due to potential recapture items, including depreciation recapture. In addition, because the amount realized includes a unitholder's share of our non-recourse liabilities, a unitholder who sells units may incur a tax liability in excess of the amount of cash received from the sale.
Tax-exempt entities and foreign persons face unique tax issues from owning common units that may result in adverse tax consequences to them.
Investment in common units by tax-exempt entities, such as individual retirement accounts (known as IRAs), pension plans, and non-U.S. persons, raises issues unique to them. For example, virtually all of our income allocated to organizations exempt from federal income tax, including individual retirement accounts and other qualified retirement plans, will be unrelated business income and will be taxable to them. Distributions to non-U.S. persons will be reduced by withholding taxes, at the highest applicable effective tax rate, and non-U.S. persons will be required to file federal income tax returns and generally pay tax on their share of our taxable income. If you are a tax-exempt entity or a foreign person, you should consult your tax advisor before investing in our common units.
39
We will treat each purchase of common units as having the same tax benefits without regard to the specific units purchased. The IRS may challenge this treatment, which could adversely affect the value of the common units.
Because we cannot match transferors and transferees of common units and because of other reasons, we will take depreciation and amortization positions that may not conform to all aspects of existing Treasury regulations. A successful IRS challenge to those positions could adversely affect the amount of tax benefits available to unitholders. It also could affect the timing of these tax benefits or the amount of gain from the sale of common units and could have a negative impact on the value of our common units or result in audit adjustments to the tax returns of unitholders.
The sale or exchange of 50% or more of our capital and profits interests within a 12-month period will result in the termination of our partnership for federal income tax purposes.
We will be considered to have terminated our partnership for federal income tax purposes if there is a sale or exchange of 50% or more of the total interests in our capital and profits within a 12-month period. Our termination would, among other things, result in the closing of our taxable year for all unitholders. Our termination could also result in a deferral of depreciation deductions allowable in computing our taxable income. In the case of a unitholder who has adopted a taxable year other than a fiscal year ending December 31, the closing of our taxable year may also result in more than twelve months of our taxable income or loss being includable in such unitholder's taxable income for the year of termination. Our termination would cause us to be treated as a new partnership for tax purposes, and we could be subject to penalties if we were to fail to recognize and properly report on our tax return that a termination occurred.
The tax treatment of publicly traded partnerships or an investment in our common units could be subject to potential legislative, judicial or administrative changes and differing interpretations, possibly on a retroactive basis.
The present federal income tax treatment of publicly traded partnerships, including us, or an investment in our common units, may be modified by administrative, legislative or judicial interpretation at any time. Any modification to the federal income tax laws and interpretations thereof may or may not be applied retroactively. Moreover, any such modification could make it more difficult or impossible for us to meet the exception which allows publicly traded partnerships that generate qualifying income to be treated as partnerships (rather than corporations) for U.S. federal income tax purposes, affect or cause us to change our business activities, or affect the tax consequences of an investment in our common units. For example, members of Congress have been considering substantive changes to the definition of qualifying income and the treatment of certain types of income earned from profits interests in partnerships. While these specific proposals would not appear to affect our treatment as a partnership, we are unable to predict whether any of these changes, or other proposals, will ultimately be enacted. Any such changes could negatively impact the value of an investment in our common units.
As a result of investing in our common units, you will likely be subject to state and local taxes and return filing or withholding requirements in jurisdictions where you do not live.
In addition to federal income taxes, you will likely be subject to other taxes such as state and local income taxes, unincorporated business taxes and estate, inheritance or intangible taxes that are imposed by the various jurisdictions in which we do business or own property. You will likely be required to file state and local tax returns and pay state and local income taxes in some or all of the various jurisdictions in which we do business or own property and you may be subject to penalties for failure to comply with those requirements. We own property or conduct business in Texas and Louisiana. Louisiana imposes an income tax, generally. Texas does not impose a state income tax on individuals,
40
but does impose a franchise tax to which we are subject. We may do business or own property in other states in the future. It is our unitholders' responsibility to file all federal, state, local, and foreign tax returns. Under the tax laws of some states where we will conduct business, we may be required to withhold a percentage from amounts to be distributed to a unitholder who is not a resident of that state. Our counsel has not rendered an opinion on the state, local, or foreign tax consequences of owning our common units.
We prorate our items of income, gain, loss and deduction between transferors and transferees of our units each month based upon the ownership of our units on the first day of each month, instead of on the basis of the date a particular unit is transferred. The IRS may challenge this treatment, which could change the allocation of items of income, gain, loss and deduction among our unitholders.
We prorate our items of income, gain, loss and deduction between transferors and transferees of our units each month based upon the ownership of our units on the first day of each month, instead of on the basis of the date a particular unit is transferred. The use of this proration method may not be permitted under existing Treasury Regulations, and, accordingly, our counsel is unable to opine as to the validity of this method. Recently, the U.S. Treasury Department issued proposed Treasury Regulations that provide a safe harbor pursuant to which publicly traded partnerships may use a similar monthly simplifying convention to allocate tax items among transferor and transferee unitholders. Nonetheless, the proposed regulations do not specifically authorize the use of the proration method we have adopted. If the IRS were to challenge this method or new Treasury regulations were issued, we may be required to change the allocation of items of income, gain, loss and deduction among our unitholders.
A unitholder whose units are loaned to a "short seller" to cover a short sale of units may be considered as having disposed of those units. If so, he would no longer be treated for tax purposes as a partner with respect to those units during the period of the loan and may recognize gain or loss from the disposition.
Because a unitholder whose units are loaned to a "short seller" to cover a short sale of units may be considered as having disposed of the loaned units, he may no longer be treated for tax purposes as a partner with respect to those units during the period of the loan to the short seller and the unitholder may recognize gain or loss from such disposition. Moreover, during the period of the loan to the short seller, any of our income, gain, loss or deduction with respect to those units may not be reportable by the unitholder and any cash distributions received by the unitholder as to those units could be fully taxable as ordinary income. Our counsel has not rendered an opinion regarding the treatment of a unitholder where common units are loaned to a short seller to cover a short sale of common units; therefore, unitholders desiring to assure their status as partners and avoid the risk of gain recognition from a loan to a short seller are urged to modify any applicable brokerage account agreements to prohibit their brokers from borrowing their units.
Compliance with and changes in tax law could adversely affect our performance.
We are subject to extensive tax laws and regulations, including federal and state income taxes and transactional taxes such as excise, sales/use, payroll, franchise and ad valorem taxes. New tax laws and regulations and changes in existing tax laws and regulations are continuously being enacted that could result in increased tax expenditures in the future. Many of these tax liabilities are subject to audits by the respective taxing authority. These audits may result in additional taxes as well as interest and penalties.
Item 1B. Unresolved Staff Comments
We do not have any unresolved staff comments.
41
A description of our properties is contained in "Item 1. Business."
Title to Properties
Substantially all of our pipelines are constructed on rights-of-way granted by the apparent record owners of the property. Lands over which pipeline rights-of-way have been obtained may be subject to prior liens that have not been subordinated to the right-of-way grants. We have obtained, where necessary, easement agreements from public authorities and railroad companies to cross over or under, or to lay facilities in or along, watercourses, county roads, municipal streets, railroad properties and state highways, as applicable. In some cases, property on which our pipeline was built was purchased in fee. Our processing plants are located on land that we lease or own in fee.
We believe that we have satisfactory title to all of our rights-of-way and land assets. Title to these assets may be subject to encumbrances or defects. We believe that none of such encumbrances or defects should materially detract from the value of our assets or from our interest in these assets or should materially interfere with their use in the operation of the business.
Our operations are subject to a variety of risks and disputes normally incident to our business. As a result, at any given time we may be a defendant in various legal proceedings and litigation arising in the ordinary course of business, including litigation on disputes related to contracts, property use or damage and personal injury. Additionally, as we continue to expand operations into more urban, populated areas, such as the Barnett Shale, we may see an increase in claims brought by area landowners, such as nuisance claims and other claims based on property rights. Except as otherwise set forth herein, we do not believe that any pending or threatened claim or dispute is material to our financial results on our operations. We maintain insurance policies with insurers in amounts and with coverage and deductibles as our general partner believes are reasonable and prudent. However, we cannot assure that this insurance will be adequate to protect us from all material expenses related to potential future claims for personal and property damage or that these levels of insurance will be available in the future at economical prices.
On June 7, 2010, Formosa Plastics Corporation, Texas, Formosa Plastics Corporation America, Formosa Utility Venture, Ltd., and Nan Ya Plastics Corporation, America filed a lawsuit against Crosstex Energy, Inc., Crosstex Energy, L.P., Crosstex Energy GP, L.P., Crosstex Energy GP, LLC, Crosstex Energy Services, L.P., and Crosstex Gulf Coast Marketing, Ltd. in the 24th Judicial District Court of Calhoun County, Texas, asserting claims for negligence, res ipsa loquitor, products liability and strict liability relating to the alleged receipt by the plaintiffs of natural gas liquids into their facilities from facilities operated by the Partnership. The amended petition alleges that the plaintiffs have incurred approximately $35.0 million in damages, including damage to equipment and lost profits. The Partnership has submitted the claim to its insurance carriers and intends to vigorously defend the lawsuit. The Partnership believes that any recovery would be within applicable policy limits. Although it is not possible to predict the ultimate outcome of this matter, the Partnership does not expect that an award in this matter will have a material adverse impact on its consolidated results of operations or financial condition.
At times, our gas-utility subsidiaries acquire pipeline easements and other property rights by exercising rights of eminent domain provided under state law. As a result, the Partnership (or its subsidiaries) is a party to a number of lawsuits under which a court will determine the value of pipeline easements or other property interests obtained by the Partnership's gas utility subsidiaries by condemnation. Damage awards in these suits should reflect the value of the property interest acquired and the diminution in the value of the remaining property owned by the landowner. However, some
42
landowners have alleged unique damage theories to inflate their damage claims or assert valuation methodologies that could result in damage awards in excess of the amounts anticipated. Although it is not possible to predict the ultimate outcomes of these matters, the Partnership does not expect that awards in these matters will have a material adverse impact on its consolidated results of operations or financial condition.
The Partnership (or its subsidiaries) is defending a number of lawsuits filed by owners of property located near processing facilities or compression facilities constructed by the Partnership as part of its systems. The suits generally allege that the facilities create a private nuisance and have damaged the value of surrounding property. Claims of this nature have arisen as a result of the industrial development of natural gas gathering, processing and treating facilities in urban and occupied rural areas. Although it is not possible to predict the ultimate outcomes of these matters, the Partnership does not expect that awards in these matters will have a material adverse impact on its consolidated results of operations or financial condition.
Item 4. Mine Safety Disclosures
None.
Item 5. Market for Registrant's Common Equity, Related Unitholder Matters and Issuer Purchases of Equity Securities
Our common units are listed on The NASDAQ Global Select Market under the symbol "XTEX". On February 14, 2012, the closing market price for the common units was $16.73 per unit and there were approximately 16,285 record holders and beneficial owners (held in street name) of our common units. For equity compensation plan information, see discussion under "Item. 12 Security Ownership of Certain Beneficial Owners and Management and Related Unitholder Matters—Equity Compensation Plan Information."
The following table shows (i) the high and low closing sales prices per common unit, as reported by The NASDAQ Global Select Market, and (ii) the amount of our quarterly distributions for the periods indicated.
| |
Range | |
||||||||
|---|---|---|---|---|---|---|---|---|---|---|
| |
Cash Distribution Declared Per Unit(a) |
|||||||||
| |
High | Low | ||||||||
2011: |
||||||||||
Quarter Ended December 31 |
$ | 17.49 | $ | 15.13 | $ | 0.32 | ||||
Quarter Ended September 30 |
18.20 | 13.85 | 0.31 | |||||||
Quarter Ended June 30 |
19.76 | 16.33 | 0.31 | |||||||
Quarter Ended March 31 |
17.01 | 14.30 | 0.29 | |||||||
2010: |
||||||||||
Quarter Ended December 31 |
$ | 14.40 | $ | 12.82 | 0.26 | |||||
Quarter Ended September 30 |
13.22 | 10.17 | 0.25 | |||||||
Quarter Ended June 30 |
11.99 | 8.73 | — | |||||||
Quarter Ended March 31 |
11.44 | 8.90 | — | |||||||
43
Unless restricted by the terms of our credit facility, within 45 days after the end of each quarter, we will distribute all of our available cash, as defined in our partnership agreement, to unitholders of record on the applicable record date. Our available cash consists generally of all cash on hand at the end of the fiscal quarter, less reserves that our general partner determines are necessary to:
The indenture governing our senior unsecured notes provides the ability to pay distributions if a minimum fixed charged coverage ratio is met, and also provides baskets to make payments if such minimum is not met. However, we have established a target over the next couple of years of achieving a ratio of total debt to adjusted EBITDA of less than 4.0 to 1.0. Our ratio of debt to adjusted EBITDA was 3.92 to 1.0 for the year ended December 31, 2011. The distribution payments paid during 2011 are in compliance with our internal financial guidelines.
Our ability to distribute available cash is contractually restricted by the terms of our credit facility. Our credit facility contains covenants requiring us to maintain certain financial ratios. We are prohibited from making any distributions if the distribution would cause an event of default, or an event of default is existing, under our credit facility. Please read "Item 7. Management's Discussion and Analysis of Financial Condition and Results of Operation—Description of Indebtedness."
Our general partner has broad discretion to establish cash reserves that it determines are necessary or appropriate to properly conduct our business. These can include cash reserves for future capital and maintenance expenditures, reserves to stabilize distributions of cash to the unitholders and our general partner, reserves to reduce debt, or, as necessary, reserves to comply with the terms of any of our agreements or obligations. Our distributions are effectively made 98.0% to unitholders and two percent to our general partner, subject to the payment of incentive distributions to our general partner if certain target cash distribution levels to common unitholders are achieved. Incentive distributions to our general partner increase to 13.0%, 23.0% and 48.0% based on incremental distribution thresholds as set forth in our partnership agreement.
On January 19, 2010, we issued approximately $125.0 million of Series A Convertible Preferred Units to an affiliate of Blackstone/GSO Capital Solutions under exemption Section 4(2) of the Securities Act of 1933, as amended (the "Securities Act"). The 14,705,882 preferred units are convertible at any time into common units on a one-for-one basis, subject to certain adjustments in the event of certain dilutive issuances of common units. We have the right to force conversion of the preferred units after three years from the issuance date if (i) the daily volume-weighted average trading price of our common units is greater than 150% of the then-applicable conversion price for 20 out of the trailing 30 days ending on two trading days before the date on which we deliver notice of such conversion, and (ii) the average daily trading volume of common units must have exceeded 250,000 common units for 20 out of the trailing 30 trading days ending on two trading days before the date on which we deliver notice of such conversion. The preferred units are not redeemable but will pay a quarterly distribution that is the greater of $0.2125 per unit or the amount of the quarterly distribution per unit paid to common unitholders, subject to certain adjustments. Such quarterly distribution may be paid in cash, in additional preferred units issued in kind or any combination thereof, provided that the distribution may not be paid in additional preferred units if we pay a cash distribution on common units.
For a discussion regarding our issuance of our senior unsecured notes, please see "Item 7. Management's Discussion and Analysis of Financial Condition and Results of Operations—Indebtedness."
44
Item 6. Selected Financial Data
The following table sets forth selected historical financial and operating data of Crosstex Energy, L.P. as of and for the dates and periods indicated. The selected historical financial data are derived from the audited consolidated financial statements of Crosstex Energy, L.P. and should be read together with "Item 7. Management's Discussion and Analysis of Financial Condition and Results of Operations."
| |
Crosstex Energy, L.P. |
|||||||||||||||
|---|---|---|---|---|---|---|---|---|---|---|---|---|---|---|---|---|
| |
Years Ended December 31, | |||||||||||||||
| |
2011 | 2010 | 2009 | 2008 | 2007 | |||||||||||
| |
(In thousands, except per unit data) |
|||||||||||||||
Statement of Operations Data: |
||||||||||||||||
Revenues: |
||||||||||||||||
Midstream |
$ | 2,013,942 | $ | 1,792,676 | $ | 1,583,551 | $ | 3,558,213 | $ | 2,635,329 | ||||||
Operating costs and expenses: |
||||||||||||||||
Purchased gas and NGLs |
1,638,777 | 1,454,376 | 1,272,329 | 3,250,427 | 2,375,503 | |||||||||||
Operating expenses |
111,778 | 105,060 | 110,394 | 125,754 | 91,202 | |||||||||||
General and administrative |
52,801 | 48,414 | 59,854 | 68,864 | 59,493 | |||||||||||
(Gain) loss on sale of property |
264 | (13,881 | ) | (666 | ) | (947 | ) | (1,024 | ) | |||||||
(Gain) loss on derivatives |
7,776 | 9,100 | (2,994 | ) | (8,619 | ) | (4,147 | ) | ||||||||
Impairments |
— | 1,311 | 2,894 | 29,373 | — | |||||||||||
Depreciation and amortization |
125,284 | 111,551 | 119,088 | 107,521 | 83,315 | |||||||||||
Total operating costs and expenses |
1,936,680 | 1,715,931 | 1,560,899 | 3,572,373 | 2,604,342 | |||||||||||
Operating income (loss) |
77,262 | 76,745 | 22,652 | (14,160 | ) | 30,987 | ||||||||||
Other income (expense): |
||||||||||||||||
Interest expense, net |
(79,233 | ) | (87,035 | ) | (95,078 | ) | (74,971 | ) | (48,059 | ) | ||||||
Loss on extinguishment of debt |
— | (14,713 | ) | (4,669 | ) | — | — | |||||||||
Other income |
707 | 295 | 1,400 | 27,770 | 538 | |||||||||||
Total other income (expense) |
(78,526 | ) | (101,453 | ) | (98,347 | ) | (47,201 | ) | (47,521 | ) | ||||||
Loss from continuing operations before non-controlling interest and income taxes |
(1,264 | ) | (24,708 | ) | (75,695 | ) | (61,361 | ) | (16,534 | ) | ||||||
Income tax provision |
(1,126 | ) | (1,121 | ) | (1,790 | ) | (2,369 | ) | (760 | ) | ||||||
Loss from continuing operations, net of tax |
(2,390 | ) | (25,829 | ) | (77,485 | ) | (63,730 | ) | (17,294 | ) | ||||||
Income (loss) from discontinued operations, net of tax |
— | — | (1,796 | ) | 25,007 | 31,343 | ||||||||||
Gain from sale of discontinued operations, net of tax |
— | — | 183,747 | 49,805 | — | |||||||||||
Discontinued operations |
— | — | 181,951 | 74,812 | 31,343 | |||||||||||
Net income (loss) |
(2,390 | ) | (25,829 | ) | 104,466 | 11,082 | 14,049 | |||||||||
Less: Net income from continuing operations attributable to the non-controlling interest |
(48 | ) | 19 | 60 | 311 | 160 | ||||||||||
Net income (loss) attributable to Crosstex Energy, L.P. |
$ | (2,342 | ) | $ | (25,848 | ) | $ | 104,406 | $ | 10,771 | $ | 13,889 | ||||
45
| |
Crosstex Energy, L.P. |
|||||||||||||||
|---|---|---|---|---|---|---|---|---|---|---|---|---|---|---|---|---|
| |
Years Ended December 31, | |||||||||||||||
| |
2011 | 2010 | 2009 | 2008 | 2007 | |||||||||||
| |
(In thousands, except per unit data) |
|||||||||||||||
Preferred interest in net income attributable to Crosstex Energy, L.P. |
$ | 18,088 | $ | 13,750 | $ | — | $ | — | $ | — | ||||||
Beneficial conversion feature attributable to preferred units |
$ | — | $ | 22,279 | $ | — | $ | — | $ | — | ||||||
General partner interest in net income (loss) |
$ | (732 | ) | $ | (4,371 | ) | $ | (819 | ) | $ | 26,415 | $ | 19,252 | |||
Limited partners' interest in net income (loss) attributable to Crosstex Energy, L.P. |
$ | (19,698 | ) | $ | (57,506 | ) | $ | 105,225 | $ | (15,644 | ) | $ | (5,363 | ) | ||
Income (loss) per unit from continuing operations: |
||||||||||||||||
Basic and diluted common unit |
$ | (0.38 | ) | $ | (1.12 | ) | $ | (2.18 | ) | $ | (4.90 | ) | $ | (1.33 | ) | |
Senior subordinated unit |
$ | — | $ | — | $ | 8.85 | $ | 9.44 | $ | — | ||||||
Distributions declared per limited partner unit(1) |
$ | 1.23 | $ | 0.51 | $ | — | $ | 2.00 | $ | 2.33 | ||||||
Balance Sheet Data (end of period): |
||||||||||||||||
Working capital deficit |
$ | (22,596 | ) | $ | (17,640 | ) | $ | (50,320 | ) | $ | (32,910 | ) | $ | (46,888 | ) | |
Property and equipment, net |
1,241,901 | 1,215,104 | 1,279,060 | 1,527,280 | 1,425,162 | |||||||||||
Total assets |
1,955,331 | 1,984,940 | 2,069,181 | 2,533,266 | 2,592,874 | |||||||||||
Long-term debt (including current maturities) |
798,409 | 718,570 | 873,702 | 1,263,706 | 1,223,118 | |||||||||||
Capital lease obligations (including current maturities) |
28,367 | 31,327 | 23,799 | 27,896 | 3,988 | |||||||||||
Partners' equity including non- controlling interest |
900,459 | 976,936 | 893,282 | 797,931 | 788,641 | |||||||||||
Cash Flow Data: |
||||||||||||||||
Net cash flow provided by (used in): |
||||||||||||||||
Operating activities |
$ | 143,572 | $ | 87,187 | $ | 80,978 | $ | 173,750 | $ | 114,818 | ||||||
Investing activities |
(132,094 | ) | 14,638 | 379,874 | (186,810 | ) | (411,382 | ) | ||||||||
Financing activities |
(5,032 | ) | (84,907 | ) | (461,709 | ) | 14,554 | 295,882 | ||||||||
Non-GAAP Financial Measures: |
||||||||||||||||
Gross operating margin(3) |
$ | 375,165 | $ | 338,300 | $ | 311,222 | $ | 307,786 | $ | 259,826 | ||||||
Adjusted EBITDA from continuing operations(4) |
$ | 214,028 | $ | 186,880 | $ | 158,682 | $ | 163,394 | $ | 126,944 | ||||||
Operating Data: |
||||||||||||||||
Pipeline throughput (MMBtu/d) |
2,037,000 | 1,971,000 | 2,040,000 | 2,002,000 | 1,555,000 | |||||||||||
Natural gas processed (MMBtu/d) |
1,325,000 | 1,366,000 | 1,235,000 | 1,608,000 | 1,835,000 | |||||||||||
Commercial services (MMBtu/d) |
92,000 | 69,000 | 75,000 | 85,000 | 94,000 | |||||||||||
NGL Fractionation (Gals/d) |
1,109,000 | 922,000 | 686,000 | 956,000 | 980,000 | |||||||||||
46
Non-GAAP Financial Measures
We include the following non-GAAP financial measures: our adjusted EBITDA from continuing operations and gross operating margin. We provide reconciliations of these non-GAAP financial measures to their most directly comparable financial measures as calculated and presented in accordance with generally accepted accounting principles, or GAAP.
We define adjusted EBITDA from continuing operations as net income plus interest expense, provision for income taxes and depreciation and amortization expense, impairments, stock-based compensation, loss on extinguishment of debt, (gain) loss on noncash derivatives, transaction costs associated with successful transactions, minority interest; certain severance and exit expenses; and accrued legal judgment under appeal; less (income) loss from discontinued operations and gain on sale of assets related to discontinued operations. Our adjusted EBITDA from continuing operations is used as a supplemental performance measure by our management and by external users of our financial statements such as investors, commercial banks, research analysts and others, to assess:
Our adjusted EBITDA from continuing operations is one of the critical inputs into the financial covenants within our credit facility. The rates we pay for borrowings under our credit facility are determined by the ratio of our debt to adjusted EBITDA. The calculation of these ratios allows for further adjustments to adjusted EBITDA for recent acquisitions and dispositions.
Our adjusted EBITDA from continuing operations should not be considered an alternative to, or more meaningful than, net income, operating income, cash flows from operating activities or any other measure of financial performance presented in accordance with GAAP. Our adjusted EBITDA from continuing operations may not be comparable to similarly titled measures of other companies because other entities may not calculate adjusted EBITDA from continuing operations in the same manner.
Adjusted EBITDA from continuing operations does not include interest expense, income taxes or depreciation and amortization expense. Because we have borrowed money to finance our operations, interest expense is a necessary element of our costs and our ability to generate cash available for distribution. Because we use capital assets, depreciation and amortization are also necessary elements of our costs. Therefore, any measures that exclude these elements have material limitations. To
47
compensate for these limitations, we believe that it is important to consider both net earnings determined under GAAP, as well as adjusted EBITDA, to evaluate our overall performance.
The following table provides a reconciliation of adjusted EBITDA to net income (loss):
| |
Years Ended December 31, | |||||||||||||||
|---|---|---|---|---|---|---|---|---|---|---|---|---|---|---|---|---|
| |
2011 | 2010 | 2009 | 2008 | 2007 | |||||||||||
| |
(In thousands) |
|||||||||||||||
Net income (loss) |
$ | (2,342 | ) | $ | (25,848 | ) | $ | 104,406 | $ | 10,771 | $ | 13,889 | ||||
Interest expense |
79,233 | 87,035 | 95,078 | 74,971 | 48,059 | |||||||||||
Depreciation and amortization |
125,284 | 111,551 | 119,088 | 107,521 | 83,315 | |||||||||||
Impairment |
— | 1,311 | 2,894 | 29,373 | — | |||||||||||
Loss on extinguishment of debt |
— | 14,713 | 4,669 | — | — | |||||||||||
(Gain) loss on sale of property |
264 | (13,881 | ) | (666 | ) | (947 | ) | (1,024 | ) | |||||||
Stock-based compensation |
7,308 | 9,276 | 8,742 | 11,243 | 12,283 | |||||||||||
(Income) loss from discontinued opertations, net of tax |
— | — | 1,796 | (25,007 | ) | (31,343 | ) | |||||||||
Gain on sale of discontinued operations, net of tax |
— | — | (183,747 | ) | (49,805 | ) | — | |||||||||
Other(a) |
4,281 | 2,723 | 6,422 | 5,274 | 1,765 | |||||||||||
Adjusted EBITDA from continuing operations |
$ | 214,028 | $ | 186,880 | $ | 158,682 | $ | 163,394 | $ | 126,944 | ||||||
We define gross operating margin as revenues minus cost of purchased gas and NGLs. We present gross operating margin by segment in "Item 7. Management's Discussion and Analysis of Financial Condition and Results of Operations—Results of Operations." We disclose gross operating margin in addition to total revenue because it is the primary performance measure used by our management. We believe gross operating margin is an important measure because our business is generally to purchase and resell natural gas for a margin or to gather, process, transport or market natural gas and NGLs for a fee. Operation and maintenance expense is a separate measure used by management to evaluate operating performance of field operations. Direct labor and supervision, property insurance, property taxes, repair and maintenance, utilities and contract services comprise the most significant portion of our operation and maintenance expenses. These expenses are largely independent of the volumes we transport or process and fluctuate depending on the activities performed during a specific period. We do not deduct operation and maintenance expenses from total revenue in calculating gross operating margin because we separately evaluate commodity volume and price changes in these margin amounts. As an indicator of our operating performance, gross operating margin should not be considered an alternative to, or more meaningful than, net income as determined in accordance with GAAP. Our gross operating margin may not be comparable to similarly titled measures of other companies because other entities may not calculate these amounts in the same manner.
48
The following table provides a reconciliation of gross operating margin to operating income (loss):
| |
Years Ended December 31, | |||||||||||||||
|---|---|---|---|---|---|---|---|---|---|---|---|---|---|---|---|---|
| |
2011 | 2010 | 2009 | 2008 | 2007 | |||||||||||
| |
(In thousands) |
|||||||||||||||
Total gross operating margin |
$ | 375,165 | $ | 338,300 | $ | 311,222 | $ | 307,786 | $ | 259,826 | ||||||
Add (deduct): |
||||||||||||||||
Operating expenses |
(111,778 | ) | (105,060 | ) | (110,394 | ) | (125,754 | ) | (91,202 | ) | ||||||
General and administrative expenses |
(52,801 | ) | (48,414 | ) | (59,854 | ) | (68,864 | ) | (59,493 | ) | ||||||
Gain (loss) on sale of property |
(264 | ) | 13,881 | 666 | 947 | 1,024 | ||||||||||
Gain (loss) on derivatives |
(7,776 | ) | (9,100 | ) | 2,994 | 8,619 | 4,147 | |||||||||
Depreciation, amortization and impairments |
(125,284 | ) | (112,862 | ) | (121,982 | ) | (136,894 | ) | (83,315 | ) | ||||||
Operating income (loss) |
$ | 77,262 | $ | 76,745 | $ | 22,652 | $ | (14,160 | ) | $ | 30,987 | |||||
49
Item 7. Management's Discussion and Analysis of Financial Condition and Results of Operations
You should read the following discussion of our financial condition and results of operations in conjunction with the financial statements and notes thereto included elsewhere in this report. For more detailed information regarding the basis of presentation for the following information, you should read the notes to the financial statements included in this report.
Overview
We are a Delaware limited partnership formed on July 12, 2002 to indirectly acquire substantially all of the assets, liabilities and operations of our predecessor, Crosstex Energy Services, Ltd. Our primary focus is on the gathering, processing, transmission and marketing of natural gas and NGLs, which we manage as regional reporting segments of midstream activity. We recently added crude oil terminal facilities in south Louisiana to provide access for crude oil producers to the premium markets in this area. Our regional reporting segments include North Texas Barnett shale (NTX) and Louisiana which has two reportable business segments (the LIG and the south Louisiana processing and NGL assets, or PNGL). During 2011, we gained a presence in the Permian Basin in west Texas through a joint project with Apache Corporation and also gained access in the Eagle Ford Shale in south Texas by our equity investment in Howard Energy Partners (HEP).
We manage our operations by focusing on gross operating margin because our business is generally to purchase and resell natural gas for a margin, or to gather, process, transport or market natural gas and NGLs for a fee. We define gross operating margin as operating revenue minus cost of purchased gas and NGLs.
Our gross operating margins are determined primarily by the volumes of natural gas gathered, transported, purchased and sold through our pipeline systems, processed at our processing facilities, and the volumes of NGLs handled at our fractionation facilities. We generate revenues from four primary sources:
We generally gather or transport gas owned by others through our facilities for a fee, or we buy natural gas from a producer, plant or shipper at either a fixed discount to a market index or a percentage of the market index, then transport and resell the natural gas at the market index. We attempt to execute all purchases and sales substantially concurrently, or we enter into a future delivery obligation, thereby establishing the basis for the margin we will receive for each natural gas transaction. Our gathering and transportation margins related to a percentage of the index price can be adversely affected by declines in the price of natural gas. We are also party to certain long-term gas sales commitments that we satisfy through supplies purchased under long-term gas purchase agreements. When we enter into those arrangements, our sales obligations generally match our purchase obligations. However, over time the supplies that we have under contract may decline due to reduced drilling or other causes and we may be required to satisfy the sales obligations by buying additional gas at prices that may exceed the prices received under the sales commitments. In our purchase/sale transactions, the resale price is generally based on the same index at which the gas was purchased. However, on occasion we have entered into certain purchase/sale transactions in which the purchase price is based on a production-area index and the sales price is based on a market-area index, and we capture the difference in the indices (also referred to as basis spread), less the transportation expenses from the two areas, as our margin. Changes in the basis spread can increase or decrease our margins.
50
One contract (the "Delivery Contract") has a term to 2019 that obligates us to supply approximately 150,000 MMBtu/d of gas. At the time that we entered into the Delivery Contract in 2008, we had dedicated supply sources in the Barnett Shale that exceeded the delivery obligations under the Delivery Contract. Our agreements with these suppliers generally provided that the purchase price for the gas was equal to a portion of our sales price for such gas less certain fees and costs. Accordingly, we were initially able to generate a positive margin under the Delivery Contract. However, since entering into the Delivery Contract, there has been both (1) a reduction in the gas available under our supply contracts and (2) the discovery of other shale reserves, most notably the Haynesville and the Marcellus Shales, which has increased the supplies available to East Coast markets and reduced the basis spread between north Texas-area production and the market indices used in the Delivery Contract. Due to these factors, we have had to purchase a portion of the gas to fulfill our obligations under the Delivery Contract at market prices, resulting in negative margins under the Delivery Contract.
We have recorded a loss of approximately $13.3 million during the year ended December 31, 2011 on the Delivery Contract. We currently expect that we will record a loss of approximately $13.0 million to $17.0 million on the Delivery Contract for the year ending December 31, 2012. This estimate is based on forward prices, basis spreads and other market assumptions as of year end 2011. These assumptions are subject to change if market conditions change during 2012, and actual results under the Delivery Contract in 2012 could be substantially different from year end 2011 estimates, which may result in a greater loss than currently estimated.
We also realize gross operating margins from our processing services primarily through three different contract arrangements: processing margins (margin), percentage of liquids (POL) or fixed-fee based. Under margin contract arrangements our margins are higher during periods of high liquid prices relative to natural gas prices. Gross operating margin results under POL contracts are impacted only by the value of the liquids produced with margins higher during periods of relatively high liquids prices. Under fixed-fee based contracts our margins are driven by throughput volume. See "—Commodity Price Risk."
Operating expenses are costs directly associated with the operations of a particular asset. Among the most significant of these costs are those associated with direct labor and supervision, property insurance, property taxes, repair and maintenance expenses, contract services and utilities. These costs are normally fairly stable across broad volume ranges, and therefore do not normally decrease or increase significantly in the short term with decreases or increases in the volume of gas moved through the asset.
Our general and administrative expenses are dictated by the terms of our partnership agreement. These expenses include the costs of employee, officer and director compensation and benefits properly allocable to us, and all other expenses necessary or appropriate to the conduct of business and allocable to us. Our partnership agreement provides that our general partner determines the expenses that are allocable to us in any reasonable manner determined by our general partner in its sole discretion.
Business Strategy
Our business strategy consists of three overarching objectives which are to maximize earnings and growth of our existing businesses, to enhance the scale and diversification of our assets and to continue our focus on operational excellence. We believe we were successful in executing our business strategy during 2011, and we will continue to pursue these objectives in 2012.
51
Commodity Price Risk
We are subject to significant risks due to fluctuations in commodity prices. Our exposure to these risks is primarily in the gas processing component of our business. For the year ended December 31, 2011, approximately 10.7% of our processed gas arrangements, based on gross operating margin, was processed under percent of liquids (POL) contracts. A significant volume of inlet gas at our south Louisiana and north Texas processing plants is settled under POL agreements. Under these contracts we receive a fee in the form of a percentage of the liquids recovered and the producer bears all the costs of the natural gas volumes lost ("shrink"). Accordingly, our revenues under these contracts are directly impacted by the market price of NGLs.
We also realize processing gross margins under processing margin (margin) contracts and spot purchases. For the year ended December 31, 2011, approximately 19.3% of our processed gas arrangements, based on gross operating margin, was processed under margin contracts and spot purchases. We have a number of margin contracts on our Plaquemine, Gibson, Eunice, Bluewater, and Pelican processing plants. Under this type of contract, we pay the producer for the full amount of inlet gas to the plant and we make a margin based on the difference between the value of liquids recovered from the processed natural gas as compared to the value of the natural gas shrink and the cost of fuel used in processing. The shrink and fuel losses are referred to as plant thermal reduction or PTR. Our margins from these contracts can be negative during periods of high natural gas prices relative to liquids prices.
We are also indirectly exposed to commodity prices due to the negative impacts on production and the development of production of natural gas and NGLs connected to or near our assets and on our margins for transportation between certain market centers. Low prices for these products will reduce the demand for our services and volumes on our systems.
In the past, the prices of natural gas and NGLs have been extremely volatile and we expect this volatility to continue. For example, prices of natural gas in 2011 were below the market price realized throughout most of 2010 while prices for oil and NGLs were higher than 2010 market prices. Crude oil prices (based on the New York Mercantile Exchange (the "NYMEX") futures daily close prices for the prompt month) in 2011 ranged from a low of $75.67 per Bbl in October 2011 to a high of $113.93 per Bbl in April 2011. Weighted average NGL prices in 2011 (based on the Oil Price Information Service (OPIS) Napoleonville daily average spot liquids prices) ranged from a low of $0.99 per gallon in February 2011 to a high of $1.35 per gallon in May 2011. Natural gas prices (based on Gas Daily Henry Hub closing prices) during 2011 ranged from a high of $4.92 per MMBtu in June 2011 to a low of $2.79 per MMBtu in November 2011.
Changes in commodity prices may also indirectly impact our profitability by influencing drilling activity and well operations, and thus the volume of gas we gather and process. The volatility in commodity prices may cause our gross operating margin and cash flows to vary widely from period to period. Our hedging strategies may not be sufficient to offset price volatility risk and, in any event, do not cover all of our throughput volumes. For a discussion of our risk management activities, please read "Item 7A. Quantitative and Qualitative Disclosures about Market Risk."
52
Results of Operations
Set forth in the table below is certain financial and operating data for the periods indicated, which excludes financial and operating data deemed discontinued operations. We manage our operations by focusing on gross operating margin which we define as operating revenue minus cost of purchased gas and NGLs as reflected in the table below.
| |
Years Ended December 31, | |||||||||
|---|---|---|---|---|---|---|---|---|---|---|
| |
2011 | 2010 | 2009 | |||||||
| |
(Dollars in millions) |
|||||||||
LIG Segment |
||||||||||
Revenues |
$ | 939.3 | $ | 963.0 | $ | 893.8 | ||||
Purchased gas and NGLs |
(809.5 | ) | (845.6 | ) | (793.0 | ) | ||||
Total gross operating margin |
$ | 129.8 | $ | 117.4 | $ | 100.8 | ||||
NTX Segment |
||||||||||
Revenues |
$ | 432.6 | $ | 399.5 | $ | 509.4 | ||||
Purchased gas and NGLs |
(262.7 | ) | (240.1 | ) | (352.8 | ) | ||||
Total gross operating margin |
$ | 169.9 | $ | 159.4 | $ | 156.6 | ||||
PNGL Segment |
||||||||||
Revenues |
$ | 910.9 | $ | 602.6 | $ | 297.9 | ||||
Purchased gas and NGLs |
(835.4 | ) | (541.1 | ) | (250.1 | ) | ||||
Total gross operating margin |
$ | 75.5 | $ | 61.5 | $ | 47.8 | ||||
Corporate |
||||||||||
Revenues |
$ | (268.9 | ) | $ | (172.4 | ) | $ | (117.6 | ) | |
Purchased gas and NGLs |
268.9 | 172.4 | 123.6 | |||||||
Total gross operating margin |
$ | — | $ | — | $ | 6.0 | ||||
Total |
||||||||||
Revenues |
$ | 2,013.9 | $ | 1,792.7 | $ | 1,583.5 | ||||
Purchased gas and NGLs |
(1,638.7 | ) | (1,454.4 | ) | (1,272.3 | ) | ||||
Total gross operating margin |
$ | 375.2 | $ | 338.3 | $ | 311.2 | ||||
Midstream Volumes: |
||||||||||
LIG |
||||||||||
Gathering and Transportation (MMBtu/d) |
912,000 | 902,000 | 900,000 | |||||||
Processing (MMBtu/d) |
247,000 | 283,000 | 269,000 | |||||||
NTX |
||||||||||
Gathering and Transportation (MMBtu/d) |
1,125,000 | 1,069,000 | 1,111,000 | |||||||
Processing (MMBtu/d) |
249,000 | 209,000 | 219,000 | |||||||
PNGL |
||||||||||
Processing (MMBtu/d) |
829,000 | 874,000 | 747,000 | |||||||
NGL Fractionation (Gals/d) |
1,109,000 | 922,000 | 686,000 | |||||||
Commercial Services (MMBtu/d) |
92,000 | 69,000 | 75,000 | |||||||
Corporate |
||||||||||
Gathering and Transportation (MMBtu/d) |
— | — | 29,000 | |||||||
Year ended December 31, 2011 Compared to Year ended December 31, 2010
Gross Operating Margin. Gross operating margin was $375.2 million for the year ended December 31, 2011 compared to $338.3 million for the year ended December 31, 2010, an increase of $36.9 million, or 10.9%. The increase was due to increased throughput on our gathering and
53
transmission systems, as well as favorable NGL markets throughout the year. The following provides additional details regarding this change in gross operating margin:
Operating Expenses. Operating expenses were $111.8 million for the year ended December 31, 2011 compared to $105.1 million for the year ended December 31, 2010, an increase of $6.7 million, or 6.4%. The increase is primarily the result of the following:
General and Administrative Expenses. General and administrative expenses were $52.8 million for the year ended December 31, 2011 compared to $48.4 million for the year ended December 31, 2010, an increase of $4.4 million, or 9.1%. The increase is primarily a result of the following:
54
Gain/Loss on Sale of Property. Loss on sale of property was $0.3 million for the year ended December 31, 2011 compared to a gain of $13.9 million for the year ended December 31, 2010. The loss on sale of property for the year ended December 31, 2011 was primarily related to the sale of a minor section of pipeline in Louisiana in September 2011. The gain on sale of property for the year ended December 31, 2010 was related to the sale of our east Texas assets in January 2010.
Gain/Loss on Derivatives. Loss on derivatives was $7.8 million for the year ended December 31, 2011 compared to a loss of $9.1 million for the year ended December 31, 2010. The derivative transaction types contributing to the net (gain) loss are as follows (in millions):
| |
Years Ended December 31, | ||||||||||||
|---|---|---|---|---|---|---|---|---|---|---|---|---|---|
| |
2011 | 2010 | |||||||||||
(Gain) Loss on Derivatives:
|
Total | Realized | Total | Realized | |||||||||
Basis swaps |
$ | 1.4 | $ | 1.3 | $ | 5.6 | $ | 2.3 | |||||
Processing margin hedges |
6.6 | 5.7 | 3.5 | 5.5 | |||||||||
Other |
(0.2 | ) | — | — | 0.1 | ||||||||
Net loss on derivatives |
$ | 7.8 | $ | 7.0 | $ | 9.1 | $ | 7.9 | |||||
Impairments. During 2010, impairments totaling $1.3 million were taken on excess pipe that was ultimately sold later during 2010. No impairments were recorded in 2011.
Depreciation and Amortization. Depreciation and amortization expenses were $125.3 million for the year ended December 31, 2011 compared to $111.6 million for the year ended December 31, 2010, an increase of $13.7 million, or 12.3%. The increase of $13.7 million includes $13.4 million due to intangible amortization related to a downward revision in future estimated throughput volumes attributable to the dedicated acreage purchased with our gathering system in north Texas. In addition, depreciation increased $0.3 million primarily due to an increase of assets placed in service in our north Texas and LIG regions.
Interest Expense. Interest expense was $79.2 million for the year ended December 31, 2011 compared to $87.0 million for the year ended December 31, 2010, a decrease of $7.8 million, or 9.0%. Net interest expense consists of the following (in millions):
| |
Years Ended December 31, |
||||||
|---|---|---|---|---|---|---|---|
| |
2011 | 2010 | |||||
Senior notes (secured and unsecured) |
$ | 64.3 | $ | 62.5 | |||
Paid-in-kind interest on senior secured notes |
— | 1.4 | |||||
Bank credit facility |
5.5 | 10.0 | |||||
Series B secured notes |
— | 1.1 | |||||
Capitalized interest |
(0.9 | ) | (0.1 | ) | |||
Mark to market interest rate swaps |
— | (22.4 | ) | ||||
Realized interest rate swap losses |
— | 26.5 | |||||
Amortization of debt issue costs |
8.3 | 6.6 | |||||
Other |
2.0 | 1.4 | |||||
Total |
$ | 79.2 | $ | 87.0 | |||
55
Loss on Extinguishment of Debt. Loss on extinguishment of debt was $14.7 million during the year ended December 31, 2010. In February 2010, we repaid our prior credit facility and senior secured notes which resulted in make-whole interest payments on our senior secured notes and the write-off of unamortized debt costs totaling $14.7 million.
Year ended December 31, 2010 Compared to Year ended December 31, 2009
Gross Operating Margin. Gross operating margin was $338.3 million for the year ended December 31, 2010 compared to $311.2 million for the year ended December 31, 2009, an increase of $27.1 million, or 8.7%. The increase was primarily due to higher margins on our gathering and transmission throughput volume, as well as a favorable NGL market throughout the year. The following provides additional details regarding this change in gross operating margin:
Operating Expenses. Operating expenses were $105.1 million for the year ended December 31, 2010 compared to $110.4 million for the year ended December 31, 2009, a decrease of $5.3 million, or 4.8%. The decrease is primarily the result of the following:
56
General and Administrative Expenses. General and administrative expenses were $48.4 million for the year ended December 31, 2010 compared to $59.9 million for the year ended December 31, 2009, a decrease of $11.5 million, or 19.2%. The decrease is primarily a result of the following:
Gain on sale of Property from Continuing Operations. Gains on sale of property were $13.9 million for the year ended December 31, 2010 compared to $0.7 million for the year ended December 31, 2009. The gain on sale of property for the year ended December 31, 2010 was related to the sale of our east Texas assets in January 2010.
Gain/Loss on Derivatives. Loss on derivatives was $9.1 million for the year ended December 31, 2010 compared to a gain of $3.0 million for the year ended December 31, 2009. The derivative transaction types contributing to the net (gain) loss are as follows (in millions):
| |
Years Ended December 31, | ||||||||||||
|---|---|---|---|---|---|---|---|---|---|---|---|---|---|
| |
2010 | 2009 | |||||||||||
(Gain) Loss on Derivatives:
|
Total | Realized | Total | Realized | |||||||||
Basis swaps |
$ | 5.6 | $ | 2.3 | $ | (4.4 | ) | $ | (2.5 | ) | |||
Processing margin hedges |
3.5 | 5.5 | 1.4 | (2.2 | ) | ||||||||
Other |
— | 0.1 | (0.3 | ) | (1.4 | ) | |||||||
|
$ | 9.1 | $ | 7.9 | $ | (3.3 | ) | $ | (6.1 | ) | |||
Derivative losses included in income from discontinued operations |
— | — | 0.3 | 0.5 | |||||||||
Net (gain) loss from continuing operations |
$ | 9.1 | $ | 7.9 | $ | (3.0 | ) | $ | (5.6 | ) | |||
Impairments. Impairment expense was $1.3 million during the year ended December 31, 2010, compared to $2.9 million for the year ended December 31, 2009. During 2009, impairments totaling $2.9 million were taken on the Bear Creek processing plant and the Vermillion treating plant to bring the fair value of the plants to a marketable value for these idle assets, which were subsequently sold. During 2010, impairments totaling $1.3 million were taken on excess pipe that was ultimately sold later during 2010.
Depreciation and Amortization. Depreciation and amortization expenses were $111.6 million for the year ended December 31, 2010 compared to $119.1 million for the year ended December 31, 2009, a decrease of $7.5 million, or 6.3%. The decrease of $7.5 million was the result of an increase in estimated depreciable lives for certain of our processing plants based on 2009 depreciation study that resulted in a depreciation expense decrease of $9.1 million partially offset by $1.6 million increase in depreciation on the Eunice natural gas processing plants and fractionation facility purchased during fourth quarter 2009.
57
Interest Expense. Interest expense was $87.0 million for the year ended December 31, 2010 compared to $95.1 million for the year ended December 31, 2009, a decrease of $8.0 million, or 8.5%. Net interest expense consists of the following (in millions):
| |
Years Ended December 31, |
||||||
|---|---|---|---|---|---|---|---|
| |
2010 | 2009 | |||||
Senior notes (secured and unsecured) |
$ | 62.5 | $ | 28.8 | |||
Paid-in-kind interest on senior secured notes |
1.4 | 4.9 | |||||
Bank credit facility |
10.0 | 35.4 | |||||
Series B secured notes |
1.1 | 0.4 | |||||
Capitalized interest |
(0.1 | ) | (1.1 | ) | |||
Mark to market interest rate swaps |
(22.4 | ) | (0.8 | ) | |||
Realized interest rate swap losses |
26.5 | 19.0 | |||||
Interest income |
— | (0.2 | ) | ||||
Amortization of debt issue costs |
6.6 | 7.6 | |||||
Other |
1.4 | 1.1 | |||||
Total |
$ | 87.0 | $ | 95.1 | |||
Loss on Extinguishment of Debt. Loss on extinguishment of debt was $14.7 million for year ended December 31, 2010 as compared to $4.7 million in 2009. In February 2010, we repaid our prior credit facility and senior secured notes which resulted in make-whole interest payments on our senior secured notes and the write-off of unamortized debt costs totaling $14.7 million. The loss of $4.7 million on extinguishment of debt incurred in the year ended December 31, 2009 related to the amendment of our prior credit facility and the senior secured notes in February 2009.
Income Taxes. Income tax expense was $1.1 million for the year ended December 31, 2010 compared to $1.8 million for the year ended December 31, 2009, a decrease of $0.7 million. The decrease primarily relates to the impact of the Texas margin tax on our Texas operations.
Discontinued Operations. During 2009, we sold non-strategic assets and used the proceeds from such sales to repay long-term indebtedness.
Assets
|
Date of Sale | |
|---|---|---|
Oklahoma assets (Arkoma system) |
February 2009 | |
Alabama, Mississippi and south Texas assets |
August 2009 | |
Treating assets |
October 2009 |
In accordance with FASB ASC 360-10-05-4, the results of operations related to these assets (except the Oklahoma assets, which were immaterial to the financial statement presentations) are presented in income from discontinued operations for the comparative periods in the statements of operations. Revenues, operating expenses, general and administrative expenses associated directly to the assets sold, depreciation and amortization, allocated Texas margin tax and allocated interest are reflected in
58
the income from discontinued operations. Following are the components of revenues and earnings from discontinued operations and operating data (dollars in millions):
| |
Years Ended December 31, 2009 |
|||
|---|---|---|---|---|
Midstream revenues |
$ | 327.2 | ||
Treating revenues |
$ | 45.5 | ||
Income from discontinued operations, net of tax |
$ | (1.8 | ) | |
Gain from sale of discontinued operations, net of tax |
$ | 183.7 | ||
Gathering and Transmission Volumes (MMBtu/d) |
564,000 | |||
Processing Volumes (MMBtu/d) |
191,000 | |||
Critical Accounting Policies
The selection and application of accounting policies is an important process that has developed as our business activities have evolved and as the accounting rules have developed. Accounting rules generally do not involve a selection among alternatives, but involve an implementation and interpretation of existing rules, and the use of judgment to the specific set of circumstances existing in our business. Compliance with the rules necessarily involves reducing a number of very subjective judgments to a quantifiable accounting entry or valuation. We make every effort to properly comply with all applicable rules on or before their adoption, and we believe the proper implementation and consistent application of the accounting rules is critical. Our critical accounting policies are discussed below. See Note 2 of the Notes to Consolidated Financial Statements for further details on our accounting policies.
Revenue Recognition and Commodity Risk Management. We recognize revenue for sales or services at the time the natural gas or NGLs are delivered or at the time the service is performed. We generally accrue one month of sales and the related gas purchases and reverse these accruals when the sales and purchases are actually invoiced and recorded in the subsequent months. Actual results could differ from the accrual estimates.
We utilize extensive estimation procedures to determine the sales and cost of gas purchase accruals for each accounting cycle. Accruals are based on estimates of volumes flowing each month from a variety of sources. We use actual measurement data, if it is available, and will use such data as producer/shipper nominations, prior month average daily flows, estimated flow for new production and estimated end-user requirements (all adjusted for the estimated impact of weather patterns) when actual measurement data is not available. Throughout the month or two following production, actual measured sales and transportation volumes are received and invoiced and used in a process referred to as "actualization". Through the actualization process, any estimation differences recorded through the accrual are reflected in the subsequent month's accounting cycle when the accrual is reversed and actual amounts are recorded. Actual volumes purchased, processed or sold may differ from the estimates due to a variety of factors including, but not limited to: actual wellhead production or customer requirements being higher or lower than the amount nominated at the beginning of the month; liquids recoveries being higher or lower than estimated because gas processed through the plants was richer or leaner than estimated; the estimated impact of weather patterns being different from the actual impact on sales and purchases; and pipeline maintenance or allocation causing actual deliveries of gas to be different than estimated. We believe that our accrual process for sales and purchases provides a reasonable estimate of such sales and purchases.
We engage in price risk management activities in order to minimize the risk from market fluctuations in the price of natural gas and NGLs. We also manage our price risk related to future physical purchase or sale commitments by entering into either corresponding physical delivery contracts
59
or financial instruments with an objective to balance our future commitments and significantly reduce our risk to the movement in natural gas and NGL prices.
We use derivatives to hedge against changes in cash flows related to product prices, as opposed to their use for trading purposes. FASB ASC 815 requires that all derivatives and hedging instruments are recognized as assets or liabilities at fair value. If a derivative qualifies for hedge accounting, changes in the fair value can be offset against the change in the fair value of the hedged item through earnings or recognized in other comprehensive income until such time as the hedged item is recognized in earnings.
We conduct "off-system" gas marketing operations as a service to producers on systems that we do not own. We refer to these activities as part of energy trading activities. In some cases, we earn an agency fee from the producer for arranging the marketing of the producer's natural gas. In other cases, we purchase the natural gas from the producer and enter into a sales contract with another party to sell the natural gas. The revenue and cost of sales for these activities are included in revenue on a net basis in the statement of operations.
We manage our price risk related to future physical purchase or sale commitments for energy trading activities by entering into either corresponding physical delivery contracts or financial instruments with an objective to balance future commitments and significantly reduce risk related to the movement in natural gas prices. However, we are subject to counter-party risk for both the physical and financial contracts. Our energy trading contracts qualify as derivatives, and we use mark-to-market accounting for both physical and financial contracts of the energy trading business. Accordingly, any gain or loss associated with changes in the fair value of derivatives and physical delivery contracts relating to energy trading activities are recognized in earnings as gain or loss on derivatives immediately.
Impairment of Long-Lived Assets. In accordance with FASB ASC 360-10-05, we evaluate the long-lived assets, including related intangibles, of identifiable business activities for impairment when events or changes in circumstances indicate, in management's judgment, that the carrying value of such assets may not be recoverable. The determination of whether impairment has occurred is based on management's estimate of undiscounted future cash flows attributable to the assets as compared to the carrying value of the assets. If impairment has occurred, the amount of the impairment recognized is determined by estimating the fair value for the assets and recording a provision for loss if the carrying value is greater than fair value.
When determining whether impairment of one of our long-lived assets has occurred, we must estimate the undiscounted cash flows attributable to the asset. Our estimate of cash flows is based on assumptions regarding the purchase and resale margins on natural gas, volume of gas available to the asset, markets available to the asset, operating expenses, and future natural gas prices and NGL product prices. The amount of availability of gas to an asset is sometimes based on assumptions regarding future drilling activity, which may be dependent in part on natural gas prices. Projections of gas volumes and future commodity prices are inherently subjective and contingent upon a number of variable factors, including but not limited to:
60
Any significant variance in any of the above assumptions or factors could materially affect our cash flows, which could require us to record an impairment of an asset.
Depreciation Expense and Cost Capitalization. Our assets consist primarily of natural gas gathering pipelines, processing plants, and transmission pipelines. We capitalize all construction-related direct labor and material costs, as well as indirect construction costs. Indirect construction costs include general engineering and the costs of funds used in construction. Capitalized interest represents the cost of funds used to finance the construction of new facilities and is expensed over the life of the constructed assets through the recording of depreciation expense. We capitalize the costs of renewals and betterments that extend the useful life, while we expense the costs of repairs, replacements and maintenance projects as incurred.
We generally compute depreciation using the straight-line method over the estimated useful life of the assets. Certain assets such as land, NGL line pack and natural gas line pack are non-depreciable. The computation of depreciation expense requires judgment regarding the estimated useful lives and salvage value of assets. As circumstances warrant, we may review depreciation estimates to determine if any changes are needed. Such changes could involve an increase or decrease in estimated useful lives or salvage values, which would impact future depreciation expense.
Liquidity and Capital Resources
Cash flow presented in the liquidity discussions below includes cash flow from discontinued operations for the year ended December 31, 2009.
Cash Flows from Operating Activities. Net cash provided by operating activities was $143.6 million, $87.2 million and $81.0 million for the years ended December 31, 2011, 2010 and 2009, respectively. Income before non-cash income and expenses and changes in working capital for 2011, 2010 and 2009 were as follows (in millions):
| |
Years Ended December 31, | |||||||||
|---|---|---|---|---|---|---|---|---|---|---|
| |
2011 | 2010 | 2009 | |||||||
Income before non-cash income and expenses |
$ | 138.9 | $ | 61.2 | $ | 89.8 | ||||
Changes in working capital |
$ | 4.7 | $ | 26.0 | $ | (8.8 | ) | |||
The primary reason for the increase in cash flow from income before non-cash income and expenses of $77.7 million from 2010 to 2011 relates to payments made in 2010 for settlement of interest rate swaps, make-whole payments and PIK notes combined with an increase in 2011 gross operating margin and a decrease in interest expense. The primary reason for the decreased cash flow from income before non-cash income and expenses of $28.6 million from 2010 to 2009 relates to payment for settlement of interest rate swaps, make-whole payments and PIK notes in 2010.
The change in working capital for 2011 and 2009 primarily relates to normal fluctuations in trade receivable and payable balances due to timing of collections and payments. The change in working capital for 2010 primarily relates to accrued interest on long-term debt. We pay interest semi-annually in February and August on our senior unsecured notes which caused the balance in accrued interest to increase by approximately $19.0 million in 2010 as compared to 2009.
Cash Flows from Investing Activities. Net cash used in investing activities was $132.1 million for the year ended December 31, 2011 and net cash provided by investing activities was $14.6 million for the year ended December 31, 2010. Net cash used in investing activity was $379.9 million for the year ended December 31, 2009. Cash flows from investing activities for the years ended December 31, 2011, 2010 and 2009 included proceeds from property sales of $0.5 million, $60.2 million and $503.9 million, respectively. The east Texas assets and a non-operational processing plant held in inventory were the primary assets sold in 2010 for $39.8 million and $19.5 million, respectively. In 2009, we sold our
61
Arkoma system for approximately $10.7 million, we sold our midstream assets in Alabama, Mississippi and south Texas for approximately $217.6 million and we sold our natural gas treating business for $265.4 million. Our primary use of cash related to investing activities for the years ended December 31, 2011, 2010 and 2009 were capital expenditures and acquisitions, net of accrued amounts, and an investment in HEP as follows (in millions):
| |
Years Ended December 31, | |||||||||
|---|---|---|---|---|---|---|---|---|---|---|
| |
2011 | 2010 | 2009 | |||||||
Growth capital expenditures |
$ | 85.0 | $ | 37.4 | $ | 90.5 | ||||
Acquisition and asset purchases |
— | — | 35.1 | |||||||
Maintenance capital expenditures |
12.6 | 10.8 | 10.9 | |||||||
Investment in Howard Energy Partners |
35.0 | — | — | |||||||
Total |
$ | 132.6 | $ | 48.2 | $ | 136.5 | ||||
Cash Flows from Financing Activities. Net cash used in financing activities was $5.0 million, $84.9 million, and $461.7 million for the years ended December 31, 2011, 2010, and 2009, respectively. Our primary financing activities consist of the following (in millions):
| |
Years Ended December 31, | |||||||||
|---|---|---|---|---|---|---|---|---|---|---|
| |
2011 | 2010 | 2009 | |||||||
Net borrowings (repayments) under bank credit facilities(1) |
$ | 85.0 | $ | (529.6 | ) | $ | (254.4 | ) | ||
Senior secured note repayments(2) |
— | (316.5 | ) | (163.2 | ) | |||||
Senior unsecured note borrowings (net of discount on the note) |
— | 711.5 | — | |||||||
Series B secured note repayment |
(7.1 | ) | (11.0 | ) | — | |||||
Net payments under capital lease obligations |
(3.1 | ) | (2.4 | ) | (0.7 | ) | ||||
Debt refinancing costs |
(4.0 | ) | (28.6 | ) | (15.0 | ) | ||||
Issuance of preferred units(3) |
— | 120.8 | — | |||||||
62
Distributions to unitholders and our general partner represent one of our primary uses of cash in financing activities. Total cash distributions made during the years ended December 31, 2011, 2010 and 2009 were as follows (in millions):
| |
Years ended December 31, |
|||||||||
|---|---|---|---|---|---|---|---|---|---|---|
| |
2011 | 2010 | 2009 | |||||||
Common units |
$ | 60.2 | $ | 12.8 | $ | 11.4 | ||||
Preferred units |
17.2 | 9.9 | — | |||||||
General partner interest |
3.3 | 0.4 | 0.2 | |||||||
Total |
$ | 80.7 | $ | 23.1 | $ | 11.6 | ||||
The indenture governing our senior unsecured notes provides the ability to pay distributions if a minimum fixed charged coverage ratio is met, and also provides baskets to make payments if such minimum is not met. However, we have established a target over the next couple of years of achieving a ratio of total debt to adjusted EBITDA of less than 4.0 to 1.0. Our ratio of debt to adjusted EBITDA was 3.92 to 1.0 for the year ended December 31, 2011. The distribution payments paid during 2011 are in compliance with our internal financial guidelines.
In order to reduce our interest costs, we do not borrow money to fund outstanding checks until they are presented to the bank. Fluctuations in drafts payable are caused by timing of disbursements, cash receipts and draws on our revolving credit facility. We borrow money under our $635.0 million credit facility to fund checks as they are presented. Based on the January amendment to increase the credit facility borrowing capacity to $635.0 million and borrowings outstanding as of December 31, 2011, the Partnership's available borrowings would be $481.0 million. Changes in drafts payable for 2011, 2010 and 2009 were as follows (in millions):
| |
Years Ended December 31, |
|||||||||
|---|---|---|---|---|---|---|---|---|---|---|
| |
2011 | 2010 | 2009 | |||||||
Increase (decrease) in drafts payable |
$ | 5.9 | $ | (5.1 | ) | $ | (16.3 | ) | ||
Working Capital Deficit. We had a working capital deficit of $22.6 million as of December 31, 2011. Changes in working capital may fluctuate significantly between periods even though our trade receivables and payables are typically collected and paid in 30 to 60 day pay cycles. A large volume of our revenues are collected and a large volume of our gas purchases are paid near each month end or the first few days of the following month so receivable and payable balances at any month end may fluctuate significantly depending on the timing of these receipts and payments. In addition, although we strive to minimize our natural gas and NGLs in inventory, these working inventory balances may fluctuate significantly from period to period due to operational reasons and due to changes in natural gas and NGL prices. The changes in working capital during the years ended December 31, 2011 and 2010 are due to the impact of the fluctuations discussed above.
January 2010 Sale of Preferred Units. On January 19, 2010, we issued approximately $125.0 million of Series A Convertible Preferred Units to an affiliate of Blackstone/GSO Capital Solutions for net proceeds of $120.8 million. Crosstex Energy, GP, L.P. made a general partner contribution of $2.6 million in connection with the issuance to maintain its 2% general partner interest. The 14,705,882 preferred units are convertible by the holders thereof at any time into common units on a one-for-one basis, subject to certain adjustments in the event of certain dilutive issuances of common units. They are entitled to a quarterly distribution that is the greater of $0.2125 per unit or the amount of the quarterly distribution per unit paid to common unitholders, subject to certain adjustments. Such quarterly distribution may be paid in cash, in additional preferred units issued in kind or any
63
combination thereof, provided that the distribution may not be paid in additional preferred units if we pay a cash distribution on common units.
Potential Changes in use of Sabine Plant during 2012. Currently, our Sabine plant has a contract with a third-party to fractionate the raw-make NGLs produced by the plant. We have been unsuccessful in renewing this contract, which expires on March 1, 2012. We have an interim solution to continue to provide for fractionation of the NGLs produced by the Sabine plant. Ultimately, we plan to connect the Sabine gas supply to our Eunice plant, which can process the gas and fractionate the produced NGLs. If this processing change is made, we will likely cease operating the Sabine plant. Although we do not have specific plans at this time to relocate the Sabine plant once it is idled, we may consider it for utilization elsewhere in our operations. The net book value of the Sabine plant was $34.0 million as of December 31, 2011. If the plant is idled on a long-term basis as contemplated above, an impairment may be recorded to expense the non-recoverable costs associated with the plant's current location, which are estimated to be less than $15.0 million based on the net book value as of December 31, 2011.
Capital Projects for 2012. Our 2012 capital budget includes approximately $294.0 million of identified growth projects and capital interest. Our primary capital projects for 2012 include the expansion of the Cajun Sibon NGL Pipeline and construction of processing plants in the Permian Basin. The first project is our Cajun-Sibon NGL pipeline expansion with an estimated cost of $230.0 million and an estimated completion date during the first half of 2013. The second project is our 50 percent owned Deadwood Plant and the completion of our 100 percent owned Mesquite Terminal facilities in the Permian Basin with a capital spend of approximately $45.0 million in 2012. During 2011, we invested in several capital projects. Our 2011 capital projects included our north Texas expansions with a total cost of $44.2 million, and our Mesquite Terminal and Deadwood Plant projects with a total cost of $26.9 million. Also, we made an equity investment in Howard Energy for an initial capital contribution of $35.0 million. See "Item 1. Busines—Recent Growth Developments" for further details.
In 2012, it is possible that not all of the planned projects will be commenced or completed. We expect to fund our maintenance capital expenditures of $17.0 million from operating cash flows. We provide for income taxes using the liability method. Accordingly, deferred taxes are recorded for the differences between the tax and book basis of assets and liabilities that will reverse in future periods. We expect to fund the growth capital expenditures from the proceeds of borrowings under our bank credit facility discussed below, and from other debt and equity sources. Our ability to pay distributions to our unitholders, and to fund planned capital expenditures and to make acquisitions will depend upon our future operating performance, which will be affected by prevailing economic conditions in the industry and financial, business and other factors, some of which are beyond our control.
Off-Balance Sheet Arrangements. We had no off-balance sheet arrangements as of December 31, 2011, 2010 and 2009.
64
Total Contractual Cash Obligations. A summary of our total contractual cash obligations as of December 31, 2011, is as follows (in millions):
| |
Payments Due by Period | |||||||||||||||||||||
|---|---|---|---|---|---|---|---|---|---|---|---|---|---|---|---|---|---|---|---|---|---|---|
| |
Total | 2012 | 2013 | 2014 | 2015 | 2016 | Thereafter | |||||||||||||||
Long-term debt obligations |
$ | 810.0 | $ | — | $ | — | $ | — | $ | — | $ | 85.0 | $ | 725.0 | ||||||||
Interest payable on fixed long-term debt obligations |
417.1 | 64.3 | 64.3 | 64.3 | 64.3 | 64.3 | 95.6 | |||||||||||||||
Capital lease obligations |
35.1 | 4.6 | 4.6 | 4.6 | 4.6 | 4.6 | 12.1 | |||||||||||||||
Operating lease obligations |
41.3 | 13.2 | 7.7 | 5.9 | 4.5 | 4.5 | 5.5 | |||||||||||||||
Purchase obligations |
4.1 | 4.1 | — | — | — | — | — | |||||||||||||||
Uncertain tax position obligations |
4.2 | 4.2 | — | — | — | — | — | |||||||||||||||
Total contractual obligations |
$ | 1,311.8 | $ | 90.4 | $ | 76.6 | $ | 74.8 | $ | 73.4 | $ | 158.4 | $ | 838.2 | ||||||||
The above table does not include any physical or financial contract purchase commitments for natural gas due to the nature of both the price and volume components of such purchases, which vary on a daily or monthly basis. Additionally, we do not have contractual commitments for fixed price and/or fixed quantities of any material amount.
The interest payable under the Partnership's credit facility is not reflected in the above table because such amounts depend on outstanding balances and interest rates, which will vary from time to time. However, given the same borrowing amount and rates in effect at December 31, 2011 our cash obligation for interest expense on our credit facility would be approximately $2.0 million per year.
Indebtedness
As of December 31, 2011 and 2010, long-term debt consisted of the following (in millions):
| |
2011 | 2010 | |||||
|---|---|---|---|---|---|---|---|
Bank credit facility (due 2016), interest based on Prime and/or LIBOR plus an applicable margin, interest rate at December 31, 2011 and December 31, 2010 was 2.9% and 4.0%, respectively |
$ | 85.0 | $ | — | |||
Senior unsecured notes, net of discount of $11.6 million and $13.5 million, respectively, which bear interest at the rate of 8.875% |
713.4 | 711.5 | |||||
Series B secured note assumed in the Eunice transaction, which bore interest at the rate of 9.5% |
— | 7.1 | |||||
|
798.4 | 718.6 | |||||
Less current portion |
— | (7.1 | ) | ||||
Debt classified as long-term |
$ | 798.4 | $ | 711.5 | |||
Credit Facility. The Partnership made three amendments to its bank credit facility in May 2011, July 2011 and January 2012. The amendments contained the following changes:
65
As of December 31, 2011, there was $85.0 million of borrowing and $69.0 million in outstanding letters of credit, under the bank credit facility leaving approximately $331.0 million available for future borrowing based on a borrowing capacity of $485.0 million. Based on the January amendment to increase the credit facility borrowing capacity to $635.0 million and borrowings outstanding as of December 31, 2011, the Partnership's available borrowing would be $481.0 million.
The credit facility is guaranteed by substantially all of our subsidiaries and is secured by first priority liens on substantially all of our assets and those of the guarantors, including all material pipeline, gas gathering and processing assets, all material working capital assets and a pledge of all of our equity interests in substantially all of our subsidiaries.
We may prepay all loans under the credit facility at any time without premium or penalty (other than customary LIBOR breakage costs), subject to certain notice requirements. The credit facility requires mandatory prepayments of amounts outstanding thereunder with the net proceeds of certain asset sales, extraordinary receipts, equity issuances and debt incurrences, but these mandatory prepayments do not require any reduction of the lenders' commitments under the credit facility.
Under the amended credit facility, borrowings bear interest at the Partnership's option at the Eurodollar Rate (the British Bankers Association LIBOR Rate) plus an applicable margin or the Base Rate (the highest of the Federal Funds Rate plus 0.50%, the 30-day Eurodollar Rate plus 1.0%, or the administrative agent's prime rate) plus an applicable margin. The Partnership pays a per annum fee (as described below) on all letters of credit issued under the amended credit facility and a commitment fee of between 0.375% and 0.50% per annum on the unused availability under the amended credit facility. The commitment fee, letter of credit fee and the applicable margins for the interest rate vary quarterly based on the Partnership's leverage ratio (as defined in the credit facility, being generally computed as the ratio of total funded debt to consolidated earnings before interest, taxes, depreciation, amortization and certain other non-cash charges) and are as follows:
Leverage Ratio
|
Base Rate Loans |
Eurodollar Rate Loans |
Letter of Credit Fees |
|||||||
|---|---|---|---|---|---|---|---|---|---|---|
Greater than or equal to 4.50 to 1.00 |
2.00 | % | 3.00 | % | 3.00 | % | ||||
Greater than or equal to 4.00 to 1.00 and less than 4.50 to 1.00 |
1.75 | % | 2.75 | % | 2.75 | % | ||||
Greater than or equal to 3.50 to 1.00 and less than 4.00 to 1.00 |
1.50 | % | 2.50 | % | 2.50 | % | ||||
Greater than or equal to 3.00 to 1.00 and less than 3.50 to 1.00 |
1.25 | % | 2.25 | % | 2.25 | % | ||||
Less than 3.00 to 1.00 |
1.00 | % | 2.00 | % | 2.00 | % | ||||
Based on our forecasted leverage ratio of 4.00 to 1.00 for 2012, we expect the margin for the interest rate and letter of credit fee to be in line with the applicable rates above. The credit facility does not have a floor for the Base Rate or the Eurodollar Rate.
66
The amended credit facility includes financial covenants that are tested on a quarterly basis, based on the rolling four-quarter period that ends on the last day of each fiscal quarter. The maximum permitted leverage ratio (as defined in the credit facility, but generally computed as the ratio of total secured funded debt to consolidated earnings before interest, taxes, depreciation, amortization and certain other non-cash charges) is 5.00 to 1.00. The minimum consolidated interest coverage ratio (as defined in the credit facility, but generally computed as the ratio of consolidated earnings before interest, taxes, depreciation, amortization and certain other non-cash charges to consolidated interest charges) is as follows:
In addition, the credit facility contains various covenants that, among other restrictions, limit our ability to:
The credit facility permits us to make quarterly distributions to unitholders so long as no default exists under the credit facility.
Each of the following is an event of default under the credit facility:
67
If an event of default relating to bankruptcy or other insolvency events occur, all indebtedness under the credit facility will immediately become due and payable. If any other event of default exists under the credit facility, the lenders may accelerate the maturity of the obligations outstanding under the credit facility and exercise other rights and remedies. In addition, if any event of default exists under the credit facility, the lenders may commence foreclosure or other actions against the collateral.
If any default occurs under the credit facility, or if we are unable to make any of the representations and warranties in the credit facility, we will be unable to borrow funds or have letters of credit issued under the credit facility.
We expect to be in compliance with the covenants in the credit facility for at least the next twelve months.
Series B Secured Note. On October 20, 2009, the Partnership acquired the Eunice natural gas liquids processing plant and fractionation facility which included an $18.1 million series B secured note. We paid $11.0 million of principal on the series B secured note in May 2010 and paid the remaining $7.1 million in May 2011.
Senior Unsecured Notes. On February 10, 2010, we issued $725.0 million in aggregate principal amount of 8.875% senior unsecured notes (the "notes") due on February 15, 2018 pursuant to Rule 144A and Regulation S under the Securities Act at an issue price of 97.907% to yield 9.25% to maturity including the original issue discount (OID). Net proceeds from the sale of the notes of $689.7 million (net of transaction costs and OID), together with borrowings under the credit facility discussed above, were used to repay in full amounts outstanding under the prior bank credit facility and senior secured notes and to pay related fees, costs and expenses, including the settlement of interest rate swaps associated with the prior credit facility. Interest payments on the notes are due semi-annually in arrears in February and August.
The indenture governing the notes contains covenants that, among other things, limit our ability and the ability of certain of our subsidiaries to:
The indenture provides that if our fixed charge coverage ratio (the ratio of consolidated cash flow to fixed charges, which generally represents the ratio of adjusted EBITDA to interest charges with further adjustments as defined per the indenture) for the most recently ended four full fiscal quarters is not less than 2.0 to 1.0, we will be permitted to pay distributions to our unitholders in an amount equal
68
to available cash from operating surplus (each as defined in our partnership agreement) with respect to our preceding fiscal quarter plus a number of items, including the net cash proceeds received by us as a capital contribution or from the issuance of equity interests since the date of the indenture, to the extent not previously expended. If our fixed charge coverage ratio is less than 2.0 to 1.0, we will be able to pay distributions to our unitholders in an amount equal to an $80.0 million basket (less amounts previously expended pursuant to such basket), plus the same number of items discussed in the preceding sentence to the extent not previously expended. We expect to be in compliance with this ratio for at least the next twelve months.
If the notes achieve an investment grade rating from each of Moody's Investors Service, Inc. and Standard & Poor's Ratings Services, many of the covenants discussed above will terminate.
We may redeem up to 35% of the notes at any time prior to February 15, 2013 with the cash proceeds from equity offerings at a redemption price of 108.875% of the principal amount of the notes (plus accrued and unpaid interest to the redemption date) provided that:
Prior to February 15, 2014, we may redeem the notes, in whole or in part, at a "make-whole" redemption price. On or after February 15, 2014, we may redeem all or a part of the notes at redemption prices (expressed as percentages of principal amount) equal to 104.438% for the twelve-month period beginning on February 15, 2014, 102.219% for the twelve-month period beginning February 15, 2015 and 100.00% for the twelve-month period beginning on February 15, 2016 and at any time thereafter, plus accrued and unpaid interest, if any, to the applicable redemption date on the notes.
Each of the following is an event of default under the indenture:
If an event of default relating to bankruptcy or other insolvency events occurs, the senior unsecured notes will immediately become due and payable. If any other event of default exists under the indenture, the trustee under the indenture or the holders of the senior unsecured notes may accelerate the maturity of the senior unsecured notes and exercise other rights and remedies.
Credit Risk
Risks of nonpayment and nonperformance by our customers are a major concern in our business. We are subject to risks of loss resulting from nonpayment or nonperformance by our customers and other counterparties, such as ourlenders and hedging counterparties. Any increase in the nonpayment and nonperformance by our customers could adversely affect our results of operations and reduce our ability to make distributions to our unitholders.
69
Inflation
Inflation in the United States has been relatively low in recent years in the economy as a whole. The midstream natural gas industry experienced an increase in labor and material costs during 2009, but 2010 and 2011 remained relatively unchanged. These increases did not have a material impact on our results of operations for the periods presented. Although the impact of inflation has been insignificant in recent years, it is still a factor in the United States economy and may increase the cost to acquire or replace property, plant and equipment and may increase the costs of labor and supplies. To the extent permitted by competition, regulation and our existing agreements, we have and will continue to pass along increased costs to our customers in the form of higher fees.
Environmental
Our operations are subject to environmental laws and regulations adopted by various governmental authorities in the jurisdictions in which these operations are conducted. We believe we are in material compliance with all applicable laws and regulations. For a more complete discussion of the environmental laws and regulations that impact us, see "Item 1. Business—Environmental Matters."
Contingencies
On June 7, 2010, Formosa Plastics Corporation, Texas, Formosa Plastics Corporation America, Formosa Utility Venture, Ltd., and Nan Ya Plastics Corporation, America filed a lawsuit against Crosstex Energy, Inc., Crosstex Energy, L.P., Crosstex Energy GP, L.P., Crosstex Energy GP, LLC, Crosstex Energy Services, L.P., and Crosstex Gulf Coast Marketing, Ltd. In the 24th Judicial District Court of Calhoun County, Texas, asserting claims for negligence, res ipsa loquitor, products liability and strict liability relating to the alleged receipt by the plaintiffs of natural gas liquids into their facilities from facilities operated by the Partnership. The amended petition alleges that the plaintiffs have incurred approximately $35.0 million in damages, including damage to equipment and lost profits. The Partnership has submitted the claim to its insurance carriers and intends to vigorously defend the lawsuit. The Partnership believes that any recovery would be within applicable policy limits. Although it is not possible to predict the ultimate outcome of this matter, the Partnership does not expect that an award in this matter will have a material adverse impact on its consolidated results of operations or financial condition.
At times, the Partnership's gas-utility subsidiaries acquire pipeline easements and other property rights by exercising rights of eminent domain provided under state law. As a result, the Partnership (or its subsidiaries) is a party to a number of lawsuits under which a court will determine the value of pipeline easements or other property interests obtained by the Partnership's gas utility subsidiaries by condemnation. Damage awards in these suits should reflect the value of the property interest acquired and the diminution in the value of the remaining property owned by the landowner. However, some landowners have alleged unique damage theories to inflate their damage claims or assert valuation methodologies that could result in damage awards in excess of the amounts anticipated. Although it is not possible to predict the ultimate outcomes of these matters, the Partnership does not expect that awards in these matters will have a material adverse impact on its consolidated results of operations or financial condition.
The Partnership (or its subsidiaries) is defending a number of lawsuits filed by owners of property located near processing facilities or compression facilities constructed by the Partnership as part of its systems. The suits generally allege that the facilities create a private nuisance and have damaged the value of surrounding property. Claims of this nature have arisen as a result of the industrial development of natural gas gathering, processing and treating facilities in urban and occupied rural areas. In January 2012, a plaintiff in one of these lawsuits was awarded a judgment of $2.0 million. The Partnership intends to appeal the matter and will post a bond to secure the judgment pending its
70
resolution. The Partnership has accrued $2.0 million related to this matter as of December 31, 2011 and reflected the related expense in operating expenses in the fourth quarter of 2011.
Disclosure Regarding Forward-Looking Statements
This Annual Report on Form 10-K contains forward-looking statements that are based on information currently available to management as well as management's assumptions and beliefs. All statements, other than statements of historical fact, included in this Form 10-K constitute forward-looking statements, including but not limited to statements identified by the words "forecast," "may," "believe," "will," "should," "plan," "predict," "anticipate," "intend," "estimate" and "expect" and similar expressions. Such statements reflect our current views with respect to future events, based on what we believe are reasonable assumptions; however, such statements are subject to certain risks and uncertainties. In addition to the specific uncertainties discussed elsewhere in this Form 10-K, the risk factors set forth in "Item 1A. Risk Factors" may affect our performance and results of operations. Should one or more of these risks or uncertainties materialize, or should underlying assumptions prove incorrect, actual results may differ materially from those in the forward-looking statements. We disclaim any intention or obligation to update or review any forward-looking statements or information, whether as a result of new information, future events or otherwise.
Item 7A. Quantitative and Qualitative Disclosures about Market Risk
Market risk is the risk of loss arising from adverse changes in market rates and prices. Our primary market risk is the risk related to changes in the prices of natural gas and NGLs. In addition, we are also exposed to the risk of changes in interest rates on floating rate debt.
On July 21, 2010, President Obama signed the Dodd-Frank Wall Street Reform and Consumer Protection Act (the "Act") into law, a part of which relates to increased regulation of the markets for derivative products of the type we use to manage areas of market risk. While the Commodity Futures Trading Commission has not yet completed its expected series of new regulations to implement the Act, Dodd-Frank may result in increased costs to us to implement our market risk management strategy.
Commodity Price Risk
We are subject to significant risks due to fluctuations in commodity prices. Our exposure to these risks is primarily in the gas processing component of our business. We currently process gas under three main types of contractual arrangements:
71
The gross operating margin presentation in the table below is calculated net of results from discontinued operations. Gas processing margins by contract types and gathering and transportation margins as a percent of total gross operating margin for the comparative year-to-date periods are as follows:
| |
Years Ended December 31, | |||||||||
|---|---|---|---|---|---|---|---|---|---|---|
| |
2011 | 2010 | 2009 | |||||||
Gathering and transportation margin |
56.6 | % | 62.2 | % | 65.8 | % | ||||
Gas processing margins: |
||||||||||
Processing margin |
19.3 | % | 12.9 | % | 8.9 | % | ||||
Percent of liquids |
10.7 | % | 10.6 | % | 13.2 | % | ||||
Fee based |
13.4 | % | 14.3 | % | 12.1 | % | ||||
Total gas processing |
43.4 | % | 37.8 | % | 34.2 | % | ||||
Total |
100.0 |
% |
100.0 |
% |
100.0 |
% |
||||
We have hedges in place at December 31, 2011 covering a portion of the liquids volumes we expect to receive under percent of liquids (POL) contracts. The hedges done via swaps are set forth in the following table. The relevant payment index price is the monthly average of the daily closing price for deliveries of commodities into Mont Belvieu, Texas as reported by the Oil Price Information Service (OPIS).
Period
|
Underlying | Notional Volume |
We Pay | We Receive* | Fair Value Asset/(Liability) |
|||||||||
|---|---|---|---|---|---|---|---|---|---|---|---|---|---|---|
| |
|
|
|
|
(In thousands) |
|||||||||
January 2012 - December 2012 |
Ethane | 46 (MBbls | ) | Index | $ | 0.6367/gal | $ | (269 | ) | |||||
January 2012 - December 2012 |
Propane | 73 (MBbls | ) | Index | $ | 1.3005/gal | (128 | ) | ||||||
January 2012 - December 2012 |
Normal Butane | 39 (MBbls | ) | Index | $ | 1.6855/gal | (221 | ) | ||||||
January 2012 - December 2012 |
Natural Gasoline | 30 (MBbls | ) | Index | $ | 2.2664/gal | 67 | |||||||
|
$ | (551 | ) | |||||||||||
We have hedged our exposure to declines in prices for NGL volumes produced for our account. The NGL volumes hedged, as set forth above, focus on our POL contracts. We hedge our POL exposure based on volumes we consider hedgeable (volumes committed under contracts that are long term in nature) versus total POL volumes that include volumes that may fluctuate due to contractual terms, such as contracts with month to month processing options. We have hedged 50.0% of our hedgeable volumes at risk through December 2012 (27.5% of total volumes at risk through December 2012).
72
We also have hedges in place at December 31, 2011 covering the fractionation spread risk related to our processing margin contracts as set forth in the following table:
Period
|
Underlying | Notional Volume |
We Pay | We Receive | Fair Value Asset/(Liability) |
|||||||||
|---|---|---|---|---|---|---|---|---|---|---|---|---|---|---|
| |
|
|
|
|
(In thousands) |
|||||||||
January 2012 - December 2012 |
Ethane | 122 (MBbls | ) | Index | $ | 0.6972/gal | * | $ | (257 | ) | ||||
January 2012 - December 2012 |
Propane | 106 (MBbls | ) | Index | $ | 1.3185/gal | * | (108 | ) | |||||
January 2012 - December 2012 |
Normal Butane | 62 (MBbls | ) | Index | $ | 1.7542/gal | * | (170 | ) | |||||
January 2012 - December 2012 |
Natural Gasoline | 51 (MBbls | ) | Index | $ | 2.3249/gal | * | 241 | ||||||
January 2012 - December 2012 |
Natural Gas | 3,915 (MMBtu/d | ) | $4.682/MMBtu* | Index | (2,138 | ) | |||||||
|
$ | (2,432 | ) | |||||||||||
In relation to our fractionation spread risk, as set forth above, we have hedged 60.9% of our hedgeable liquids volumes at risk through December 2012 (15.7% of total liquids volumes at risk) and 63.6% of the related hedgeable PTR volumes through December 2012 (13.2% of total PTR volumes).
We are also subject to price risk to a lesser extent for fluctuations in natural gas prices with respect to a portion of our gathering and transport services. Approximately 5.1% of the natural gas we market is purchased at a percentage of the relevant natural gas index price, as opposed to a fixed discount to that price. As a result of purchasing the natural gas at a percentage of the index price, our resale margins are higher during periods of high natural gas prices and lower during periods of lower natural gas prices.
Another price risk we face is the risk of mismatching volumes of gas bought or sold on a monthly price versus volumes bought or sold on a daily price. We enter each month with a balanced book of natural gas bought and sold on the same basis. However, it is normal to experience fluctuations in the volumes of natural gas bought or sold under either basis, which leaves us with short or long positions that must be covered. We use financial swaps to mitigate the exposure at the time it is created to maintain a balanced position.
Our primary commodity risk management objective is to reduce volatility in our cash flows. We maintain a risk management committee, including members of senior management, which oversees all hedging activity. We enter into hedges for natural gas and NGLs using over-the-counter derivative financial instruments with only certain well-capitalized counterparties which have been approved by our risk management committee.
The use of financial instruments may expose us to the risk of financial loss in certain circumstances, including instances when (1) sales volumes are less than expected requiring market purchases to meet commitments or (2) our counterparties fail to purchase the contracted quantities of natural gas or otherwise fail to perform. To the extent that we engage in hedging activities we may be prevented from realizing the benefits of favorable price changes in the physical market. However, we are similarly insulated against unfavorable changes in such prices.
As of December 31, 2011, outstanding natural gas swap agreements, NGL swap agreements, swing swap agreements, storage swap agreements and other derivative instruments were a net fair value liability of $2.7 million. The aggregate effect of a hypothetical 10% increase in gas and NGL prices would result in an increase of approximately $2.7 million in the net fair value liability of these contracts as of December 31, 2011 to a net fair value liability of approximately $5.4 million.
73
Interest Rate Risk
We are exposed to interest rate risk on our variable rate bank credit facility. At December 31, 2011, we had $85.0 million outstanding borrowings under this facility. A 1% increase or decrease in interest rates would change our annual interest expense by approximately $0.9 million for the year.
At December 31, 2011 and 2010, we had total fixed rate debt obligations of $713.4 million and $718.6 million, respectively. The balances at December 31, 2011 and 2010 are substantially related to our senior unsecured notes with an interest rate of 8.875%. The fair value of these fixed rate obligations was approximately $882.5 million and $768.3 million as of December 31, 2011 and 2010, respectively. We estimate that a 1% increase or decrease in interest rates would increase or decrease the fair value of the fixed rate debt (the senior unsecured notes) by $23.4 million based on the debt obligations as of December 31, 2011.
Item 8. Financial Statements and Supplementary Data
The Report of Independent Registered Public Accounting Firm, Consolidated Financial Statements and supplementary financial data required by this Item are set forth on pages F-1 through F-52 of this Report and are incorporated herein by reference.
Item 9. Changes in and Disagreements With Accountants on Accounting and Financial Disclosure
None.
Item 9A. Controls and Procedures
(a) Evaluation of Disclosure Controls and Procedures
We carried out an evaluation, under the supervision and with the participation of management, including the Chief Executive Officer and Chief Financial Officer of Crosstex Energy GP, LLC, of the effectiveness of our disclosure controls and procedures as of the end of the period covered by this report pursuant to Exchange Act Rules 13a-15 and 15d-15. Based on that evaluation, the Chief Executive Officer and Chief Financial Officer have concluded that, as of the end of the period covered by this report (December 31, 2011), our disclosure controls and procedures were effective to provide reasonable assurance that information required to be disclosed by us in the reports we file or submit under the Securities Exchange Act of 1934 is recorded, processed, summarized and reported, within the time period specified in the applicable rules and forms, and that such information is accumulated and communicated to management, including our Chief Executive Officer and Chief Financial Officer, to allow timely decisions regarding disclosure.
(b) Changes in Internal Control Over Financial Reporting
There has been no change in our internal control over financial reporting that occurred in the three months ended December 31, 2011 that has materially affected, or is reasonably likely to materially affect, our internal control over financial reporting.
Internal Control Over Financial Reporting
See "Management's Report on Internal Control over Financial Reporting" on page F-2.
On February 27, 2012, Crosstex Energy GP, LLC entered into an employment agreement with each of Barry E. Davis, William W. Davis, Joe A. Davis, Michael J. Garberding and Stan Golemon. These employment agreements are substantially similar to one another with certain exceptions, which are set
74
forth in the following discussion. The term of the agreement for Barry E. Davis is three years, for William W. Davis, Joe A. Davis and Michael J. Garberding is two years, and for Stan Golemon is one year and will automatically be extended such that the remaining term of the agreements will not be less than one year. The employment agreements include obligations not to disclose confidential information and also provide for a noncompetition period that will continue after the termination of the employee's employment for one year for Barry E. Davis and for six months for William W. Davis, Joe A. Davis, Michael J. Garberding and Stan Golemon. During the noncompetition period, the employees are generally prohibited from engaging in any business that competes with us or our affiliates in areas in which we conduct business as of the date of termination and from soliciting or inducing any of our employees to terminate their employment with us. The employment agreements provide a clawback of benefits if the confidential information or noncompetition provisions are breached by a terminated employee following a termination date. In the event of a termination, the terminated employee is required to execute a general release of the company in order to receive any benefits under the employment agreements.
Under these employment agreements, employees receive their annual base salary and are eligible to participate in cash and equity incentive bonus programs based on criteria established by the board. If the employment of Barry E. Davis, William W. Davis, Joe A. Davis, Michael J. Garberding or Stan Golemon is terminated without cause (as defined in the employment agreement), or is terminated by the employee for good reason (as defined in the employment agreement), or is terminated due to the employee's death or disability, the employment agreement provides that such employee will be paid (i) his or her base salary up to the date of termination, (ii) a pro-rata portion of the target amount of his or her annual bonus up to the date of termination, (iii) an amount equal to the cost to the employee for premium for health insurance continuation under COBRA for an 18-month period, (iv) such other fringe benefits (other than any bonus, severance pay benefit, participation in the company's 401(k) employee benefit plan, or medical insurance benefit) normally provided to employees of the company as earned up to the date of termination, and (v) a lump sum severance amount equal to one year (two years in the case of Barry E. Davis) of the employee's then current base salary, plus one times (two times in the case of Barry E. Davis) the target annual bonus for the year of termination.
The employment agreements provide that in the event of a termination by the Company without cause, or a termination by the employee for good reason, within 120 days prior to or one year following a change of control (as defined in the employment agreements), (i) Barry E. Davis would be paid a lump sum severance amount equal to three years of his then current base salary plus three times the target annual bonus for the year of termination, (ii) William W. Davis, Joe E. Davis and Michael J. Garberding would be paid a lump sum severance amount equal to two years of his then current base salary plus two times the target annual bonus for the year of termination and (iii) Stan Golemon would be paid a lump sum severance amount equal to one year of his then current base salary plus the target annual bonus for the year of termination.
For a summary of the potential payments that may be made to Barry E. Davis, William W. Davis, Joe A. Davis, Michael J. Garberding and Stan Golemon, please see "Item 11. Executive Compensation—Payments Upon Termination or Change of Control." The foregoing summary of the material terms of these employment agreements is qualified by its entirety by reference to the form of employment agreement, a copy of which is filed herewith as Exhibit 10.20.
75
Item 10. Directors, Executive Officers and Corporate Governance
As is the case with many publicly traded partnerships, we do not have officers, directors or employees. Our operations and activities are managed by our general partner, Crosstex Energy GP, LLC. Our operational personnel are employees of the Operating Partnership. References to our officers, directors and employees are references to the officers, directors and employees of our general partner or the Operating Partnership.
Unitholders do not directly or indirectly participate in our management or operation. Our general partner owes a fiduciary duty to the unitholders, as limited by our partnership agreement. As general partner, Crosstex Energy GP, LLC is liable for all of our debts (to the extent not paid from our assets), except for indebtedness or other obligations that are made specifically non-recourse to it. Whenever possible, our general partner intends to incur indebtedness or other obligations on a non-recourse basis.
The following table shows information for the members of the board of directors (the "Board) and the executive officers of our general partner. Executive officers and directors serve until their successors are duly appointed or elected.
Name
|
Age
|
Position with Crosstex Energy GP, LLC | |||
|---|---|---|---|---|---|
Barry E. Davis |
50 | President, Chief Executive Officer and Director | |||
William W. Davis |
58 | Executive Vice President and Chief Operating Officer | |||
Joe A. Davis |
51 | Executive Vice President, General Counsel and Secretary | |||
Michael J. Garberding |
43 | Senior Vice President and Chief Financial Officer | |||
Stan Golemon |
48 | Senior Vice President-Engineering and Operations | |||
Rhys J. Best** |
65 | Chairman of the Board and Member of the Conflicts, Finance* and Compensation Committees | |||
Leldon E. Echols** |
56 | Director and Member of the Audit* and Finance Committees | |||
Bryan H. Lawrence |
69 | Director | |||
Sheldon B. Lubar** |
82 | Director and Member of the Governance* Committee | |||
Cecil E. Martin** |
70 | Director and Member of the Audit and Compensation* Committees | |||
D. Dwight Scott |
48 | Director and Member of the Compensation and Finance Committee | |||
Kyle D. Vann** |
64 | Director and Member of the Governance, Conflicts* and Audit Committees | |||
Barry E. Davis, President, Chief Executive Officer and Director, led the management buyout of the midstream assets of Comstock Natural Gas, Inc. in December 1996, which transaction resulted in the formation of our predecessor. Mr. Davis has served as director since our IPO in December 2002. Mr. Davis was President and Chief Operating Officer of Comstock Natural Gas and founder of Ventana Natural Gas, a gas marketing and pipeline company that was purchased by Comstock Natural Gas. Mr. Davis started Ventana Natural Gas in June 1992. Prior to starting Ventana, he was Vice President of Marketing and Project Development for Endevco, Inc. Before joining Endevco, Mr. Davis was employed by Enserch Exploration in the marketing group. Mr. Davis holds a B.B.A. in Finance from Texas Christian University. Mr. Davis also serves as Chairman of the Board for Crosstex Energy, Inc. Mr. Davis is not related to William W. Davis or Joe A. Davis. Mr. Davis leadership skills and experience in the midstream natural gas industry, among other factors led the Board to conclude that he should serve as a director.
76
William W. Davis, Executive Vice President and Chief Operating Officer, joined our predecessor in September 2001, and has over 30 years of finance and accounting experience. Mr. Davis assumed the role of Chief Operating Officer in August 2011. Mr. Davis previously served as our Chief Financial Officer for over 8 years. Prior to joining our predecessor, Mr. Davis held various positions with Sunshine Mining and Refining Company from 1983 to September 2001, including Executive Vice President and Chief Financial Officer from 1991 to 2001. In addition, Mr. Davis served as Chief Operating Officer in 2000 and 2001. Mr. Davis graduated magna cum laude from Texas A&M University with a B.B.A. in Accounting and is a Certified Public Accountant. Mr. Davis is not related to Barry E. Davis or Joe A. Davis.
Joe A. Davis, Executive Vice President, General Counsel and Secretary, joined Crosstex in October 2005. He began his legal career in 1985 with the Dallas firm of Worsham Forsythe, which merged with the international law firm of Hunton & Williams in 2002. Most recently, he served as a partner in the firm's Energy Practice Group, and served on the firm's Executive Committee. Mr. Davis specialized in facility development, sales, acquisitions and financing for the energy industry, representing entrepreneurial start up/development companies, growth companies, large public corporations and large electric and gas utilities. He received his J.D. from Baylor Law School in Waco and his B.S. degree from the University of Texas in Dallas. Mr. Davis is not related to Barry E. Davis or William W. Davis.
Michael J. Garberding, Senior Vice President and Chief Financial Officer joined our general partner in February 2008. Mr. Garberding assumed the role of Chief Financial Officer in August 2011. Mr. Garberding previously led the finance and business development organization for the Partnership. Mr. Garberding has 20 years experience in finance and accounting. From 2002 to 2008, Mr. Garberding held various finance and business development positions at TXU Corporation, including assistant treasurer. In addition, Mr. Garberding worked at Enron North America as a Finance Manager and Arthur Andersen LLP as an Audit Manager. He received his Masters in Business Administration from the University of Michigan in 1999 and his B.B.A. in Accounting from Texas A&M University in 1991.
Stan Golemon, Senior Vice President—Engineering and Operations, joined our general partner in May of 2008. Mr. Golemon has 25 years of experience in engineering, operations, and commercial development in the midstream and exploration and production industries. From 1997 to 2008, Mr. Golemon held various midstream engineering, commercial, and management positions with Union Pacific Resources and its successor company Anadarko Petroleum Corporation including General Manager of Midstream Engineering and Engineering Supervisor. Mr. Golemon also spent 3 years with The Arrington Corporation consulting on sulfur recovery operations and Process Safety Management. Mr. Golemon began his career with ARCO Oil and Gas Company where he worked in plant engineering, onshore facilities engineering, and offshore facilities engineering. Mr. Golemon graduated summa cum laude from Louisiana Tech University in 1985 with a Bachelor of Science degree in Chemical Engineering.
Rhys J. Best joined Crosstex Energy GP, LLC as a director in June 2004 and became Chairman of the Board in February 2009. Mr. Best was Chairman and Chief Executive Officer of Lone Star Technologies, Inc., until its merger into United States Steel Company in June of 2007. Mr. Best held the position of Chief Executive Officer from June 1998 and he assumed the additional responsibilities of Chairman in January 1999. He began his career at Lone Star as the President and Chief Executive Officer of Lone Star Steel Company, a position he held for eight years before becoming President and Chief Operating Officer of the parent company in 1997. Before joining Lone Star, Mr. Best held several leadership positions in the banking industry. Mr. Best also serves on the boards of Trinity Industries (NYSE: TRN), Cabot Oil & Gas Corp. (NYSE: COG), Commercial Metals Company (NYSE:CMC), Austin Industries, Inc., and McJunkin Red Man Corporation. Trinity is a leading diversified holding company with a subsidiary group that provides a variety of products and services for the transportation, industrial, construction and energy sectors. Cabot is an oil and gas exploration and production company. Commercial Metals Company manufactures, recycles and markets steel, other
77
metals and related products. Austin Industries and McJunkin Red Man are private companies in the construction and energy sectors. Mr. Best graduated from the University of North Texas with a Bachelor of Business degree and later earned a Masters of Business Administration degree at Southern Methodist University. Mr. Best's experience in the financial sector and pipe manufacturing industry, leadership skills and experience as Chairman and Chief Executive Officer of public companies, among other factors, led the Board to conclude that he should serve as a director.
Leldon E. Echols joined Crosstex Energy GP, LLC as a director in January 2008. Mr. Echols is a private investor. Mr. Echols also currently serves as an independent director of Trinity Industries, Inc. (NYSE: TRN) and Holly Frontier Corporation (NYSE: HFC), an independent petroleum refiner and marketer. Mr. Echols brings 30 years of financial and business experience to Crosstex. After 22 years with the accounting firm Arthur Andersen LLP, which included serving as managing partner of the firm's audit and business advisory practice in North Texas, Colorado and Oklahoma, Mr. Echols spent six years with Centex Corporation as executive vice president and chief financial officer. He retired from Centex Corporation in June 2006. Mr. Echols is also a member of the board of directors, Roofing Supply Group Holdings, Inc., a private company. He also served on the board of TXU Corporation where he chaired the Audit Committee and was a member of the Strategic Transactions Committee until the completion of the private equity buyout of TXU in October 2007. Mr. Echols earned a Bachelor of Science degree in accounting from Arkansas State University and is a Certified Public Accountant. He is a member of the American Institute of Certified Public Accountants and the Texas Society of CPAs. Mr. Echols has also served as a director of Crosstex Energy, Inc. since January 2008. Mr. Echols' accounting and financial experience, service as the Chief Financial Officer for a public company, among other factors, led the Board to conclude that he should serve as a director.
Bryan H. Lawrence, joined Crosstex Energy GP, LLC as a director upon the completion of our initial public offering in December 2002 and served as Chairman of the Board until May 2008. Mr. Lawrence is a founder and senior manager of Yorktown Partners LLC, the manager of the Yorktown group of investment partnerships, which make investments in companies engaged in the energy industry. The Yorktown partnerships were formerly affiliated with the investment firm of Dillon, Read & Co. Inc., where Mr. Lawrence had been employed since 1966, serving as a Managing Director until the merger of Dillon Read with SBC Warburg in September 1997. Mr. Lawrence also serves as a director of Hallador Petroleum Company (OTC BB: HPCO.OB), Star Gas Partners L.P. (NYSE: SGU), Winstar Resources Ltd. (a Canadian public company), Compass Petroleum Ltd. (a Canadian public company) Approach Resources, Inc. (NASDAQ: AREX) and certain non-public companies in the energy industry in which Yorktown partnerships hold equity interests. Mr. Lawrence is a graduate of Hamilton College and also has an M.B.A. from Columbia University. Mr. Lawrence has also served as a director of Crosstex Energy, Inc. since 2000. Mr. Lawrence's financial and investment experience, and experience in the energy industry, among other factors, led the Board to conclude that he should serve as a director.
Sheldon B. Lubar joined Crosstex Energy GP, LLC as a director upon the completion of our initial public offering in December 2002. Mr. Lubar has been Chairman of the Board of Lubar & Co. Incorporated, a private investment and venture capital firm he founded, since 1977. He was Chairman of the Board of Christiana Companies, Inc., a logistics and manufacturing company, from 1987 until its merger with Weatherford International in 1995 and also served as a director of Weatherford International, Inc. (NYSE: WFT) until 2008. Mr. Lubar also served as Chairman and a director of Total Logistics, Inc. until its merger with Super Value Companies (NYSE: SVU) in 2005. Mr. Lubar also serves as a director of Hallador Petroleum Company (OTC BB: HPCO.OB), Star Gas Partners L.P. (NYSE: SGU) and Approach Resources, Inc. (NASDAQ: AREX), an oil and gas exploration and production company. Mr. Lubar holds a bachelor's degree in Business Administration and a law degree from the University of Wisconsin—Madison. He was awarded an honorary Doctor of Commercial Science degree from the University of Wisconsin—Milwaukee in 1988 and a Doctor of
78
Humanities degree from the University of Wisconsin—Madison in 2009. Mr. Lubar has also served as a director of Crosstex Energy, Inc. since January 2004. Mr. Lubar's investment experience, industry experience and service on other public company boards, among other factors, led the Board to conclude that he should serve as a director.
Cecil E. Martin, Jr. joined Crosstex Energy GP, LLC as a director in January 2006. He has been an independent residential and commercial real estate investor since 1991. From 1973 to 1991 he served as chairman of the public accounting firm Martin, Dolan and Holton in Richmond, Virginia. He began his career as an auditor at Ernst and Ernst. He holds a B.B.A. degree from Old Dominion University and is a Certified Public Accountant. Mr. Martin also serves on the board as lead director and chairman of the audit committee for Comstock Resources, Inc. (NYSE: CRK), an independent energy company engaged in oil and gas acquisitions, exploration and development. Mr. Martin served on the board and as chairman of the audit committee for Bois d'Arc Energy, Inc. (NYSE: BDE) until its merger into Stone Energy Corporation, (NYSE: SGY) in 2008. Mr. Martin also serves on the board as chairman of the audit committee of Garrison Capital, LLC, a private company that is a middle market credit and asset based investor. Mr. Martin also has served as a director of Crosstex Energy, Inc. since January 2006. Mr. Martin's accounting and financial experience, experience on audit committees of other public companies, and related industry experience, among other factors, led the Board to conclude that he should serve as a director.
Donald (Dwight) Scott joined Crosstex Energy GP, LLC as a director in January 2010. He is a Senior Managing Director of GSO Capital Partners LP and head of GSO's Houston Office. Mr. Scott focuses on investments in the energy and power markets and is a member of GSO's Investment Committee. Before joining GSO in 2005, Mr. Scott was an Executive Vice President and Chief Financial Officer of El Paso Corporation (NYSE: EP). Prior to joining El Paso, Mr. Scott served as a managing director in the energy investment banking practice of Donaldson, Lufkin & Jenrette. Mr. Scott earned a BA from the University of North Carolina at Chapel Hill and a MBA from The University of Texas at Austin. He is currently a director of SandRidge Energy, Inc. (NYSE: SD) and certain non-public companies, including Bear Tracker Energy LLC, MCV Investors, Inc and United Engines Holding Company, LLC. Mr. Scott is a member of the Board of Trustees of KIPP, Inc. and the River Oaks Baptist School. Mr. Scott brings to the Board investment, financial and industry experience. Mr. Scott was selected as a director pursuant to a Board Representation Agreement entered into on January 19, 2010 between us, our general partner, CEI and GSO Crosstex Holdings LLC. Pursuant to the Board Representation Agreement, each of the Crosstex entities agreed to take all actions necessary or advisable to cause one director serving on the Board to be designated by GSO Crosstex Holdings LLC, in its sole discretion.
Kyle D. Vann joined Crosstex Energy GP, LLC as a director in April 2006. Mr. Vann began his career with Exxon Corporation in 1969. After ten years at Exxon, he joined Koch Industries and served in various leadership capacities, including senior vice president from 1995 to 2000. In 2001, he then took on the role of CEO of Entergy-Koch, LP, an energy trading and transportation company, which was sold in 2004. Currently, Mr. Vann continues to consult with Entergy and Texon, L.P. He also serves on the boards of Texon, L.P. and Legacy Reserves, LLC and on the Advisory Board for Haddington Ventures, LLC. Mr. Vann graduated from the University of Kansas with a Bachelor of Science degree in chemical engineering. He is a member of the Board of Advisors for the University of Kansas School of Engineering, the board of Generous Giving and Mars Hill productions. Mr. Vann serves on the boards of various charitable organizations. Mr. Vann's industry experience, and leadership roles in the energy trading and transportation businesses, among other factors, led the Board to conclude that he should serve as a director.
79
Independent Directors
Messrs. Best, Echols, Lubar, Martin, and Vann qualify as "independent" directors in accordance with the published listing requirements of The NASDAQ Global Select Market (NASDAQ). The NASDAQ independence definition includes a series of objective tests, such as that the director is not an employee of the company and has not engaged in various types of business dealings with the company. In addition, as further required by the NASDAQ rules, the Board has made a subjective determination as to each independent director that no relationships exist which, in the opinion of the Board, would interfere with the exercise of independent judgment in carrying out the responsibilities of a director.
In addition, the members of the Audit Committee also each qualify as "independent" under special standards established by the SEC for members of audit committees, and the Audit Committee includes at least one member who is determined by the Board to meet the qualifications of an "audit committee financial expert" in accordance with SEC rules, including that the person meets the relevant definition of an "independent" director. Messrs. Echols and Martin are both independent directors who have been determined to be audit committee financial experts. Unitholders should understand that this designation is a disclosure requirement of the SEC related to experience and understanding with respect to certain accounting and auditing matters. The designation does not impose any duties, obligations or liabilities that are greater than those generally imposed on a member of the Audit Committee and Board, and the designation of a director as an audit committee financial expert pursuant to this SEC requirement does not affect the duties, obligations or liabilities of any other member of the Audit Committee or Board.
Board Committees
The Board, has, and appoints the members of, standing Audit, Compensation, Finance, Governance and Conflicts Committees. Each member of the Audit, Compensation, Finance, Governance and Conflicts Committees is an independent director in accordance with NASDAQ standards described above. Each of the board committees has a written charter approved by the board. Copies of the charters are available to any person, free of charge, at our web site: www.crosstexenergy.com.
The Audit Committee, comprised of Messrs. Echols (chair), Martin and Vann, assists the Board in its general oversight of our financial reporting, internal controls and audit functions, and is directly responsible for the appointment, retention, compensation and oversight of the work of our independent auditors.
The Finance Committee, comprised of Messrs. Best (chair), Echols and Scott, assists the Board in discharging its duties in connection with financial planning and significant financial transactions, and is directly responsible for reviewing and evaluating distribution policy, transactions that involve issuance of equity or debt securities, oversight of credit facilities, and review of material transactions.
The Conflicts Committee, comprised of Messrs. Vann (chair) and Best, reviews specific matters that the Board believes may involve conflicts of interest between our general partner and Crosstex Energy, L.P. The Conflicts Committee determines if the resolution of a conflict of interest is fair and reasonable to us. The members of the Conflicts Committee are not directors, officers or employees of Crosstex Energy, Inc., the owner of our general partner. Any matters approved by the Conflicts Committee will be conclusively deemed to be fair and reasonable to us, approved by all of our partners, and not a breach by our general partner of any duties owed to us or our unitholders.
The Compensation Committee, comprised of Messrs. Martin (chair), Scott and Best, oversees compensation decisions for the officers of our general partner as well as the compensation plans described herein.
80
The Governance Committee, comprised of Messrs. Lubar (chair) and Vann, reviews matters involving governance including assessing the effectiveness of current policies, monitoring industry developments, recommending committee structures within the Board, managing the assessment process of the Board and individual directors, annually reviewing and recommending the compensation of directors and performing other duties as delegated from time to time. The Governance Committee is responsible for identifying Board candidates and making recommendations to the Board regarding the election of directors. When Board vacancies are created or occur, the Governance Committee reviews applicable legal requirements, listing requirements, and the competencies of the continuing directors, and develops a candidate profile that identifies any specific competencies or expertise that the Committee believes the Board needs to add or supplement. The Governance Committee solicits referrals from existing directors and other industry contacts to identify candidates that possess those specific competencies or that specific expertise. In the past, the Governance Committee has also used search firms to identify potential candidates. The Governance Committee then interviews interested candidates to assess the candidate's qualifications and to assess the ability of the candidate to work with the other directors. The Governance Committee evaluates candidates and makes its recommendations on the basis of the qualifications of each candidate individually, including the candidate's reputation, professional experience, experience in the same or related industries, service on other public company boards, other time commitments, the diversity of the Board members' backgrounds and professional experience, and the ability of the candidate to work with other Board members. Under the terms of our partnership agreement, unitholders do not participate in the appointment or election of the directors of our general partner.
Code of Ethics
Our general partner has adopted a Code of Business Conduct and Ethics (the "Code of Ethics") applicable to all of our employees, officers and directors with regard to Partnership-related activities. The Code of Ethics incorporates guidelines designed to deter wrongdoing and to promote honest and ethical conduct and compliance with applicable laws and regulations. It also incorporates expectations of our employees that enable us to provide accurate and timely disclosure in our filings with the SEC and other public communications. A copy of the Code of Ethics is available to any person, free of charge, at our web site www.crosstexenergy.com. If any substantive amendments are made to the Code of Ethics or if we or our general partner grants any waiver, including any implicit waiver, from a provision of the Code of Ethics to any of our general partner's executive officers and directors, we will disclose the nature of such amendment or waiver on our web site.
Section 16(a)—Beneficial Ownership Reporting Compliance
Based on our records, except as set forth below, we believe that during 2011 all reporting persons complied with the Section 16(a) filing requirements applicable to them. Due to administrative errors, Forms 4 were filed late as follows: on behalf of Susan J. McAden on September 8, 2011, regarding a disposition of units on June 1, 2011 to cover tax liabilities upon the vesting of restricted units; on behalf of Michael Garberding on September 8, 2011, regarding dispositions of units on April 1, 2011 and July 1, 2011 to cover tax liabilities upon the vesting of restricted units, and regarding a grant of restricted units under our long-term incentive plan on September 6, 2011; and on behalf of Stan Golemon on September 8, 2011, regarding a disposition of units on June 1, 2011 to cover tax liabilities upon the vesting of restricted units, and regarding a grant of restricted units under our long-term incentive plan on September 6, 2011; and on behalf of Joe Davis on March 31, 2011, regarding a sale of units on March 28, 2011.
81
Reimbursement of Expenses of our General Partner and its Affiliates
Our general partner does not receive any management fee or other compensation in connection with its management of our partnership. However, our general partner performs services for us and is reimbursed by us for all expenses incurred on our behalf, including the costs of employee, officer and director compensation and benefits, as well as all other expenses necessary or appropriate to the conduct of our business. The partnership agreement provides that our general partner will determine the expenses that are allocable to us in any reasonable manner determined by our general partner in its sole discretion.
Item 11. Executive Compensation
We do not directly employ any of the persons responsible for managing our business. Crosstex Energy GP, LLC, our general partner, manages our operations and activities, and its board of directors and officers make decisions on our behalf. The compensation of the executive officers of Crosstex Energy GP, LLC is determined by the Board upon the recommendation of its Compensation Committee. The compensation of the directors of Crosstex Energy GP, LLC is determined by the Board upon the recommendation of its Governance Committee. Our named executive officers also serve as officers of Crosstex Energy, Inc. and the compensation of the named executive officers discussed below reflects total compensation for services to all Crosstex entities. We pay or reimburse all expenses incurred on our behalf, including the costs of employee, officer and director compensation and benefits, as well as all other expenses necessary or appropriate to the conduct of our business. Our partnership agreement provides that our general partner will determine the expenses allocable to us in any reasonable manner determined by our general partner in its sole discretion. Crosstex Energy, Inc. currently pays a monthly fee to us to cover its portion of administrative and compensation costs, including compensation costs relating to the named executive officers.
Based on the information that we track regarding the amount of time spent by each of our named executive officers on business matters relating to Crosstex Energy, L.P., we estimate that such officers devoted the following percentage of their time to the business of Crosstex Energy, L.P. and to Crosstex Energy, Inc., respectively, for 2011:
Executive Officer or Director
|
Percentage of Time Devoted to Business of Crosstex Energy, L.P. |
Percentage of Time Devoted to Business of Crosstex Energy, Inc. |
|||||
|---|---|---|---|---|---|---|---|
Barry E. Davis |
83 | % | 17 | % | |||
William W. Davis |
83 | % | 17 | % | |||
Joe A. Davis |
88 | % | 12 | % | |||
Michael J. Garberding |
89 | % | 11 | % | |||
Stan Golemon |
100 | % | — | ||||
Compensation Committee Report
Each member of Crosstex Energy GP, LLC's Compensation Committee is an independent director in accordance with NASDAQ standards. The Committee has reviewed and discussed with management the following section titled "Compensation Discussion and Analysis." Based upon its review and discussions, the Committee has recommended to the Board of Directors that the Compensation Discussion and Analysis be included in this Annual Report on Form 10-K.
Cecil
E. Martin (Chairman)
Rhys J. Best
D. Dwight Scott
82
Compensation Discussion and Analysis
The Charter of the Compensation Committee of the Board includes the following:
In order to compete effectively in our industry, it is critical that we attract, retain and motivate leaders that are best positioned to deliver financial and operational results that benefit our unitholders. It is the Committee's responsibility to design and administer compensation programs that achieve these goals, and to make recommendations to the Board to approve and adopt these programs.
Compensation Philosophy and Principles.
Our executive compensation is designed to attract, retain and motivate top-tier executives, and align their individual interests with the interests of the unitholders. The compensation of each of our executives is comprised of base salary, bonus opportunity and restricted equity grants or option awards under long term incentive plans. The Committee's philosophy is to generally target the 50th percentile of our Peer Group (discussed below) for base salaries, target the 50th percentile of our Peer Group for bonuses (but retain discretion to reduce or increase bonus amounts to address individual performance), and to provide executives the opportunity to earn long-term compensation, in the form of equity, in the top quartile relative to our Peer Group.
The Committee considers the following principles in determining the total compensation of the named executive officers:
83
Compensation Methodology.
Annually, the Committee reviews our executive compensation program in total and each element of compensation specifically. The review includes an analysis of the compensation practices of other companies in our industry, the competitive market for executive talent, the evolving demands of the business, specific challenges that we may face, and individual contributions to our partnership. The Committee recommends to the Board adjustments to the overall compensation program and to its individual components as the Committee determines necessary to achieve our goals. The Committee periodically retains consultants to assist in its review and to provide input regarding its compensation program and each of its elements.
In 2011, the Committee retained Meridian Compensation Partners, LLC ("Meridian") as its independent compensation consultant to conduct a compensation review and advise the Committee on certain matters relating to compensation programs applicable to the named executive officers and other employees of our general partner. Meridian provided information to the Committee regarding the compensation programs of the Crosstex entities in July of 2011.
With respect to compensation objectives and decisions regarding the named executive officers for fiscal 2011, the Committee has reviewed market data with respect to peer companies provided by Meridian in determining relevant compensation levels and compensation program elements for our named executive officers, including establishing their respective base salaries. In addition, Meridian has provided guidance on current industry trends and best practices to the Committee. The market data that we reviewed included the base salary, bonus structure, bonus methodology and short and long-term compensation elements paid to executive officers in similar positions at our peer companies. For 2011, we identified the following companies as "Peer Companies" for comparison purposes: Atlas Pipeline Partners, L.P., DCP Midstream Partners, L.P., Energy Transfer Partners, L.P., Enbridge Energy Partners, L.P., ONEOK Partners, L.P., Magellan Midstream Holdings, L.P., Targa Resources Partners LP, Copano Energy, LLC, Regency Energy Partners, L.P., MarkWest Energy Partners, L.P., Boardwalk Pipeline Partners, L.P., Atmos Energy Corporation, Western Gas Partners, L.P., El Paso Corporation, Pioneer Natural Resources Company, Plains Exploration & Production Company, Plains All American Pipeline, L.P., and Range Resources Corporation. We believe that this group of companies is representative of the industry in which we operate and the individual companies were chosen because of such companies' relative position in our industry, their relative size/market capitalization, the relative complexity of the business, similar organizational structure, competition for similar executive talent, and the named executive officers' roles and responsibilities.
In addition, the Committee has reviewed various relevant compensation surveys with respect to determining compensation for the named executive officers. In determining the long-term incentive component of compensation of the senior executives of Crosstex Energy GP, LLC (including the named executive officers), the Committee considers individual performance and relative equity holder benefit, the value of similar incentive awards to senior executives at comparable companies, awards made to the company's senior executives in past years, the value of all unvested awards held by the executive, and such other factors as the Committee deems relevant.
84
Elements of Compensation.
The primary elements of Crosstex Energy GP, LLC's compensation program are a combination of annual cash and long-term equity-based compensation. For fiscal year 2011, the principal elements of compensation for the named executive officers were the following:
The Committee reviews and makes recommendations regarding the mix of compensation, both among short and long-term compensation and cash and non-cash compensation, to establish structures that it believes are appropriate for each of the named executive officers. We believe that the mix of base salary, cash bonus awards, awards under the long-term incentive plan, retirement and health benefits and perquisites and other compensation fit our overall compensation objectives. We believe this mix of compensation provides competitive compensation opportunities to align and drive employee performance in support of our business strategies and to attract motivate and retain high quality talent with the skills and competencies that we require.
Base Salary. The Committee recommends base salaries for the named executive officers based on the historical salaries for services rendered to Crosstex Energy GP, LLC and its affiliates, market data and responsibilities of the named executive officers. Salaries are generally determined by considering the employee's performance and prevailing levels of compensation in areas in which a particular employee works. As discussed above, except with respect to the monthly reimbursement payment received from Crosstex Energy, Inc., all of the base salaries of the named executive officers were allocated to us by Crosstex Energy GP, LLC as general and administration expenses. The base salaries paid to our named executive officers during fiscal year 2011 are shown in the Summary Compensation Table on page 92. Effective January 1, 2012, the base salaries payable to our named executive officers were adjusted to equal the following: Barry E. Davis $500,000; William W. Davis $385,000; Joe A. Davis $335,000; Michael Garberding $290,000 and Stan Golemon $275,000.
Bonuses and Annual Cash Bonus Plan Awards. The Committee oversees the Annual Cash Bonus Plan and makes recommendations regarding cash bonuses to be awarded to each of the named executive officers. The Annual Cash Bonus Plan is applicable to all employees. Under the plan, bonuses are awarded to our named executive officers based on a formulaic approach that utilizes a performance metric that is tied to adjusted EBITDA (see page 47 for definition) as a guideline. The same adjusted EBITDA performance metric is used as a guideline for bonuses for all employees. The adjusted EBITDA goals are determined at the beginning of the year by the Board upon the recommendation of the Committee. Discretionary bonuses in addition to bonuses under the Annual Cash Bonus Plan are awarded from time to time by the Committee to reward outstanding service to the company.
The final amount of cash bonus for each named executive officer is determined at the discretion of the Committee, based upon the Committee's assessment of the executive's meeting his or her performance objectives established at the beginning of the performance period. These performance objectives include the quality of leadership within the named executive officer's assigned area of responsibility, the achievement of technical and professional proficiencies by the named executive officer, the execution of identified priority objectives by the named executive officer and the named executive officer's contribution to, and enhancement of, the desired company culture. These performance objectives are reviewed and evaluated by the Committee as a whole. All of our named executive officers met or exceeded their personal performance objectives for 2011.
85
The Committee believes that a portion of executive compensation must remain discretionary, and exercises its discretion with respect to cash bonus awards payable to its named executive officers. The Committee may exercise its discretion to reduce the amount calculated under the formula as described above, or to supplement the amount to reward or address extraordinary individual performance, challenges and opportunities not reasonably foreseeable at the beginning of a performance period, internal equities, and external competition or opportunities.
Target adjusted EBITDA is based upon a standard of reasonable market expectations and company performance, and varies from year to year. Several factors are reviewed in determining target adjusted EBITDA, including market expectations, internal forecasts and available investment opportunities. For 2011, our adjusted EBITDA levels for bonuses were $175.0 million for minimum bonuses, $205.0 million for target bonuses and $235.0 million for maximum bonuses. The 2011 plan provided for named executive officers to receive bonus payouts of 8% to 20% of base salary at the minimum threshold, payouts ranging from 40% to 100% of base salary at the target level and payouts ranging from 72% to 180% of base salary at the maximum level. We exceeded the target adjusted EBITDA in 2011.
For 2012, the Board has approved a continuation of the Annual Cash Bonus Plan with adjusted EBITDA as the performance metric. Under the 2012 plan, bonuses will be determined based on adjusted EBITDA levels ranging from a threshold of $200.0 million to a maximum of $250.0 million, with a target adjusted EBITDA of $225.0 million.
Long-Term Incentive Plans. Our officers and directors are eligible to participate in long-term incentive plans adopted by each of Crosstex Energy GP, LLC and Crosstex Energy, Inc. We believe that equity awards are instrumental in attracting, retaining, and motivating employees, and align the interests of our officers and directors with the interests of the unitholders. The Board, at the recommendation of the Committee, approves the grants of Partnership units or options to our executive officers. The Committee believes that equity compensation should comprise a significant portion of a named executive officer's compensation, and considers a number of factors when determining the grants to each individual. The considerations include: the general goal of allowing the named executive officer the opportunity to earn aggregate equity compensation (comprised of Partnership units and Crosstex Energy, Inc. stock) in the upper quartile of our Peer Group; the amount of unvested equity held by the individual executive; the executive's performance; and other factors as determined by the Committee.
A discussion of each plan follows:
Crosstex Energy GP, LLC Long-Term Incentive Plan. Crosstex Energy GP, LLC has adopted a long-term incentive plan for employees and directors of Crosstex Energy GP, LLC and its affiliates who perform services for us. The long-term incentive plan is administered by the Committee and permits the grant of awards covering an aggregate of 5,600,000 common units, which may be awarded in the form of restricted units or unit options. Of the 5,600,000 common units that may be awarded under the long-term incentive plan, 1,157,163 common units remain eligible for future grants by Crosstex Energy GP, LLC as of January 1, 2012. The long-term compensation structure is intended to align the employee's performance with long-term performance for our unitholders.
The Board in its discretion may terminate or amend the long-term incentive plan at any time with respect to any units for which a grant has not yet been made. The Board also has the right to alter or amend the long-term incentive plan or any part of the plan from time to time, including increasing the number of units that may be granted subject to the approval requirements of the exchange upon which the common units are listed at that time. However, no change in any outstanding grant may be made that would materially impair the rights of the participant without the consent of the participant.
86
The total value of the equity compensation granted to our named executive officers generally has been allocated 50% in restricted units of Crosstex Energy, L.P. and 50% in restricted stock of Crosstex Energy, Inc. For fiscal year 2011, Crosstex Energy GP, LLC granted 47,216, 30,186, 20,988, 26,833 and 14,616 restricted units to Barry E. Davis, William W. Davis, Joe A. Davis, Michael J. Garberding and
87
Stan Golemon, respectively. All performance and restricted units that we grant are charged against earnings according to FASB Accounting Standards Codification 718—"Compensation-Stock Compensation".
Crosstex Energy, Inc. Long-Term Incentive Plans. The Crosstex Energy, Inc. long-term incentive plans provide for the award of stock options and restricted stock (collectively, "Awards") for up to 7,190,000 shares of Crosstex Energy, Inc.'s common stock. As of January 1, 2012, approximately 1,642,396 shares remained available under the long-term incentive plans for future issuance to participants. A participant may not receive in any calendar year options relating to more than 250,000 shares of common stock. The maximum number of shares set forth above are subject to appropriate adjustment in the event of a recapitalization of the capital structure of Crosstex Energy, Inc. or reorganization of Crosstex Energy, Inc. Shares of common stock underlying Awards that are forfeited, terminated or expire unexercised become immediately available for additional Awards under the long-term incentive plan.
The Compensation Committee of Crosstex Energy, Inc.'s board of directors administers the long-term incentive plans. The administrator has the power to determine the terms of the options or other awards granted, including the exercise price of the options or other awards, the number of shares subject to each option or other award, the exercisability thereof and the form of consideration payable upon exercise. In addition, the administrator has the authority to grant waivers of long-term incentive plan terms, conditions, restrictions and limitations, and to amend, suspend or terminate the plan, provided that no such action may affect any share of common stock previously issued and sold or any option previously granted under the plan without the consent of the holder. Awards may be granted to employees, consultants and outside directors of Crosstex Energy, Inc.
The Compensation Committee of Crosstex Energy, Inc. will determine the type or types of Awards made under the plans and will designate the individuals who are to be the recipients of Awards. Each Award may be embodied in an agreement containing such terms, conditions and limitations as determined by the Compensation Committee of Crosstex Energy, Inc. Awards may be granted singly or in combination. Awards to participants may also be made in combination with, in replacement of, or as alternatives to, grants or rights under the plans or any other employee benefit plan of the company. All or part of an Award may be subject to conditions established by the Compensation Committee of Crosstex Energy, Inc., including continuous service with the company.
88
Crosstex Energy, Inc.'s board of directors may amend, modify, suspend or terminate the long-term incentive plans for the purpose of addressing any changes in legal requirements or for any other purpose permitted by law, except that no amendment that would impair the rights of any participant to any Award may be made without the consent of such participant, and no amendment requiring stockholder approval under any applicable legal requirements will be effective until such approval has been obtained. No incentive stock options may be granted after the tenth anniversary of the effective date of the plan.
In the event of any corporate transaction such as a merger, consolidation, reorganization, recapitalization, separation, stock dividend, stock split, reverse stock split, split up, spin-off or other distribution of stock or property of Crosstex Energy, Inc., the Crosstex Energy, Inc. board of directors shall substitute or adjust, as applicable: (i) the number of shares of common stock reserved under the plans and the number of shares of common stock available for issuance pursuant to specific types of Awards as described in the plans, (ii) the number of shares of common stock covered by outstanding Awards, (iii) the grant price or other price in respect of such Awards and (iv) the appropriate fair market value and other price determinations for such Awards, in order to reflect such transactions, provided that such adjustments shall only be such that are necessary to maintain the proportionate interest of the holders of Awards and preserve, without increasing, the value of such Awards.
The total value of the equity compensation granted to our executive officers generally has been awarded 50% in restricted units of Crosstex Energy, L.P. and 50% in restricted stock of Crosstex Energy, Inc. In addition, our executive officers may receive additional grants of equity compensation in certain circumstances, such as promotions. For fiscal year 2011, Crosstex Energy, Inc. granted 75,067, 47,723, 33,609, 41,604 and 23,085 restricted shares to Barry E. Davis, William W. Davis, Joe A. Davis, Michael J. Garberding and Stan Golemon, respectively. All performance and restricted shares that we grant are charged against earnings according to FASB ASC 718.
Retirement and Health Benefits. Crosstex Energy GP, LLC offers a variety of health and welfare and retirement programs to all eligible employees. The named executive officers are generally eligible for the same programs on the same basis as other employees of Crosstex Energy GP, LLC. Crosstex Energy GP, LLC maintains a tax-qualified 401(k) retirement plan that provides eligible employees with an opportunity to save for retirement on a tax deferred basis. In 2011, Crosstex Energy GP, LLC matched 100% of every dollar contributed for contributions of up to 6% of salary (not to exceed the maximum amount permitted by law) made by eligible participants. The retirement benefits provided to the named executive officers were allocated to us as general and administration expenses. Our executive officers are also eligible to participate in any additional retirement and health benefits available to our other employees.
Perquisites and Other Compensation. Crosstex Energy GP, LLC generally does not pay for perquisites for any of the named executive officers, other than payment of dues, sales tax and related expenses for membership in an industry related private lunch club (totaling less than $2,500 per year per person).
89
Employment and Severance Agreements
As of December 31, 2011, Barry E. Davis, William W. Davis, and Joe A. Davis had entered into employment agreements with Crosstex Energy GP, LLC with substantially similar provisions. Each of the employment agreements had a term of one year that automatically extended such that the remaining term of the agreements was not less than one year. The employment agreements included obligations not to disclose confidential information and also provided for a noncompetition period that continued for one year after termination of employment or the date on which the employee was no longer entitled to receive payments under the employment agreement. As of December 31, 2011, Michael Garberding and Stan Golemon were participants in the Crosstex Energy Services, L.P. Severance Pay Plan (the "Severance Plan"), which provides substantially similar severance benefits as the employment agreements described above if employment is terminated without cause or in the event of a change in control (as defined in the Severance Plan). Other members of senior management and certain other key leaders also participated in the Severance Plan.
As of the date of this filing, all of our named executive officers and certain members of senior management have entered into new employment agreements with Crosstex Energy GP, LLC. These employment agreements are substantially similar with certain exceptions which are set forth in the following discussion. The term of the agreement for Barry E. Davis is three years, for William W. Davis, Joe A. Davis and Michael J. Garberding is two years, and for the other members of senior management is one year with automatic extensions such that the remaining term of the agreements will not be less than one year. The employment agreements include obligations not to disclose confidential information and also provide for a noncompetition period that will continue after the termination of the employee's employment for one year for Barry E. Davis and for six months for the other executive officers and members of senior management. During the noncompetition period, the employees are generally prohibited from engaging in any business that competes with us or our affiliates in areas in which we conduct business as of the date of termination and from soliciting or inducing any of our employees to terminate their employment with us. The employment agreements provide a clawback of benefits if the confidential information or noncompetition provisions are breached by a terminated employee following a termination date. In the event of a termination, the terminated employee is required to execute a general release of the company in order to receive any benefits under the employment agreements. Michael J. Garberding, Stan Golemon, and the other members of senior management that have entered into employment agreements are no longer participants in the Severance Plan.
Under the new employment agreements, employees receive their annual base salary and are eligible to participate in cash and equity incentive bonus programs based on criteria established by the Board. If an employee's employment is terminated without cause (as defined in the employment agreement), or is terminated by the employee for good reason (as defined in the employment agreement), or is terminated due to the employee's death or disability, the employment agreement provides that the employee will be paid (i) his or her base salary up to the date of termination, (ii) a pro-rata portion of the target amount of his or her annual bonus up to the date of termination, (iii) an amount equal to the cost to the employee for the premium for health insurance continuation under COBRA for an 18-month period, (iv) such other fringe benefits (other than any bonus, severance pay benefit, participation in the company's 401(k) employee benefit plan, or medical insurance benefit) normally provided to employees of the company as earned up to the date of termination, and (v) a lump sum severance amount equal to one year (two years in the case of the Chief Executive Officer) of the employee's then current base salary, plus one times (two times in the case of the Chief Executive Officer) the target annual bonus for the year of termination.
90
Potential Payments Upon Termination or a Change of Control.
As described above, the new employment agreements for our named executive officers and certain members of senior management provide for payment to be made to them under certain circumstances upon the termination of their employment. In connection with determining the type, amount and timing of the payment to be made upon the termination of employment under the employment agreements, the Committee reviewed available market information and identified those payments and provision that the Committee deemed to be appropriate for inclusion in the employment agreements. In the event of a termination by the Company without cause, or a termination by the employee for good reason, within 120 days prior to or one year following a change of control (as defined in the employment agreements), Barry E. Davis would be paid a lump sum severance amount equal to three years of his then current base salary plus three times the target annual bonus for the year of termination, and William W. Davis, Joe A. Davis and Michael J. Garberding would be paid a lump sum severance amount equal to two years of his then current base salary plus two times the target annual bonus for the year of termination.
With respect to the long-term incentive plans, the amounts to be received by our named executive officers in the event of a change in control (as defined in the long-term incentive plans) will be automatically determined based on the number of unvested stock or unit awards or restricted stock or units held by a named executive officer at the time of a change in control. The terms of the long-term incentive plans were determined based on past practice and the Committee's understanding of similar plans utilized by public companies generally at the time we adopted such plans. The determination of the reasonable consequences of a change of control is periodically reviewed by the Committee.
Upon a change in control, all granted units will automatically vest and become payable or exercisable, as the case may be, in full and any restricted periods or performance criteria shall terminate or be deemed to have been achieved at the maximum level.
The potential payments that may be made to the named executive officers upon a termination of their employment or in connection with a change of control as of December 31, 2011 are set forth in the table in the section below entitled Payments Upon Termination or Change in Control.
Role of Executive Officers in Executive Compensation.
The Board, upon recommendation of the Committee, determines the compensation payable to each of the named executive officers. None of the named executive officers serves as a member of the Committee. Barry E. Davis, the Chief Executive Officer, reviews his recommendations regarding the compensation of his leadership team with the Committee, including specific recommendations for each element of compensation for the named executive officers. Barry E. Davis does not make any recommendations regarding his personal compensation.
Tax and Accounting Considerations.
The equity compensation grant policies of the Crosstex entities have been impacted by the implementation of FASB ASC 718, which we adopted effective January 1, 2006. Under this accounting pronouncement, we are required to value unvested unit options granted prior to our adoption of FASB ASC 718 under the fair value method and expense those amounts in the income statement over the stock option's remaining vesting period. As a result, the Crosstex entities currently intend to discontinue grants of unit option and stock option awards and instead grant restricted unit and restricted stock awards to the named executive officers and other employees. The Crosstex entities have structured the compensation program to comply with Internal Revenue Code Section 409A. If an executive is entitled to nonqualified deferred compensation benefits that are subject to Section 409A, and such benefits do not comply with Section 409A, then the benefits are taxable in the first year they are not subject to a substantial risk of forfeiture. In such case, the service provider is subject to regular federal income tax, interest and an additional federal income tax of 20% of the benefit includible in income. None of the named executive officers or other employees had non-performance based compensation paid in excess of the $1.0 million tax deduction limit contained in Internal Revenue Code Section 162(m).
91
Summary Compensation Table
The following table sets forth certain compensation information for our named executive officers.
Name and Principal Position
|
Year | Salary ($) |
Bonus ($)(1) |
Stock Awards ($)(2) |
Option Awards ($) |
Non-Equity Incentive Plan Compensation ($) |
Change in Pension value and Nonqualified Deferred Compensation Earnings ($) |
All Other Compensation ($) |
Total ($) |
|||||||||||||||||||
|---|---|---|---|---|---|---|---|---|---|---|---|---|---|---|---|---|---|---|---|---|---|---|---|---|---|---|---|---|
Barry E. Davis |
2011 | 460,000 | 545,882 | 1,418,773 | 195,958 | (3) | 2,620,613 | |||||||||||||||||||||
President and Chief Executive |
2010 | 435,000 | 427,970 | — | — | — | — | 71,725 | 934,695 | |||||||||||||||||||
Officer |
2009 | 435,000 | 435,000 | 1,117,712 | — | — | — | 45,327 | 2,033,039 | |||||||||||||||||||
William W. Davis |
2011 |
352,692 |
376,675 |
918,838 |
151,644 |
(4) |
1,799,849 |
|||||||||||||||||||||
Executive Vice President and |
2010 | 330,000 | 280,315 | — | — | — | — | 63,083 | 673,398 | |||||||||||||||||||
Chief Opearating Officer |
2009 | 315,000 | 315,000 | 983,587 | — | — | — | 37,120 | 1,650,707 | |||||||||||||||||||
Joe A. Davis |
2011 |
315,000 |
242,992 |
620,948 |
145,004 |
(5) |
1,323,944 |
|||||||||||||||||||||
Executive Vice President and |
2010 | 300,000 | 254,832 | — | — | — | — | 62,181 | 617,013 | |||||||||||||||||||
General Counsel |
2009 | 285,000 | 385,000 | 983,587 | — | — | — | 32,370 | 1,685,957 | |||||||||||||||||||
Michael J. Garberding |
2011 |
256,538 |
197,894 |
848,713 |
88,124 |
(6) |
1,391,269 |
|||||||||||||||||||||
Senior Vice President and Chief |
2010 | 225,385 | 106,084 | 240,157 | — | — | — | 31,811 | 603,437 | |||||||||||||||||||
Financial Officer |
2009 | 198,000 | 117,000 | 312,962 | — | — | — | 18,274 | 646,236 | |||||||||||||||||||
Stan Golemon |
2011 |
249,615 |
124,808 |
445,253 |
80,363 |
(7) |
900,039 |
|||||||||||||||||||||
Senior Vice President |
2010 | 230,000 | 111,412 | — | — | — | — | 32,023 | 373,435 | |||||||||||||||||||
|
2009 | 220,000 | 132,000 | 447,087 | 18,820 | 817,907 | ||||||||||||||||||||||
92
Grants of Plan-Based Awards for Fiscal Year 2011 Table
The following tables provide information concerning each grant of an award made to a named executive officer for fiscal year 2011, including, but not limited to, awards made under the Crosstex Energy GP, LLC Long-Term Incentive Plan and the Crosstex Energy, Inc. Long-Term Incentive Plans.
CROSSTEX ENERGY GP, LLC—GRANTS OF PLAN-BASED AWARDS
Name
|
Grant Date | Number of Units(1) |
Grant Date Fair Value of Unit Awards |
|||||||
|---|---|---|---|---|---|---|---|---|---|---|
Barry E. Davis |
1/12/2011 | 31,944 | $ | 458,077 | ||||||
Barry E. Davis |
9/6/2011 | 15,272 | $ | 242,061 | ||||||
William W. Davis |
1/12/2011 | 17,969 | $ | 257,675 | ||||||
William W. Davis |
9/6/2011 | 12,217 | $ | 193,639 | ||||||
Joe A. Davis |
1/12/2011 | 16,406 | $ | 235,262 | ||||||
Joe A. Davis |
9/6/2011 | 4,582 | $ | 72,625 | ||||||
Michael J. Garberding |
1/12/2011 | 8,507 | $ | 121,990 | ||||||
Michael J. Garberding |
9/6/2011 | 18,326 | $ | 290,467 | ||||||
Stan Golemon |
1/12/2011 | 8,507 | $ | 121,990 | ||||||
Stan Golemon |
9/6/2011 | 6,109 | $ | 96,828 | ||||||
CROSSTEX ENERGY, INC—GRANTS OF PLAN-BASED AWARDS
Name
|
Grant Date | Number of Shares(1) |
Grant Date Fair Value of Shares Awards |
|||||||
|---|---|---|---|---|---|---|---|---|---|---|
Barry E. Davis |
1/12/2011 | 51,919 | $ | 456,368 | ||||||
Barry E. Davis |
9/6/2011 | 23,148 | $ | 262,267 | ||||||
William W. Davis |
1/12/2011 | 29,204 | $ | 256,703 | ||||||
William W. Davis |
9/6/2011 | 18,519 | $ | 209,820 | ||||||
Joe A. Davis |
1/12/2011 | 26,665 | $ | 234,385 | ||||||
Joe A. Davis |
9/6/2011 | 6,944 | $ | 78,676 | ||||||
Michael J. Garberding |
1/12/2011 | 13,826 | $ | 121,531 | ||||||
Michael J. Garberding |
9/6/201 | 27,778 | $ | 314,724 | ||||||
Stan Golemon |
1/12/2011 | 13,826 | $ | 121,531 | ||||||
Stan Golemon |
9/6/201 | 9,259 | $ | 104,904 | ||||||
|
||||||||||
93
Outstanding Equity Awards at Fiscal Year-End Table for Fiscal Year 2011
The following tables provide information concerning all outstanding equity awards made to a named executive officer as of December 31, 2011, including, but not limited to, awards made under the Crosstex Energy GP, LLC Long-Term Incentive Plan and the Crosstex Energy, Inc. Long-Term Incentive Plans.
CROSSTEX ENERGY GP, LLC—OUTSTANDING EQUITY AWARDS AT FISCAL YEAR-END
| |
Option Awards | Stock Awards | ||||||||||||||||||||||||||
|---|---|---|---|---|---|---|---|---|---|---|---|---|---|---|---|---|---|---|---|---|---|---|---|---|---|---|---|---|
Name
|
Number of Securities Underlying Unexercised Options (#) Exercisable |
Number of Securities Underlying Unexercised Options (#) Unexercisable |
Equity Incentive Plan Awards: Number of Securities Underlying Unexercised Unearned Options (#) |
Option Exercise Price ($) |
Option Expiration Date |
Number of Units That Have Not Vested (#) |
Market Value of Units That Have Not Vested ($)(2) |
Equity Incentive Plan Awards: Number of Unearned Shares, Units or Other Rights That Have Not Vested (#) |
Equity Incentive Plan Awards: Market or Payout Value of Unearned Shares, Units or Other Rights That Have Not Vested ($) |
|||||||||||||||||||
Barry E. Davis |
— | — | — | — | — | 69,445 | (1) | 1,126,398 | ||||||||||||||||||||
|
31,944 | (3) | 518,132 | |||||||||||||||||||||||||
|
15,272 | (4) | 247,712 | |||||||||||||||||||||||||
William W. Davis |
— |
— |
— |
— |
— |
61,112 |
(1) |
991,237 |
||||||||||||||||||||
|
17,969 | (3) | 291,457 | |||||||||||||||||||||||||
|
12,217 | (4) | 198,160 | |||||||||||||||||||||||||
Joe A. Davis |
— |
— |
— |
— |
— |
61,112 |
(1) |
991,237 |
||||||||||||||||||||
|
16,406 | (3) | 266,105 | |||||||||||||||||||||||||
|
4,582 | (4) | 74,320 | |||||||||||||||||||||||||
Michael J. Garberding |
— |
— |
— |
— |
— |
19,445 |
(1) |
315,398 |
— |
— |
||||||||||||||||||
|
8,284 | (5) | 134,366 | |||||||||||||||||||||||||
|
8,507 | (3) | 137,984 | |||||||||||||||||||||||||
|
18,326 | (4) | 297,248 | |||||||||||||||||||||||||
Stan Golemon |
— |
— |
— |
— |
— |
27,778 |
(1) |
450,559 |
— |
— |
||||||||||||||||||
|
8,507 | (3) | 137,984 | |||||||||||||||||||||||||
|
6,109 | (4) | 99,088 | |||||||||||||||||||||||||
94
CROSSTEX ENERGY, INC.—OUTSTANDING EQUITY AWARDS AT FISCAL YEAR-END
| |
Option Awards | Stock Awards | ||||||||||||||||||||||||||
|---|---|---|---|---|---|---|---|---|---|---|---|---|---|---|---|---|---|---|---|---|---|---|---|---|---|---|---|---|
Name
|
Number of Securities Underlying Unexercised Options (#) Exercisable |
Number of Securities Underlying Unexercised Options (#) Unexercisable |
Equity Incentive Plan Awards: Number of Securities Underlying Unexercised Unearned Options (#) |
Option Exercise Price ($) |
Option Expiration Date |
Number of Shares or Units That Have Not Vested (#) |
Market Value of Shares or Units That Have Not Vested ($)(2) |
Equity Incentive Plan Awards: Number of Unearned Shares, Units or Other Rights That Have Not Vested (#) |
Equity Incentive Plan Awards: Market or Payout Value of Unearned Shares, Units or Other Rights That Have Not Vested ($) |
|||||||||||||||||||
Barry E. Davis |
— | — | — | — | — | 69,445 | (1) | 877,785 | ||||||||||||||||||||
|
51,919 | (3) | 656,256 | |||||||||||||||||||||||||
|
23,148 | (4) | 292,591 | |||||||||||||||||||||||||
William W. Davis |
— |
— |
— |
— |
— |
61,112 |
(1) |
772,456 |
||||||||||||||||||||
|
29,204 | (3) | 369,139 | |||||||||||||||||||||||||
|
18,519 | (4) | 234,080 | |||||||||||||||||||||||||
Joe A. Davis |
— |
— |
— |
— |
— |
61,112 |
(1) |
772,456 |
||||||||||||||||||||
|
26,665 | (3) | 337,046 | |||||||||||||||||||||||||
|
6,944 | (4) | 87,772 | |||||||||||||||||||||||||
Michael J. Garberding |
— |
— |
— |
— |
— |
19,445 |
(1) |
245,785 |
— |
— |
||||||||||||||||||
|
11,385 | (5) | 143,906 | |||||||||||||||||||||||||
|
13,826 | (3) | 174,761 | |||||||||||||||||||||||||
|
27,778 | (4) | 351,114 | |||||||||||||||||||||||||
Stan Golemon |
— |
— |
— |
— |
— |
27,778 |
(1) |
351,114 |
— |
— |
||||||||||||||||||
|
13,826 | (3) | 174,761 | |||||||||||||||||||||||||
|
9,259 | (4) | 117,034 | |||||||||||||||||||||||||
95
Units and Shares Vested Table for Fiscal Year 2011
The following table provides information related to the vesting of restricted units and restricted shares during fiscal year ended 2011.
| |
Crosstex Energy, L.P. Unit Awards | Crosstex Energy, Inc. Share Awards | |||||||||||
|---|---|---|---|---|---|---|---|---|---|---|---|---|---|
Name
|
Number of Units Acquired on Vesting |
Value Realized on Vesting |
Number of Shares Acquired on Vesting |
Value Realized on Vesting |
|||||||||
Barry E. Davis |
53,318 | $ | 816,129 | (1) | 52,346 | $ | 488,812 | (2) | |||||
William W. Davis |
39,532 | $ | 592,601 | (3) | 39,063 | $ | 358,180 | (4) | |||||
Joe A. Davis |
38,677 | $ | 578,066 | (5) | 38,253 | $ | 349,853 | (6) | |||||
Michael J. Garberding |
19,190 | $ | 305,602 | (7) | 20,326 | $ | 202,854 | (8) | |||||
Stan Golemon |
20,829 | $ | 326,865 | (9) | 20,389 | $ | 197,222 | (10) | |||||
96
Payments Upon Termination or Change of Control
The following tables show potential payments that would have been made to the named executive officers upon a termination of their employment or in connection with a change of control as of December 31, 2011. The first table describes potential payments under the employment agreement or severance plan that was in effect with respect to each of the named executive officers as of December 31, 2011. The second table describes potential payments under the employment agreements that were entered into by the named executive officers after December 31, 2011 and before the date of this filing and that are discussed in the section above entitled Employment and Severance Agreements.
97
Payments under Employment Agreements or Severance Plan as of December 31, 2011
Name and Principal Position
|
Severance Payment Under Employment Agreements Upon Termination Other Than For Cause or Without Good Reason ($)(1) |
Health Care Benefits Under Employment Agreements Upon Termination Other Than For Cause or Without Good Reason ($)(2) |
Severance Payment and Health Care Benefits Under Employment Agreements Upon Termination For Cause or Without Good Reason ($)(3) |
Severance Payment Under Employment Agreements Upon Change of Control ($)(4) |
Acceleration of Vesting Under Incentive Plans Upon Change of Control ($)(5) |
|||||||||||
|---|---|---|---|---|---|---|---|---|---|---|---|---|---|---|---|---|
| Barry E. Davis | 1,005,882 | — | — | 1,005,882 | 3,718,874 | |||||||||||
President and Chief |
||||||||||||||||
Executive Officer |
||||||||||||||||
William W. Davis |
729,367 |
— |
— |
729,367 |
2,856,529 |
|||||||||||
Executive Vice President |
||||||||||||||||
and Chief Operating |
||||||||||||||||
Officer |
||||||||||||||||
Joe A. Davis |
557,992 |
— |
— |
557,992 |
2,528,936 |
|||||||||||
Executive Vice President |
||||||||||||||||
and General Counsel |
||||||||||||||||
Michael J. Garberding |
454,432 |
13,776 |
— |
454,432 |
1,800,562 |
|||||||||||
Senior Vice President |
||||||||||||||||
and Chief Financial |
||||||||||||||||
Officer |
||||||||||||||||
Stan Golemon |
374,423 |
8,112 |
— |
374,423 |
1,330,540 |
|||||||||||
Senior Vice President |
||||||||||||||||
97
Payments under Employment Agreements Entered Into After December 31, 2011
Name and Principal Position
|
Severance Payment Under Employment Agreements Upon Termination Other Than For Cause or Without Good Reason ($)(1) |
Health Care Benefits Under Employment Agreements Upon Termination Other Than For Cause or Without Good Reason ($)(2) |
Severance Payment and Health Care Benefits Under Employment Agreements Upon Termination For Cause or Without Good Reason ($)(3) |
Severance Payment Under Employment Agreements Upon Termination And Change of Control ($)(4) |
Acceleration of Vesting Under Incentive Plans Upon Change of Control ($)(5) |
|||||||||||
|---|---|---|---|---|---|---|---|---|---|---|---|---|---|---|---|---|
| Barry E. Davis | 2,557,646 | 20,670 | — | 3,563,528 | 3,718,874 | |||||||||||
President and Chief |
||||||||||||||||
Executive Officer |
||||||||||||||||
William W. Davis |
1,106,042 |
20,670 |
— |
1,835,409 |
2,856,529 |
|||||||||||
Executive Vice President |
||||||||||||||||
and Chief Operating |
||||||||||||||||
Officer |
||||||||||||||||
Joe A. Davis |
800,984 |
20,670 |
— |
1,358,976 |
2,528,936 |
|||||||||||
Executive Vice President |
||||||||||||||||
and General Counsel |
||||||||||||||||
Michael J. Garberding |
652,326 |
20,670 |
— |
1,106,758 |
1,800,562 |
|||||||||||
Senior Vice President |
||||||||||||||||
and Chief Financial |
||||||||||||||||
Officer |
||||||||||||||||
Stan Golemon |
499,231 |
12,185 |
— |
873,654 |
1,330,543 |
|||||||||||
Senior Vice President |
||||||||||||||||
98
Compensation of Directors for Fiscal Year 2011
Name
|
Fees Earned or Paid in Cash ($) |
Unit Awards(1) ($) |
All Other Compensation(2) ($) |
Total ($) |
|||||||||
|---|---|---|---|---|---|---|---|---|---|---|---|---|---|
Rhys J. Best |
157,667 | 97,797 | 8,972 | 264,436 | |||||||||
Leldon E. Echols |
61,500 | 73,779 | 3,365 | 138,644 | |||||||||
Bryan H. Lawrence |
— | — | |||||||||||
Sheldon B. Lubar |
48,125 | 73,779 | 3,365 | 125,269 | |||||||||
Cecil E. Martin |
59,906 | 73,779 | 3,365 | 137,050 | |||||||||
Kyle D. Vann |
78,000 | 73,352 | 6,729 | 158,081 | |||||||||
D. Dwight Scott |
138,504 | — | 138,504 | ||||||||||
Each director of Crosstex Energy GP, LLC who is not an employee of Crosstex Energy GP, LLC (other than Mr. Lawrence) is paid an annual retainer fee of $50,000, except for Mr. Best who, as Chairman, is paid an annual retainer fee of $100,000 and Mr. Scott who receives an annual retainer fee of $125,000 (and does not receive any equity related compensation). Directors do not receive an attendance fee for each regularly scheduled quarterly board meeting, but are paid $1,500 for each additional meeting that they attend. Also, an attendance fee of $1,500 is paid to each director for each committee meeting that is attended, other than the Audit Committee, which pays a fee of $3,000 per meeting. The respective Chairs of each committee receive the following annual fees: Audit—$7,500, Compensation—$7,500, Governance—$5,000, Finance—$5,000, and Conflicts—$2,500. Directors are also reimbursed for related out-of-pocket expenses. Barry E. Davis, as an executive officer of Crosstex Energy GP, LLC, is otherwise compensated for his services and therefore receives no separate compensation for his service as a director. For directors that serve on both the boards of Crosstex Energy GP, LLC and Crosstex Energy, Inc., the above listed fees are generally allocated 75% to us and 25% to Crosstex Energy, Inc., except in the case for service on the Audit Committee, where the Chair is paid a separate fee for each entity and meeting fees are split 50% to each entity. The Governance Committee annually reviews and makes recommendations to the Board regarding the compensation of
99
the directors. Mr. Lawrence received no compensation in 2011. See related party transactions for a discussion of compensation for Mr. Scott.
Compensation Committee Interlocks and Insider Participation
During the fiscal year ended 2011, the Committee was composed of Cecil E. Martin, Rhys J. Best and D. Dwight Scott. No member of the Committee during fiscal 2011 was a current or former officer or employee of Crosstex Energy GP, LLC or had any relationship requiring disclosure by us under Item 404 of Regulation S-K as adopted by the SEC. None of Crosstex Energy GP, LLC's executive officers served on the board of directors or the compensation committee of any other entity, for which any officers of such other entity served either on the Board or the Committee.
The Compensation Committee of Crosstex Energy GP, LLC held three meetings during fiscal year 2011. Each member attended 100% of the meetings.
Board Leadership Structure and Risk Oversight
The Board has no policy that requires that the positions of the Chairman of the Board and the Chief Executive Officer be separate or that they be held by the same individual. The Board believes that this determination should be based on circumstances existing from time to time, including the current business environment and any specific challenges facing the business and the composition, skills, and experience of the board and its members. At this time, positions of Chairman of the Board and the Chief Executive Officer of Crosstex Energy GP, LLC are not held by the same individual. Rhys J. Best serves as the Chairman of the Board and Barry E. Davis serves as the President and Chief Executive Officer. The Board believes this is the most appropriate structure for the Partnership at this time because it makes the best use of Mr. Best's skills and experience, including his prior service as the Chief Executive Officer of a large public company, while enhancing Mr. Davis' ability to lead decisively and communicate our message and strategy clearly and consistently to our unitholders, employees and customers.
The Board is responsible for risk oversight. Management has implemented internal processes to identify and evaluate the risks inherent in the company's business, and to assess the mitigation of those risks. The Audit Committee has reviewed the risk assessments with management and provided reports to the Board regarding the internal risk assessment processes, the risks identified, and the mitigation strategies planned or in place to address the risks in the business. The Board and the Audit Committee each provide insight into the issues, based on the experience of their members, and provide constructive challenges to management's assumptions and assertions.
100
Item 12. Security Ownership of Certain Beneficial Owners and Management and Related Unitholder Matters
Crosstex Energy, L.P. Ownership
The following table shows the beneficial ownership of units of Crosstex Energy, L.P. as of February 14, 2012, held by:
Percentages reflected in the table are based upon a total of 50,863,334 common units and 14,705,882 Series A Convertible Preferred units as of February 14, 2012.
Name of Beneficial Owner(1)
|
Common Units Beneficially Owned |
Percentage of Common Units Beneficially Owned |
Series A Convertible Preferred Units Beneficially Owned |
Percentage of Preferred Units Beneficially Owned |
Total Units Beneficially Owned |
Percentage of Total Units Beneficially Owned |
|||||||||||||
|---|---|---|---|---|---|---|---|---|---|---|---|---|---|---|---|---|---|---|---|
Crosstex Energy, Inc. |
16,414,830 | 32.27 | % | — | — | 16,414,830 | 25.03 | % | |||||||||||
GSO Crosstex Holdings LLC(2) |
1,002,800 | 1.97 | % | 14,705,882 | 100.00 | % | 15,708,682 | 23.96 | % | ||||||||||
Swank Capital, L.L.C.(3) |
3,367,443 | 6.62 | % | — | — | 3,367,443 | 5.14 | % | |||||||||||
Barry E. Davis(4) |
315,938 | * | — | — | 315,938 | * | |||||||||||||
William W. Davis(4) |
78,585 | * | — | — | 78,585 | * | |||||||||||||
Joe A. Davis(4) |
37,472 | * | — | — | 37,472 | * | |||||||||||||
Stan Golemon(4) |
25,861 | * | — | — | 25,861 | * | |||||||||||||
Michael J. Garberding(4) |
18,747 | * | — | — | 18,747 | * | |||||||||||||
Rhys J. Best(5) |
95,825 | * | — | — | 95,825 | * | |||||||||||||
Leldon E. Echols(4) |
14,837 | * | — | — | 14,837 | * | |||||||||||||
Bryan H. Lawrence(4) |
— | — | — | — | — | — | |||||||||||||
Sheldon B. Lubar(4) |
— | * | — | — | — | * | |||||||||||||
Cecil E. Martin(4) |
23,247 | * | — | — | 23,247 | * | |||||||||||||
D. Dwight Scott |
— | — | — | — | — | — | |||||||||||||
Kyle D. Vann |
66,673 | * | — | — | 66,673 | * | |||||||||||||
All directors and executive officers as a group (12 persons) |
677,185 | 1.33 | % | — | — | 677,185 | 1.03 | % | |||||||||||
101
Holdings L.L.C., GSO Special Situation Fund LP, and GSO Special Situations Overseas Master Fund Ltd.
Crosstex Energy, Inc. Ownership
The following table shows the beneficial ownership of Crosstex Energy, Inc. as of February 14, 2012, held by:
Percentages reflected in the table below are based on a total of 47,389,723 shares of common stock outstanding as of February 14, 2012.
Name of Beneficial Owner(1)
|
Shares of Common Stock |
Percent | |||||
|---|---|---|---|---|---|---|---|
Harbinger Group, Inc.(2) |
7,000,000 | 14.77 | % | ||||
Chickasaw Capital Management, LLC(3) |
2,960,595 | 6.25 | % | ||||
Dimensional Fund Advisors LP(3) |
2,721,730 | 5.74 | % | ||||
Vanguard Group, Inc.(3) |
2,369,334 | 5.00 | % | ||||
Lubar Nominees(4) |
1,865,162 | 3.96 | % | ||||
Lubar Equity Fund, LLC(4) |
535,471 | 1.14 | % | ||||
Lubar Family Foundation, Inc(4) |
127,800 | * | |||||
Barry E. Davis |
1,655,919 | 3.51 | % | ||||
William W. Davis |
218,945 | * | |||||
Joe A. Davis |
85,194 | * | |||||
Stan Golemon |
24,560 | * | |||||
Michael J. Garberding |
20,066 | * | |||||
James C. Crain(5) |
37,951 | * | |||||
Leldon E. Echols |
15,726 | * | |||||
Bryan H. Lawrence |
1,720,267 | 3.65 | % | ||||
Sheldon B. Lubar(4) |
29,641 | * | |||||
Cecil E. Martin |
5,726 | * | |||||
Robert F. Murchison(6) |
260,803 | * | |||||
All directors and executive officers as group (11 persons) |
6,604,231 | 14.00 | % | ||||
102
York 10022; Chickasaw Capital Management, LLC which is 6075 Poplar Ave., Suite 402 Memphis, TN 38119; Dimensional Fund Advisors LP which is Palisades West, Bldg. One, 6300 Bee Cave Road, Austin, Texas 78746; Vanguard Group, Inc. which is 100 Vanguard Blvd., Malvern, PA 19355; and Mr. Lawrence, which is 410 Park Avenue, New York, New York 10022.
Beneficial Ownership of General Partner Interest
Crosstex Energy GP, LLC owns all of our 2% general partner interest and all of our incentive distribution rights. Crosstex Energy GP, LLC is 100% owned by Crosstex Energy, Inc.
Equity Compensation Plan Information
Plan Category
|
Number of Securities to be Issued Upon Exercise of Outstanding Options, Warrants, and Rights |
Weighted-Average Price of Outstanding Options, Warrants and Rights |
Number of Securities Remaining Available for Future Issuance Under Equity Compensation Plan (Excluding Securities Reflected in Column(a)) |
|||||||
|---|---|---|---|---|---|---|---|---|---|---|
| |
(a) |
(b) |
(c) |
|||||||
Equity Compensation Plans Approved By Security Holders(1) |
1,401,418 | (2) | $ | 6.99 | (3) | 1,157,163 | ||||
Equity Compensation Plans Not Approved By Security Holders |
N/A | N/A | N/A | |||||||
Item 13. Certain Relationships and Related Transactions and Director Independence
Our General Partner
Our operations and activities are managed by, and our officers are employed by, the Operating Partnership. Our general partner does not receive any management fee or other compensation in
103
connection with its management of our business, but it is reimbursed for all direct and indirect expenses incurred on our behalf.
Our general partner owns a 2.0% general partner interest in us and all of our incentive distribution rights. Our general partner is entitled to receive incentive distributions if the amount we distribute with respect to any quarter exceeds levels specified in our partnership agreement. Under the quarterly incentive distribution provisions, generally our general partner is entitled to 13.0% of amounts we distribute in excess of $0.25 per unit, 23.0% of the amounts we distribute in excess of $0.3125 per unit and 48.0% of amounts we distribute in excess of $0.375 per unit.
Relationship with Crosstex Energy, Inc.
General. Crosstex Energy, Inc. ("CEI") owns 16,414,830 common units, representing approximately 25.0% limited partnership interest in us as of December 31, 2011. Our general partner owns a 2.0% general partner interest in us and the incentive distribution rights. Our general partner's ability, as general partner, to manage and operate Crosstex Energy, L.P. and CEI's ownership in us effectively gives our general partner the ability to veto some of our actions and to control our management. CEI pays us for administrative and compensation costs that we incur on its behalf. During 2011, this cost reimbursement was approximately $0.07 million per month.
Omnibus Agreement. Concurrent with the closing of our initial public offering, we entered into an agreement with CEI and our general partner that governs potential competition among us and the other parties to the agreement. CEI agreed, for so long as our general partner or any affiliate of CEI is a general partner of our Partnership, not to engage in the business of gathering, transmitting, treating, processing, storing and marketing of natural gas and the transportation, fractionation, storing and marketing of NGLs unless it first offers us the opportunity to engage in this activity or acquire this business, and the Board , with the concurrence of its conflicts committee, elects to cause us not to pursue such opportunity or acquisition. In addition, CEI has the ability to purchase a business that has a competing natural gas gathering, transmitting, treating, processing and producer services business if the competing business does not represent the majority in value of the business to be acquired and CEI offers us the opportunity to purchase the competing operations following their acquisition. Except as provided above, CEI and its controlled affiliates are not prohibited from engaging in activities in which they compete directly with us.
Related Party Transactions
Reimbursement of Costs by CEI. CEI paid us $0.8 million, $0.8 million and $0.8 million during the years ended December 31, 2011, 2010, and 2009, respectively, to cover its portion of administrative and compensation costs for officers and employees that perform services for CEI. This reimbursement is evaluated on an annual basis. Officers and employees that perform services for CEI provide an estimate of the portion of their time devoted to such services. A portion of their annual compensation (including bonuses, payroll taxes and other benefit costs) is allocated to CEI for reimbursement based on these estimates. In addition, an administrative burden is added to such costs to reimburse us for additional support costs, including, but not limited to, consideration for rent, office support and information service support.
GSO Crosstex Holdings LLC. GSO Crosstex Holdings LLC owns 14,705,882 Series A Convertible Preferred Units representing limited partner interests, representing an approximate 22% limited partnership interest in us as of January 31, 2012. In connection with the sale of the Series A Convertible Preferred Units to GSO Crosstex Holdings LLC, we entered into a Board Representation Agreement by and among our general partner, CEI and GSO Crosstex Holdings LLC. Pursuant to the Board Representation Agreement, each of the Crosstex entities agreed to take all actions necessary or advisable to cause one director serving on the Board to be designated by GSO Crosstex Holdings LLC,
104
in its sole discretion. Such designation right will terminate upon the earliest to occur of (i) GSO Crosstex Holdings LLC and its affiliates holding a number of Series A preferred units and common units issued on conversion of the Series A preferred units that is less than twenty-five percent (25%) of the number of Series A preferred units initially issued to GSO Crosstex Holdings LLC, (ii) such time as the sum of (A) the number of common units into which the Series A preferred units collectively held by GSO Crosstex Holdings LLC and its affiliates are convertible and (B) the number of the common units issuable upon conversion of the Series A preferred units which are then collectively held by GSO Crosstex Holdings LLC and its affiliates represent less than ten percent (10%) of the common units then outstanding and (iii) GSO Crosstex Holdings LLC ceasing to be an affiliate of The Blackstone Group L.P. GSO Crosstex Holdings LLC has selected D. Dwight Scott to serve as a director. GSO Crosstex Holdings LLC (or its affiliates) requires that any compensation due to Mr. Scott be paid directly to GSO Crosstex Holdings LLC (or its designee). As a result, we will pay GSO Crosstex Holdings LLC (or its designee) all cash compensation (and the cash value at the date of grant of any equity compensation) otherwise payable to Mr. Scott for his service as a director in accordance with our director compensation policies in place from time to time.
Approval and Review of Related Party Transactions. If we contemplate entering into a transaction, other than a routine or in the ordinary course of business transaction, in which a related person will have a direct or indirect material interest, the proposed transaction is submitted for consideration to the Board or our senior management, as appropriate. If the Board is involved in the approval process, it determines whether it is advisable to refer the matter to the Conflicts Committee, as constituted under the limited partnership agreement of Crosstex Energy, L.P. The Conflicts Committee operates pursuant to its written charter and our partnership agreement. If a matter is referred to the Conflicts Committee, the Conflicts Committee obtains information regarding the proposed transaction from management and determines whether it is advisable to engage independent legal counsel or an independent financial advisor to advise the members of the committee regarding the transaction. If the committee retains such counsel or financial advisor, it considers the advice and, in the case of a financial advisor, such advisor's opinion as to whether the transaction is fair and reasonable to us and to our unitholders.
Director Independence
See "Item 10. Directors, Executive Officers and Corporate Governance" for information regarding director independence.
Item 14. Principal Accounting Fees and Services
Audit Fees
The fees for professional services rendered for the audit of our annual financial statements for each of the fiscal years ended December 31, 2011 and December 31, 2010, review of our internal control procedures for the fiscal year ended December 31, 2011 and December 31, 2010, and the reviews of the financial statements included in our Quarterly Reports on Forms 10-Q or services that are normally provided by KPMG in connection with statutory or regulatory filings or engagements for each of those fiscal years was $1.4 million and $1.3 million, respectively. These amounts also included fees associated with comfort letters and consents related to debt and equity offerings.
Audit-Related Fees
KPMG did not perform any assurance and related services related to the performance of the audit or review of our financial statements for the fiscal years ended December 31, 2011 and December 31, 2010 that were not included in the audit fees listed above.
105
Tax Fees
KPMG did not perform any tax related services for the year ended December 31, 2011. The fee for services rendered by KPMG for tax compliance, tax advice and tax planning for the year ended December 31, 2010 were $0.01 million.
All Other Fees
KPMG did not render services to us, other than those services covered in the sections captioned "Audit Fees" and "Tax Fees" for the fiscal years ended December 31, 2011 and December 31, 2010.
Audit Committee Approval of Audit and Non-Audit Services
All audit and non-audit services and any services that exceed the annual limits set forth in our annual engagement letter for audit services must be pre-approved by the Audit Committee. In 2012, the Audit Committee has not pre-approved the use of KPMG for any non-audit related services. The Chairman of the Audit Committee is authorized by the Audit Committee to pre-approve additional KPMG audit and non-audit services between Audit Committee meetings; provided that the additional services do not affect KPMG's independence under applicable Securities and Exchange Commission rules and any such pre-approval is reported to the Audit Committee at its next meeting.
106
Item 15. Exhibits and Financial Statement Schedules
The exhibits filed as part of this report are as follows (exhibits incorporated by reference are set forth with the name of the registrant, the type of report and registration number or last date of the period for which it was filed, and the exhibit number in such filing):
| Number | |
Description | ||||
|---|---|---|---|---|---|---|
| 2.1 | *** | — | Partnership Interest Purchase and Sale Agreement, dated as of June 9, 2009, among Crosstex Energy Services, L.P., Crosstex Energy Services GP, LLC, Crosstex CCNG Gathering, Ltd., Crosstex CCNG Transmission Ltd., Crosstex Gulf Coast Transmission Ltd., Crosstex Mississippi Pipeline, L.P., Crosstex Mississippi Gathering, L.P., Crosstex Mississippi Industrial Gas Sales, L.P., Crosstex Alabama Gathering System, L.P., Crosstex Midstream Services, L.P., Javelina Marketing Company Ltd., Javelina NGL Pipeline Ltd. and Southcross Energy LLC (incorporated by reference to Exhibit 2.1 to our Current Report on Form 8-K dated June 9, 2009, filed with the Commission on June 11, 2009, file No. 000-50067). | |||
2.2 |
*** |
— |
Partnership Interest Purchase and Sale Agreement, dated as of August 28, 2009, among Crosstex Energy Services, L.P., Crosstex Energy Services GP, LLC, Crosstex Treating Services, L.P. and KM Treating GP LLC (incorporated by reference to Exhibit 2.1 to our Current Report on Form 8-K dated August 28, 2009, filed with the Commission on September 3, 2009, file No. 000-50067). |
|||
3.1 |
— |
Certificate of Limited Partnership of Crosstex Energy, L.P. (incorporated by reference to Exhibit 3.1 to our Registration Statement on Form S-1, file No. 333-97779). |
||||
3.2 |
— |
Sixth Amended and Restated Agreement of Limited Partnership of Crosstex Energy, L.P., dated as of March 23, 2007 (incorporated by reference to Exhibit 3.1 to our Current Report on Form 8-K dated March 23, 2007, filed with the Commission on March 27, 2007, file No. 000-50067). |
||||
3.3 |
— |
Amendment No. 1 to Sixth Amended and Restated Agreement of Limited Partnership of Crosstex Energy, L.P., dated December 20, 2007 (incorporated by reference to Exhibit 3.1 to our Current Report on Form 8-K dated December 20, 2007, filed with the Commission on December 21, 2007, file No. 000-50067). |
||||
3.4 |
— |
Amendment No. 2 to Sixth Amended and Restated Agreement of Limited Partnership of Crosstex Energy, L.P. (incorporated by reference to Exhibit 3.1 to our Current Report on Form 8-K dated March 27, 2008, filed with the Commission on March 28, 2008, file No. 000-50067). |
||||
3.5 |
— |
Amendment No. 3 to Sixth Amended and Restated Agreement of Limited Partnership of Crosstex Energy, L.P., dated as of January 19, 2010 (incorporated by reference to Exhibit 3.1 to our Current Report on Form 8-K dated January 19, 2010, filed with the Commission on January 22, 2010, file No. 000-50067). |
||||
107
| Number | |
Description | ||||
|---|---|---|---|---|---|---|
| 3.6 | — | Certificate of Limited Partnership of Crosstex Energy Services, L.P. (incorporated by reference to Exhibit 3.3 to our Registration Statement on Form S-1, file No. 333-97779). | ||||
3.7 |
— |
Second Amended and Restated Agreement of Limited Partnership of Crosstex Energy Services, L.P., dated as of April 1, 2004 (incorporated by reference to Exhibit 3.5 to our Quarterly Report on Form 10-Q for the quarterly period ended March 31, 2004, file No. 000-50067). |
||||
3.8 |
— |
Certificate of Formation of Crosstex Energy GP, LLC (incorporated by reference to Exhibit 3.7 to our Registration Statement on Form S-1, file No. 333-97779). |
||||
3.9 |
— |
Amended and Restated Limited Liability Company Agreement of Crosstex Energy GP, LLC, dated as of December 17, 2002 (incorporated by reference to Exhibit 3.8 to our Registration Statement on Form S-1, file No. 333-97779). |
||||
3.10 |
— |
Amendment No. 1 to Amended and Restated Limited Liability Company Agreement of Crosstex Energy GP, LLC, dated as of January 19, 2010 (incorporated by reference to Exhibit 3.2 to our Current Report on Form 8-K dated January 19, 2010, filed with the Commission on January 22, 2010, file No. 000-50067). |
||||
4.1 |
— |
Specimen Unit Certificate for Common Units (incorporated by reference to Exhibit 4.7 to Amendment No. 1 to our Registration Statement on Form S-3, file No. 333-128282). |
||||
4.2 |
— |
Indenture, dated as of February 10, 2010, by and among Crosstex Energy, L.P., Crosstex Energy Finance Corporation, the Guarantors named therein and Wells Fargo Bank, National Association, as trustee (incorporated by reference to Exhibit 4.1 to our Current Report on Form 8-K dated February 10, 2010, filed with the Commission on February 16, 2010, file No. 000-50067). |
||||
4.3 |
— |
Supplemental Indenture, dated as of July 11, 2011, to the Indenture governing the Issuers' 8.875% senior unsecured notes due 2018, dated as of February 10, 2010, by and among Crosstex Energy, L.P., Crosstex Energy Finance Corporation, the Guarantors names therein and Wells Fargo Bank, National Association, as trustee (incorporated by reference to Exhibit 4.1 to our Current Report on Form 8-K dated July 11, 2011, filed with the Commission on July 12, 2011, file No. 000-50067). |
||||
4.4 |
— |
Supplemental Indenture, dated as of January 24, 2012, to the Indenture governing the Issuers' 8.875% senior unsecured notes due 2018, dated as of February 10, 2010, by and among Crosstex Energy, L.P., Crosstex Energy Finance Corporation, the Guarantors named therein and Well Fargo Bank, National Association, as trustee (incorporated by reference to Exhibit 4.1 to our Current Report on Form 8-K dated January 24, 2012, filed with the Commission on January 25, 2012, file No. 000-50067). |
||||
4.5 |
— |
Registration Rights Agreement, dated as of February 10, 2010, by and among Crosstex Energy, L.P., Crosstex Energy Finance Corporation, the Guarantors named therein and the Initial Purchasers named therein (incorporated by reference to Exhibit 4.2 to our Current Report on Form 8-K dated February 10, 2010, filed with the Commission on February 16, 2010, file No. 000-50067). |
||||
4.6 |
— |
Registration Rights Agreement, dated as of January 19, 2010, by and among Crosstex Energy, L.P. and GSO Crosstex Holdings LLC (incorporated by reference to Exhibit 4.1 to our Current Report on Form 8-K dated January 19, 2010, filed with the Commission on January 22, 2010, file No. 000-50067). |
||||
108
| Number | |
Description | ||||
|---|---|---|---|---|---|---|
| 10.1 | † | — | Crosstex Energy, Inc. Amended and Restated Long-Term Incentive Plan effective as of September 6, 2006 (incorporated by reference to Exhibit 10.1 to Crosstex Energy, Inc.'s Current Report on Form 8-K dated October 26, 2006, filed with the Commission on October 31, 2006, file No. 000-50536). | |||
10.2 |
† |
— |
Crosstex Energy GP, LLC Amended and Restated Long-Term Incentive Plan, dated March 17, 2009 (incorporated by reference to Exhibit 10.3 to our Quarterly Report on Form 10-Q for the quarter ended March 31, 2009, file No. 000-50067). |
|||
10.3 |
† |
— |
Crosstex Energy, Inc. 2009 Long-Term Incentive Plan, effective March 17, 2009 (incorporated by reference to Exhibit 10.3 to Crosstex Energy, Inc.'s Quarterly Report on Form 10-Q for the quarter ended March 31, 2009, file No. 000-50536). |
|||
10.4 |
— |
Omnibus Agreement, dated December 17, 2002, among Crosstex Energy, L.P. and certain other parties (incorporated by reference to Exhibit 10.5 to our Annual Report on Form 10-K for the year ended December 31, 2002, file No. 000-50067). |
||||
10.5 |
† |
— |
Form of Employment Agreement (incorporated by reference to Exhibit 10.6 to our Annual Report on Form 10-K for the year ended December 31, 2002, file No. 000-50067). |
|||
10.6 |
† |
— |
Form of Severance Agreement (incorporated by reference to Exhibit 10.6 to our Annual Report on Form 10-K for the year ended December 31, 2009, file No. 000-50067) |
|||
10.7 |
† |
— |
Form of Performance Unit Agreement (incorporated by reference to Exhibit 10.1 to our Current Report on Form 8-K dated June 27, 2007, filed with the Commission on July 3, 2007, file No. 000-50067). |
|||
10.8 |
† |
— |
Form of Restricted Unit Agreement (incorporated by reference to Exhibit 10.9 to our Annual Report on Form 10-K for the year ended December 31, 2009, file No. 000-50067). |
|||
10.9 |
† |
— |
Form of Restricted Stock Agreement (incorporated by reference to Exhibit 10.9 to Crosstex Energy, Inc.'s Annual Report on Form 10-K for the year ended December 31, 2009, file No. 000-50536). |
|||
10.10 |
† |
— |
Form of Performance Share Agreement (incorporated by reference to Exhibit 10.1 to Crosstex Energy, Inc.'s Current Report on Form 8-K dated June 27, 2007, filed with the Commission on July 3, 2007, file No. 000-50536). |
|||
10.11 |
† |
— |
Form of Indemnity Agreement (incorporated by reference to Exhibit 10.2 to Crosstex Energy, Inc.'s Annual Report on Form 10-K for the year ended December 31, 2003, file No. 000-50536). |
|||
10.12 |
— |
Board Representation Agreement, dated as of January 19, 2010, by and among Crosstex Energy GP, LLC, Crosstex Energy GP, L.P., Crosstex Energy, L.P., Crosstex Energy, Inc. and GSO Crosstex Holdings LLC (incorporated by reference to Exhibit 10.1 to our Current Report on Form 8-K dated January 19, 2010, filed with the Commission on January 22, 2010, file No. 000-50067). |
||||
10.13 |
— |
Purchase Agreement, dated as of February 3, 2010, by and among Crosstex Energy, L.P., Crosstex Energy Finance Corporation, the Guarantors named therein and the Initial Purchasers named therein (incorporated by reference to Exhibit 10.1 to our Current Report on Form 8-K dated February 3, 2010, filed with the Commission on February 5, 2010, file No. 000-50067). |
||||
109
| Number | |
Description | ||||
|---|---|---|---|---|---|---|
| 10.14 | — | Series A Convertible Preferred Unit Purchase Agreement, dated as of January 6, 2010, by and between Crosstex Energy, LP. and GSO Crosstex Holding LLC (incorporated by reference to Exhibit 10.1 to our current report on Form 8-K dated January 6, 2010, filed with the Commission on February 11, 2010, file No. 000-50067). | ||||
10.15 |
— |
Amended and Restated Credit Agreement, dated as of February 10, 2010, by and among Crosstex Energy, L.P., Bank of America, N.A., as Administrative Agent and L/C Issuer thereunder, and the other lenders party thereto (incorporated by reference to Exhibit 10.1 to our Current Report on Form 8-K dated February 10, 2010, filed with the Commission on February 16, 2010, file No. 000-50067). |
||||
10.16 |
— |
First Amendment to Amended and Restated Credit Agreement dated as of May 2, 2011, by and among Crosstex Energy, L.P., Bank of America, N.A., as Administrative Agent and L/C Issuer, and the other lenders party thereto (incorporated by reference to Exhibit 10.1 to our Current Report on Form 8-K dated May 2, 2011, filed with the Commission on May 3, 2011, file No. 000-50067). |
||||
10.17 |
— |
Second Amendment to Amended and Restated Credit Agreement dated as of July 11, 2011, by and among Crosstex Energy, L.P., Bank of America, N.A., as Administrative Agent and L/C Issuer, and the other lenders party thereto (incorporated by reference to Exhibit 10.1 to our Current Report on Form 8-K dated July 11, 2011, filed with the Commission on July 12, 2011, file No. 000-50067). |
||||
10.18 |
— |
Third Amendment to Amended and Restated Credit Agreement dated as of January 24, 2012, by and among Crosstex Energy, L.P., Bank of America, N.A., as Administrative Agent and L/C Issuer, and the other lenders party thereto (incorporated by reference to Exhibit 10.1 to our Current Report on Form 8-K dated January 24, 2012, filed with the Commission on January 25, 2012, file No. 000-50067). |
||||
10.19 |
† |
— |
Crosstex Energy Services, L.P. Severance Pay Plan (incorporated by reference to Exhibit 10.1 to our Current Report on Form 8-K July 1, 2011, filed with the Commission on July 1, 2011, file No. 000-50067). |
|||
10.20 |
*† |
— |
Form of Employment Agreement. |
|||
12.1 |
* |
— |
Ratio of Earnings to Fixed Charges. |
|||
21.1 |
* |
— |
List of Subsidiaries. |
|||
23.1 |
* |
— |
Consent of KPMG LLP. |
|||
31.1 |
* |
— |
Certification of the Principal Executive Officer. |
|||
31.2 |
* |
— |
Certification of the Principal Financial Officer. |
|||
32.1 |
* |
— |
Certification of the Principal Executive Officer and the Principal Financial Officer of the Company pursuant to 18 U.S.C. Section 1350. |
|||
110
| Number | |
Description | ||||
|---|---|---|---|---|---|---|
| 101 | ** | — | The following financial information from Crosstex Energy, L.P.'s Annual Report on Form 10-K for the year ended December 31, 2011, formatted in XBRL (eXtensible Business Reporting Language): (i) Consolidated Statements of Operations for the years ended December 31, 2011, 2010, and 2009, (ii) Consolidated Balance Sheets as of December 31, 2011, and 2010 , (iii) Consolidated Statements of Cash Flows for the years ended December 31, 2011, 2010, and 2009, (iv) Consolidated Statements of Comprehensive Income for the years ended December 31, 2011, 2010, and 2009, (v) Consolidated Statements of Changes in Partners' Equity for the years ended December 31, 2011, 2010, and 2009 and (vi) the Notes to Consolidated Financial Statements. | |||
111
Pursuant to the requirements of Section 13 or 15(d) of the Securities Exchange Act of 1934, the Registrant has duly caused this report to be signed on its behalf by the undersigned, thereunto duly authorized, on the 28th day of February 2012.
| CROSSTEX ENERGY, L.P. | ||||
By: |
Crosstex Energy GP, LLC, its general partner |
|||
By: |
/s/ BARRY E. DAVIS Barry E. Davis, President and Chief Executive Officer |
|||
Pursuant to the requirements of the Securities Exchange Act of 1934, this report has been signed below on the dates indicated by the following persons on behalf of the Registrant and in the capacities with Crosstex Energy GP, LLC, general partner of the Registrant, indicated.
Signature
|
Title
|
Date
|
||
|---|---|---|---|---|
| /s/ BARRY E. DAVIS Barry E. Davis |
President, Chief Executive Officer and Director (Principal Executive Officer) | February 28, 2012 | ||
/s/ RHYS J. BEST Rhys J. Best |
Chairman of the Board |
February 28, 2012 |
||
/s/ LELDON E. ECHOLS Leldon E. Echols |
Director |
February 28, 2012 |
||
/s/ BRYAN H. LAWRENCE Bryan H. Lawrence |
Director |
February 28, 2012 |
||
/s/ SHELDON B. LUBAR Sheldon B. Lubar |
Director |
February 28, 2012 |
||
/s/ CECIL E. MARTIN Cecil E. Martin |
Director |
February 28, 2012 |
||
/s/ D. DWIGHT SCOTT D. Dwight Scott |
Director |
February 28, 2012 |
112
Signature
|
Title
|
Date
|
||
|---|---|---|---|---|
| /s/ KYLE D. VANN Kyle D. Vann |
Director | February 28, 2012 | ||
/s/ MICHAEL J. GARBERDING Michael J. Garberding |
Senior Vice President and Chief Financial Officer (Principal Financial and Accounting Officer) |
February 28, 2012 |
113
F-1
MANAGEMENT'S REPORT ON
INTERNAL CONTROL OVER FINANCIAL REPORTING
Management of Crosstex Energy GP, LLC is responsible for establishing and maintaining adequate internal control over financial reporting and for the assessment of the effectiveness of internal control over financial reporting for Crosstex Energy, L.P. (the "Partnership"). As defined by the Securities and Exchange Commission (Rule 13a-15(f) under the Securities Exchange Act of 1934, as amended), internal control over financial reporting is a process designed by, or under the supervision of Crosstex Energy GP, LLC's principal executive and principal financial officers and effected by its Board of Directors, management and other personnel, to provide reasonable assurance regarding the reliability of financial reporting and the preparation of the consolidated financial statements in accordance with U.S. generally accepted accounting principles.
The Partnership's internal control over financial reporting is supported by written policies and procedures that (1) pertain to the maintenance of records that, in reasonable detail, accurately and fairly reflect the Partnership's transactions and dispositions of the Partnership's assets; (2) provide reasonable assurance that transactions are recorded as necessary to permit preparation of the consolidated financial statements in accordance with U.S. generally accepted accounting principles, and that receipts and expenditures of the Partnership are being made only in accordance with authorization of the Crosstex Energy GP, LLC's management and directors; and (3) provide reasonable assurance regarding prevention or timely detection of unauthorized acquisition, use or disposition of the Partnership's assets that could have a material effect on the consolidated financial statements.
Because of its inherent limitations, internal control over financial reporting may not prevent or detect misstatements. Also, projections of any evaluation of effectiveness to future periods are subject to the risk that controls may become inadequate because of changes in conditions, or that the degree of compliance with the policies or procedures may deteriorate.
In connection with the preparation of the Partnership's annual consolidated financial statements, management has undertaken an assessment of the effectiveness of the Partnership's internal control over financial reporting as of December 31, 2011, based on criteria established in Internal Control—Integrated Framework issued by the Committee of Sponsoring Organizations of the Treadway Commission (the COSO Framework). Management's assessment included an evaluation of the design of the Partnership's internal control over financial reporting and testing of the operational effectiveness of those controls.
Based on this assessment, management has concluded that as of December 31, 2011, the Partnership's internal control over financial reporting was effective to provide reasonable assurance regarding the reliability of financial reporting and the preparation of financial statements for external purposes in accordance with U.S. generally accepted accounting principles.
KPMG LLP, the independent registered public accounting firm that audited the Partnership's consolidated financial statements included in this report, has issued an attestation report on the Partnership's internal control over financial reporting, a copy of which appears on page F-4 of this Annual Report on Form 10-K.
F-2
Report of Independent Registered Public Accounting Firm
The
Partners
Crosstex Energy, L.P.:
We have audited the accompanying consolidated balance sheets of Crosstex Energy, L.P. (a Delaware limited partnership) and subsidiaries (the Partnership) as of December 31, 2011 and 2010 and the related consolidated statements of operations, comprehensive income (loss), changes in partners' equity, and cash flows for each of the years in the three-year period ended December 31, 2011. In connection with our audits of the consolidated financial statements, we also have audited the accompanying financial statement schedule. These consolidated financial statements and financial statement schedule are the responsibility of the Partnership's management. Our responsibility is to express an opinion on these consolidated financial statements and financial statement schedule based on our audits.
We conducted our audits in accordance with the standards of the Public Company Accounting Oversight Board (United States). Those standards require that we plan and perform the audit to obtain reasonable assurance about whether the financial statements are free of material misstatement. An audit includes examining, on a test basis, evidence supporting the amounts and disclosures in the financial statements. An audit also includes assessing the accounting principles used and significant estimates made by management, as well as evaluating the overall financial statement presentation. We believe that our audits provide a reasonable basis for our opinion.
In our opinion, the consolidated financial statements referred to above present fairly, in all material respects, the financial position of Crosstex Energy, L.P. and subsidiaries as of December 31, 2011 and 2010 and the results of their operations and their cash flows for each of the years in the three-year period ended December 31, 2011, in conformity with U.S. generally accepted accounting principles. Also in our opinion, the related financial statement schedule, when considered in relation to the basic consolidated financial statements taken as a whole, presents fairly, in all material respects, the information set forth therein.
We have also audited, in accordance with the standards of the Public Company Accounting Oversight Board (United States), the Partnership's internal control over financial reporting as of December 31, 2011, based on criteria established in Internal Control—Integrated Framework issued by the Committee of Sponsoring Organizations of the Treadway Commission (COSO), and our report dated February 28, 2012 expressed an unqualified opinion on the effectiveness of the Partnership's internal control over financial reporting.
| /s/ KPMG LLP |
Dallas,
Texas
February 28, 2012
F-3
Report of Independent Registered Public Accounting Firm
The Partners
Crosstex Energy, L.P.:
We have audited Crosstex Energy, L.P. and subsidiaries' (the Partnership) internal control over financial reporting as of December 31, 2011, based on criteria established in Internal Control—Integrated Framework issued by the Committee of Sponsoring Organizations of the Treadway Commission (COSO). The Partnership's management is responsible for maintaining effective internal control over financial reporting and for its assessment of the effectiveness of internal control over financial reporting, included in the accompanying Management's Report on Internal Control over Financial Reporting. Our responsibility is to express an opinion on the Partnership's internal control over financial reporting based on our audit.
We conducted our audit in accordance with the standards of the Public Company Accounting Oversight Board (United States). Those standards require that we plan and perform the audit to obtain reasonable assurance about whether effective internal control over financial reporting was maintained in all material respects. Our audit included obtaining an understanding of internal control over financial reporting, assessing the risk that a material weakness exists, and testing and evaluating the design and operating effectiveness of internal control based on the assessed risk. Our audit also included performing such other procedures as we considered necessary in the circumstances. We believe that our audit provides a reasonable basis for our opinion.
A company's internal control over financial reporting is a process designed to provide reasonable assurance regarding the reliability of financial reporting and the preparation of financial statements for external purposes in accordance with generally accepted accounting principles. A company's internal control over financial reporting includes those policies and procedures that (1) pertain to the maintenance of records that, in reasonable detail, accurately and fairly reflect the transactions and dispositions of the assets of the company; (2) provide reasonable assurance that transactions are recorded as necessary to permit preparation of financial statements in accordance with generally accepted accounting principles, and that receipts and expenditures of the company are being made only in accordance with authorizations of management and directors of the company; and (3) provide reasonable assurance regarding prevention or timely detection of unauthorized acquisition, use, or disposition of the company's assets that could have a material effect on the financial statements.
Because of its inherent limitations, internal control over financial reporting may not prevent or detect misstatements. Also, projections of any evaluation of effectiveness to future periods are subject to the risk that controls may become inadequate because of changes in conditions, or that the degree of compliance with the policies or procedures may deteriorate.
In our opinion, Crosstex Energy, L.P. and subsidiaries maintained, in all material respects, effective internal control over financial reporting as of December 31, 2011, based on criteria established in Internal Control—Integrated Framework issued by the Committee of Sponsoring Organizations of the Treadway Commission.
We also have audited, in accordance with the standards of the Public Company Accounting Oversight Board (United States), the consolidated balance sheets of the Partnership as of December 31, 2011 and 2010, and the related consolidated statements of operations, changes in partners' equity, comprehensive income (loss), and cash flows for each of the years in the three-year period ended December 31, 2011, and our report dated February 28, 2012 expressed an unqualified opinion on those consolidated financial statements.
| /s/ KPMG LLP |
Dallas,
Texas
February 28, 2012
F-4
CROSSTEX ENERGY, L.P.
Consolidated Balance Sheets
| |
December 31, | ||||||
|---|---|---|---|---|---|---|---|
| |
2011 | 2010 | |||||
| |
(In thousands, except unit data) |
||||||
ASSETS |
|||||||
Current assets: |
|||||||
Cash and cash equivalents |
$ | 24,143 | $ | 17,697 | |||
Accounts receivable: |
|||||||
Trade, net of allowance for bad debts of $405 and $163, respectively |
22,680 | 16,217 | |||||
Accrued revenues |
140,023 | 190,726 | |||||
Imbalances |
1,658 | 2,920 | |||||
Other |
1,434 | 156 | |||||
Fair value of derivative assets |
2,867 | 5,523 | |||||
Natural gas and natural gas liquids, prepaid expenses and other |
9,951 | 9,741 | |||||
Total current assets |
202,756 | 242,980 | |||||
Property and equipment: |
|||||||
Transmission assets |
384,959 | 383,651 | |||||
Gathering systems |
656,407 | 623,451 | |||||
Gas plants |
494,365 | 461,865 | |||||
Other property and equipment |
56,976 | 54,743 | |||||
Construction in process |
55,467 | 20,709 | |||||
Total property and equipment |
1,648,174 | 1,544,419 | |||||
Accumulated depreciation |
(406,273 | ) | (329,315 | ) | |||
Total property and equipment, net |
1,241,901 | 1,215,104 | |||||
Fair value of derivative assets |
— | 1,169 | |||||
Intangible assets, net of accumulated amortization of $199,248 and $151,735, respectively |
451,462 | 498,975 | |||||
Investment in limited liability company |
35,000 | — | |||||
Other assets, net |
24,212 | 26,712 | |||||
Total assets |
$ | 1,955,331 | $ | 1,984,940 | |||
LIABILITIES AND PARTNERS' EQUITY |
|||||||
Current liabilities: |
|||||||
Drafts payable |
6,005 | 151 | |||||
Accounts payable |
14,197 | 15,988 | |||||
Accrued gas purchases |
106,232 | 160,909 | |||||
Accrued imbalances payable |
2,348 | 1,889 | |||||
Fair value of derivative liabilities |
5,587 | 7,980 | |||||
Current portion of long-term debt |
— | 7,058 | |||||
Accrued interest |
24,918 | 28,843 | |||||
Other current liabilities |
66,065 | 37,802 | |||||
Total current liabilities |
225,352 | 260,620 | |||||
Long-term debt |
798,409 | 711,512 | |||||
Other long-term liabilities |
23,919 | 26,879 | |||||
Deferred tax liability |
7,192 | 7,837 | |||||
Fair value of derivative liabilities |
— | 1,156 | |||||
Commitments and contingencies |
— | — | |||||
Partners' equity: |
|||||||
Common unitholders (50,676,945 and 50,254,875 units issued and outstanding at December 31, 2011 and 2010, respectively) |
730,010 | 807,020 | |||||
Preferred unitholders (14,705,882 units issued and outstanding at December 31, 2011 and 2010) |
147,770 | 146,888 | |||||
General partner interest (2% interest with 1,334,343 and 1,324,730 equivalent units outstanding at December 31, 2011 and 2010, respectively) |
20,322 | 20,979 | |||||
Non-controlling interest |
2,860 | 2,908 | |||||
Accumulated other comprehensive loss |
(503 | ) | (859 | ) | |||
Total partners' equity |
900,459 | 976,936 | |||||
Total liabilities and partners' equity |
$ | 1,955,331 | $ | 1,984,940 | |||
See accompanying notes to consolidated financial statements.
F-5
CROSSTEX ENERGY, L.P.
Consolidated Statements of Operations
| |
Years ended December 31, | |||||||||
|---|---|---|---|---|---|---|---|---|---|---|
| |
2011 | 2010 | 2009 | |||||||
| |
(In thousands, except per unit data) |
|||||||||
Revenues: |
||||||||||
Midstream |
$ | 2,013,942 | $ | 1,792,676 | $ | 1,583,551 | ||||
Total revenues |
2,013,942 | 1,792,676 | 1,583,551 | |||||||
Operating costs and expenses: |
||||||||||
Purchased gas and NGLs |
1,638,777 | 1,454,376 | 1,272,329 | |||||||
Operating expenses |
111,778 | 105,060 | 110,394 | |||||||
General and administrative |
52,801 | 48,414 | 59,854 | |||||||
(Gain) loss on sale of property |
264 | (13,881 | ) | (666 | ) | |||||
(Gain) loss on derivatives |
7,776 | 9,100 | (2,994 | ) | ||||||
Impairments |
— | 1,311 | 2,894 | |||||||
Depreciation and amortization |
125,284 | 111,551 | 119,088 | |||||||
Total operating costs and expenses |
1,936,680 | 1,715,931 | 1,560,899 | |||||||
Operating income |
77,262 | 76,745 | 22,652 | |||||||
Other income (expense): |
||||||||||
Interest expense, net of interest income |
(79,233 | ) | (87,035 | ) | (95,078 | ) | ||||
Loss on extinguishment of debt |
— | (14,713 | ) | (4,669 | ) | |||||
Other income |
707 | 295 | 1,400 | |||||||
Total other expense |
(78,526 | ) | (101,453 | ) | (98,347 | ) | ||||
Loss from continuing operations before non-controlling interest and income taxes |
(1,264 | ) | (24,708 | ) | (75,695 | ) | ||||
Income tax provision |
(1,126 | ) | (1,121 | ) | (1,790 | ) | ||||
Loss from continuing operations before discontinued operations |
(2,390 | ) | (25,829 | ) | (77,485 | ) | ||||
Discontinued operations: |
||||||||||
Loss from discontinued operations, net of tax |
— | — | (1,796 | ) | ||||||
Gain on sale of discontinued operations, net of tax |
— | — | 183,747 | |||||||
Discontinued operations, net of tax |
— | — | 181,951 | |||||||
Net income (loss) |
$ | (2,390 | ) | $ | (25,829 | ) | $ | 104,466 | ||
Less: Net income(loss) from continuing operations attributable to the non-controlling interest |
(48 | ) | 19 | 60 | ||||||
Net income (loss) attributable to Crosstex Energy, L.P. |
$ | (2,342 | ) | $ | (25,848 | ) | $ | 104,406 | ||
Preferred interest in net income attributable to Crosstex Energy, L.P. |
$ | 18,088 | $ | 13,750 | $ | — | ||||
Beneficial conversion feature attributable to preferred units |
$ | — | $ | 22,279 | $ | — | ||||
General partner interest in net income (loss) |
$ | (732 | ) | $ | (4,371 | ) | $ | (819 | ) | |
Limited partners' interest in net income (loss) |
$ | (19,698 | ) | $ | (57,506 | ) | $ | 105,225 | ||
Net income (loss) per limited partners' unit: |
||||||||||
Basic common unit |
$ | (0.38 | ) | $ | (1.12 | ) | $ | 1.44 | ||
Diluted common unit |
$ | (0.38 | ) | $ | (1.12 | ) | $ | 1.40 | ||
Basic and diluted senior subordinated series D unit (see Note 7(b)) |
$ | — | $ | — | $ | 8.85 | ||||
See accompanying notes to consolidated financial statements.
F-6
CROSSTEX ENERGY, L.P.
Consolidated Statements of Comprehensive Income (Loss)
| |
Years Ended December 31, | |||||||||
|---|---|---|---|---|---|---|---|---|---|---|
| |
2011 | 2010 | 2009 | |||||||
| |
(In thousands) |
|||||||||
Net income (loss) |
$ | (2,390 | ) | $ | (25,829 | ) | $ | 104,466 | ||
Hedging (gains) losses reclassified to earnings |
1,965 | 2,085 | (2,412 | ) | ||||||
Adjustment in fair value of derivatives |
(1,609 | ) | (274 | ) | (3,368 | ) | ||||
Comprehensive income (loss) |
(2,034 | ) | (24,018 | ) | 98,686 | |||||
Comprehensive (income) loss attributable to non-controlling interest |
48 | (19 | ) | (60 | ) | |||||
Comprehensive income (loss) attributable to Crosstex Energy, L.P. |
$ | (1,986 | ) | $ | (24,037 | ) | $ | 98,626 | ||
See accompanying notes to consolidated financial statements.
F-7
Consolidated Statements of Changes in Partners' Equity
Years ended December 31, 2011, 2010 and 2009
| |
|
|
|
|
Sr. Subordinated D Units |
General Partner Interest |
|
|
|
|||||||||||||||||||||||||
|---|---|---|---|---|---|---|---|---|---|---|---|---|---|---|---|---|---|---|---|---|---|---|---|---|---|---|---|---|---|---|---|---|---|---|
| |
Common Units | Preferred Units | |
|
|
|||||||||||||||||||||||||||||
| |
Accumulated Other Comprehensive Income (loss) |
Non-Controlling Interest |
|
|||||||||||||||||||||||||||||||
| |
$ | Units | $ | Units | $ | Units | $ | Units | Total | |||||||||||||||||||||||||
| |
(In thousands) |
|||||||||||||||||||||||||||||||||
Balance, December 31, 2008 |
$ | 674,564 | 44,909 | — | — | 99,942 | 3,875 | 16,805 | 996 | 3,110 | 3,510 | 797,931 | ||||||||||||||||||||||
Issuance of common units |
||||||||||||||||||||||||||||||||||
Proceeds from exercise of unit options |
67 | 2 | — | — | — | — | — | — | — | — | 67 | |||||||||||||||||||||||
Conversion of subordinated units |
99,942 | 4,069 | — | — | (99,942 | ) | (3,875 | ) | — | — | — | — | — | |||||||||||||||||||||
Conversion of restricted units for common units, net of units withheld for taxes |
(232 | ) | 183 | — | — | — | — | — | — | — | — | (232 | ) | |||||||||||||||||||||
Capital contributions |
— | — | — | — | — | — | 21 | 7 | — | — | 21 | |||||||||||||||||||||||
Stock-based compensation |
5,660 | — | — | — | — | — | 3,082 | — | — | — | 8,742 | |||||||||||||||||||||||
Distributions |
(11,368 | ) | — | — | — | — | — | (229 | ) | — | — | — | (11,597 | ) | ||||||||||||||||||||
Net income (loss) |
105,225 | — | — | — | — | — | (819 | ) | — | — | 60 | 104,466 | ||||||||||||||||||||||
Hedging gains or losses reclassified to earnings |
— | — | — | — | — | — | — | — | (2,412 | ) | — | (2,412 | ) | |||||||||||||||||||||
Adjustment in fair value of derivatives |
— | — | — | — | — | — | — | — | (3,368 | ) | — | (3,368 | ) | |||||||||||||||||||||
Distribution to non-controlling interest |
— | — | — | — | — | — | — | — | — | (336 | ) | (336 | ) | |||||||||||||||||||||
Balance, December 31, 2009 |
873,858 | 49,163 | — | — | — | — | 18,860 | 1,003 | (2,670 | ) | 3,234 | 893,282 | ||||||||||||||||||||||
Issuance of preferred units |
— | — | 120,785 | 14,706 | — | — | — | — | — | — | 120,785 | |||||||||||||||||||||||
Beneficial conversion feature attributable to preferred units |
(22,279 | ) | — | 22,279 | — | — | — | — | — | — | — | — | ||||||||||||||||||||||
Proceeds from exercise of unit options |
890 | 199 | — | — | — | — | — | — | — | — | 890 | |||||||||||||||||||||||
Conversion of restricted units for common units, net of units withheld for taxes |
(2,659 | ) | 893 | — | — | — | — | — | — | — | — | (2,659 | ) | |||||||||||||||||||||
Capital contributions |
— | — | — | — | — | — | 2,807 | 322 | — | — | 2,807 | |||||||||||||||||||||||
Stock-based compensation |
5,262 | — | — | — | — | — | 4,014 | — | — | — | 9,276 | |||||||||||||||||||||||
Distributions |
(12,825 | ) | — | (9,926 | ) | — | — | — | (331 | ) | — | — | — | (23,082 | ) | |||||||||||||||||||
Net income (loss) |
(35,227 | ) | — | 13,750 | — | — | — | (4,371 | ) | — | — | 19 | (25,829 | ) | ||||||||||||||||||||
Hedging gains or losses reclassified to earnings |
— | — | — | — | — | — | — | — | 2,085 | — | 2,085 | |||||||||||||||||||||||
Adjustment in fair value of derivatives |
— | — | — | — | — | — | — | — | (274 | ) | — | (274 | ) | |||||||||||||||||||||
Distribution to non-controlling interest |
— | — | — | — | — | — | — | — | — | (345 | ) | (345 | ) | |||||||||||||||||||||
Balance, December 31, 2010 |
807,020 | 50,255 | 146,888 | 14,706 | — | — | 20,979 | 1,325 | (859 | ) | 2,908 | 976,936 | ||||||||||||||||||||||
Proceeds from exercise of unit options |
590 | 128 | — | — | — | — | — | — | — | — | 590 | |||||||||||||||||||||||
Conversion of restricted units for common units, net of units withheld for taxes |
(1,798 | ) | 294 | — | — | — | — | — | — | — | — | (1,798 | ) | |||||||||||||||||||||
Capital contributions |
— | — | — | — | — | — | 163 | 9 | — | — | 163 | |||||||||||||||||||||||
Stock-based compensation |
4,105 | — | — | — | — | — | 3,203 | — | — | — | 7,308 | |||||||||||||||||||||||
Distributions |
(60,209 | ) | — | (17,206 | ) | — | — | — | (3,291 | ) | — | — | — | (80,706 | ) | |||||||||||||||||||
Net income (loss) |
(19,698 | ) | — | 18,088 | — | — | — | (732 | ) | — | — | (48 | ) | (2,390 | ) | |||||||||||||||||||
Hedging gains or losses reclassified to earnings |
— | — | — | — | — | — | — | — | 1,965 | — | 1,965 | |||||||||||||||||||||||
Adjustment in fair value of derivatives |
— | — | — | — | — | — | — | — | (1,609 | ) | — | (1,609 | ) | |||||||||||||||||||||
Balance December 31, 2011 |
$ | 730,010 | 50,677 | $ | 147,770 | 14,706 | $ | — | — | $ | 20,322 | 1,334 | $ | (503 | ) | $ | 2,860 | $ | 900,459 | |||||||||||||||
See accompanying notes to consolidated financial statements.
F-8
CROSSTEX ENERGY, L.P.
Consolidated Statements of Cash Flows
| |
Years Ended December 31, | |||||||||
|---|---|---|---|---|---|---|---|---|---|---|
| |
2011 | 2010 | 2009 | |||||||
| |
(In thousands) |
|||||||||
Cash flows from operating activities: |
||||||||||
Net income (loss) |
$ | (2,390 | ) | $ | (25,829 | ) | $ | 104,466 | ||
Adjustments to reconcile net income (loss) to net cash provided by operating activities: |
||||||||||
Depreciation and amortization |
125,284 | 111,551 | 129,737 | |||||||
Non-cash stock-based compensation |
7,308 | 9,276 | 8,742 | |||||||
(Gain) loss on sale of property |
264 | (13,881 | ) | (184,412 | ) | |||||
Impairments |
— | 1,311 | 2,894 | |||||||
Deferred tax benefit |
(645 | ) | (396 | ) | (468 | ) | ||||
Derivatives mark to market interest rate settlement |
— | (24,160 | ) | — | ||||||
Non-cash portion of derivatives loss |
761 | 1,136 | 2,184 | |||||||
Non-cash portion of loss on debt extinguishment |
— | 5,396 | 4,669 | |||||||
Interest paid-in-kind |
— | (11,558 | ) | 10,134 | ||||||
Amortization of debt issue costs |
6,462 | 6,680 | 11,812 | |||||||
Amortization of discount on notes |
1,897 | 1,686 | — | |||||||
Changes in assets and liabilities: |
||||||||||
Accounts receivable, accrued revenue and other |
44,225 | 4,653 | 128,083 | |||||||
Natural gas and natural gas liquids, prepaid expenses and other |
(1,532 | ) | 2,414 | (5,300 | ) | |||||
Accounts payable, accrued gas purchases and other accrued liabilities |
(38,062 | ) | 18,908 | (131,563 | ) | |||||
Net cash provided by operating activities |
143,572 | 87,187 | 80,978 | |||||||
Cash flows from investing activities: |
||||||||||
Additions to property and equipment |
(97,572 | ) | (48,191 | ) | (101,370 | ) | ||||
Insurance recoveries on property and equipment |
— | 2,599 | 12,458 | |||||||
Acquisitions and asset purchases |
— | — | (35,142 | ) | ||||||
Proceeds from sale of property |
478 | 60,230 | 503,928 | |||||||
Investment in limited liability company |
(35,000 | ) | — | — | ||||||
Net cash provided by (used in) investing activities |
(132,094 | ) | 14,638 | 379,874 | ||||||
Cash flows from financing activities: |
||||||||||
Proceeds from borrowings |
471,250 | 997,412 | 632,807 | |||||||
Payments on borrowings |
(393,308 | ) | (1,144,706 | ) | (1,050,389 | ) | ||||
Proceeds from capital lease obligations |
— | — | 1,695 | |||||||
Payments on capital lease obligations |
(3,123 | ) | (2,385 | ) | (2,414 | ) | ||||
Increase (decrease) in drafts payable |
5,854 | (5,063 | ) | (16,300 | ) | |||||
Debt refinancing costs |
(3,954 | ) | (28,561 | ) | (15,031 | ) | ||||
Conversion of restricted units, net of units withheld for taxes |
(1,798 | ) | (2,659 | ) | (232 | ) | ||||
Distributions to non-controlling interest |
— | (345 | ) | (336 | ) | |||||
Distribution to partners |
(80,706 | ) | (23,082 | ) | (11,597 | ) | ||||
Proceeds from issuance of preferred units |
— | 120,785 | — | |||||||
Proceeds from exercise of unit options |
590 | 890 | 67 | |||||||
Contributions from partners |
163 | 2,807 | 21 | |||||||
Net cash used in financing activities |
(5,032 | ) | (84,907 | ) | (461,709 | ) | ||||
Net increase (decrease) in cash and cash equivalents |
6,446 | 16,918 | (857 | ) | ||||||
Cash and cash equivalents, beginning of period |
17,697 | 779 | 1,636 | |||||||
Cash and cash equivalents, end of period |
$ | 24,143 | $ | 17,697 | $ | 779 | ||||
Cash paid for interest |
$ | 71,950 | $ | 66,081 | $ | 91,454 | ||||
Cash paid for income taxes |
$ | 1,104 | $ | 1,688 | $ | 1,376 | ||||
See accompanying notes to consolidated financial statements.
F-9
CROSSTEX ENERGY, L.P.
Notes to Consolidated Financial Statements
December 31, 2011 and 2010
(1) Organization and Summary of Significant Agreements
(a) Description of Business
Crosstex Energy, L.P., a Delaware limited partnership formed on July 12, 2002, is engaged in the gathering, transmission, processing and marketing of natural gas and natural gas liquids (NGLs). The Partnership connects the wells of natural gas producers in the geographic areas of its gathering systems in order to gather for a fee or purchase the gas production, processes natural gas for the removal of NGLs, transports natural gas and NGLs and ultimately provides natural gas and NGLs to a variety of markets. In addition, the Partnership purchases natural gas and NGLs from producers not connected to its gathering systems for resale and markets natural gas and NGLs on behalf of producers for a fee. We recently added crude oil terminal facilities in south Louisiana to provide access for crude oil producers to the premium markets in this area.
(b) Partnership Ownership
Crosstex Energy GP, LLC, the general partner of the Partnership, is a direct wholly-owned subsidiary of Crosstex Energy, Inc. (CEI). As of December 31, 2011, CEI owns 16,414,830 common units in the Partnership through its wholly-owned subsidiaries. As of December 31, 2011, CEI owned 25.0% of the limited partner interests (including common and preferred interests) in the Partnership and its 2.0% of the general partner's interest.
(c) Basis of Presentation
The accompanying consolidated financial statements include the assets, liabilities, and results of operations of the Partnership and its wholly-owned subsidiaries. The Partnership proportionately consolidates its undivided 50.0% interest in a gas processing plant invested in by the Partnership in July 2011, and its undivided 64.29% interest in a gas plant acquired by the Partnership in November 2005 (23.85%), in May 2006 (35.42%) and June 2011 (5.02%). In accordance with FASB Accounting Standards Codification 810-10-05-8, the Partnership consolidates its joint venture interest in Crosstex DC Gathering, J.V. (CDC) as discussed more fully in Note 2(f). The consolidated operations are hereafter referred to herein collectively as the "Partnership." All material intercompany balances and transactions have been eliminated.
(2) Significant Accounting Policies
(a) Management's Use of Estimates
The preparation of financial statements in accordance with accounting principles generally accepted in the United States of America requires management of the Partnership to make estimates and assumptions that affect the reported amounts of assets and liabilities and disclosure of contingent assets and liabilities at the date of the financial statements and the reported amounts of revenues and expenses during the period. Actual results could differ from these estimates.
(b) Cash and Cash Equivalents
The Partnership considers all highly liquid investments with an original maturity of three months or less to be cash equivalents.
F-10
CROSSTEX ENERGY, L.P.
Notes to Consolidated Financial Statements (Continued)
December 31, 2011 and 2010
(2) Significant Accounting Policies (Continued)
(c) Natural Gas and Natural Gas Liquids Inventory
The Partnership's inventories of products consist of natural gas and NGLs. The Partnership reports these assets at the lower of cost or market.
(d) Property, Plant, and Equipment
Property, plant and equipment consist of intrastate gas transmission systems, gas gathering systems, NGL pipelines, natural gas processing plants and NGL fractionation plants. Gas required to maintain pipeline minimum pressures is capitalized and classified as property, plant and equipment. Other property and equipment is primarily comprised of computer software and equipment, furniture, fixtures, leasehold improvements and office equipment. Property, plant and equipment are recorded at cost. Repairs and maintenance are charged against income when incurred. Renewals and betterments, which extend the useful life of the properties, are capitalized. Interest costs are capitalized to property, plant and equipment during the period the assets are undergoing preparation for intended use. Interest costs totaling $0.9 million, $0.1 million and $1.1 million were capitalized for the years ended December 31, 2011, 2010 and 2009, respectively.
Depreciation is provided using the straight-line method based on the estimated useful life of each asset, as follows:
| |
Useful Lives | |||
|---|---|---|---|---|
Transmission assets |
20 - 30 years | |||
Gathering systems |
15 - 20 years | |||
Gas processing plants |
20 years | |||
Other property and equipment |
3 - 15 years | |||
Depreciation expense of $77.8 million, $75.7 million and $82.4 million was recorded for the years ended December 31, 2011, 2010 and 2009, respectively. Depreciation expense also includes the amortization of assets classified as capital lease assets.
FASB ASC 360-10-05-4 requires long-lived assets to be reviewed whenever events or changes in circumstances indicate that the carrying value of such assets may not be recoverable. In order to determine whether an impairment has occurred, the Partnership compares the net book value of the asset to the undiscounted expected future net cash flows. If an impairment has occurred, the amount of such impairment is determined based on the expected future net cash flows discounted using a rate commensurate with the risk associated with the asset.
When determining whether impairment of one of our long-lived assets has occurred, the Partnership must estimate the undiscounted cash flows attributable to the asset. The Partnership's estimate of cash flows is based on assumptions regarding the purchase and resale margins on natural gas, volume of gas available to the asset, markets available to the asset, operating expenses, and future natural gas prices and NGL product prices. The amount of availability of gas to an asset is sometimes based on assumptions regarding future drilling activity, which may be dependent in part on natural gas prices. Projections of gas volumes and future commodity prices are inherently subjective and contingent upon a number of variable factors. Any significant variance in any of the above assumptions or factors could materially affect our cash flows, which could require us to record an impairment of an asset.
F-11
CROSSTEX ENERGY, L.P.
Notes to Consolidated Financial Statements (Continued)
December 31, 2011 and 2010
(2) Significant Accounting Policies (Continued)
The Partnership recorded impairments to long-lived assets of $1.3 million and $2.9 million during the years ending December 31, 2010 and 2009, respectively. See Note 3(c) for further details on the long-lived assets impaired.
(e) Intangible Assets
Intangible assets consist of customer relationships and the value of the dedicated and non-dedicated acreage attributable to pipeline, gathering and processing systems. Intangible assets associated with customer relationships are amortized on a straight-line basis over the expected period of benefits of the customer relationships, which range from three to 15 years. The intangible assets associated with dedicated and non-dedicated acreage attributable to pipeline, gathering and processing systems are being amortized using the units of throughput method of amortization.
The following table represents the Partnership's total purchased intangible assets at years ended December 31, 2011 and 2010 (in thousands):
| |
Gross Carrying Amount |
Accumulated Amortization |
Net Carrying Amount |
|||||||
|---|---|---|---|---|---|---|---|---|---|---|
2011 |
||||||||||
Customer relationships |
$ | 255,058 | $ | (101,762 | ) | $ | 153,296 | |||
Dedicated and non-dedicated acreage |
395,652 | (97,486 | ) | 298,166 | ||||||
Total |
$ | 650,710 | $ | (199,248 | ) | $ | 451,462 | |||
2010 |
||||||||||
Customer relationships |
$ | 255,058 | $ | (86,524 | ) | $ | 168,534 | |||
Dedicated and non-dedicated acreage |
395,652 | (65,211 | ) | 330,441 | ||||||
Total |
$ | 650,710 | $ | (151,735 | ) | $ | 498,975 | |||
The weighted average amortization period for intangible assets is 18.0 years. Amortization expense for intangibles was approximately $47.5 million, $35.9 million and $36.6 million for the years ended December 31, 2011, 2010 and 2009, respectively.
The following table summarizes the Partnership's estimated aggregate amortization expense for the next five years (in thousands):
2012 |
$ | 44,995 | ||
2013 |
41,786 | |||
2014 |
40,578 | |||
2015 |
41,296 | |||
2016 |
41,880 | |||
Thereafter |
240,927 | |||
Total |
$ | 451,462 | ||
F-12
CROSSTEX ENERGY, L.P.
Notes to Consolidated Financial Statements (Continued)
December 31, 2011 and 2010
(2) Significant Accounting Policies (Continued)
(f) Investment in Limited Partnership
The Partnership owns a majority interest in Crosstex Denton County Joint Venture (CDC) and consolidates its investment in CDC pursuant to FASB ASC 810-10-05-8. The Partnership manages the business affairs of CDC, which owns a small gas gathering system in north Texas. The other joint venture partner (the CDC partner) is an unrelated third party who owns and operates a natural gas field located in Denton County, Texas.
(g) Investment in Limited Liability Company
On June 22, 2011, the Partnership entered into a limited liability agreement with Howard Energy Partners ("HEP") for an initial capital contribution of $35.0 million in exchange for an individual ownership interest in HEP of approximately 35.0%. In addition to the Partnership's contribution, an unrelated party also provided a capital contribution of $35.0 million for a 35.0% ownership interest in HEP with HEP management and a few private investors owning the remaining 30.0% interest. HEP owns assets and provides midstream and construction services to Eagle Ford Shale producers in south Texas. This investment in HEP is accounted for under the equity method of accounting and is reflected on the balance sheet as "Investment in limited liability company." Per the terms of the agreement, the Partnership will not recognize any income from this investment until HEP's income exceeds approximately $9.9 million on an inception to date basis due to preferred interests owned by HEP management. If HEP has losses on an inception to date basis, the Partnership will recognize 39.3% of the losses.
(h) Other Assets
Unamortized debt issuance costs totaling $24.2 million and $26.7 million as of December 31, 2011 and 2010, respectively, are included in other assets, net. Debt issuance costs are amortized into interest expense using the straight-line method over the terms of the debt.
(i) Gas Imbalance Accounting
Quantities of natural gas and NGLs over-delivered or under-delivered related to imbalance agreements are recorded monthly as receivables or payables using weighted average prices at the time of the imbalance. These imbalances are typically settled with deliveries of natural gas or NGLs. The Partnership had imbalance payables of $2.3 million and $1.9 million at December 31, 2011 and 2010, respectively, which approximate the fair value of these imbalances. The Partnership had imbalance receivables of $1.7 million and $2.9 million at December 31, 2011 and 2010, which are carried at the lower of cost or market value.
(j) Asset Retirement Obligations
FASB ASC 410-20-25-16 was issued in March 2005, which became effective at December 31, 2005. FASB ASC 410-20-25-16 clarifies that the term "conditional asset retirement obligation" as used in FASB ASC 410-20, refers to a legal obligation to perform an asset retirement activity in which the timing and/or method of settlement are conditional on a future event that may or may not be within the control of the entity. Since the obligation to perform the asset retirement activity is unconditional,
F-13
CROSSTEX ENERGY, L.P.
Notes to Consolidated Financial Statements (Continued)
December 31, 2011 and 2010
(2) Significant Accounting Policies (Continued)
FASB ASC 410-20-25-16 provides that a liability for the fair value of a conditional asset retirement activity should be recognized if that fair value can be reasonably estimated, even though uncertainty exists about the timing and/or method of settlement. FASB ASC 410-20-25-16 also clarifies when an entity would have sufficient information to reasonably estimate the fair value of an asset retirement obligation under FASB ASC 410-20. The Partnership did not provide any asset retirement obligations as of December 31, 2011 and 2010 because it does not have sufficient information as set forth in FASB ASC 410-20-25-16 to reasonably estimate such obligations, and the Partnership has no current intention of discontinuing use of any significant assets.
(k) Revenue Recognition
The Partnership recognizes revenue for sales or services at the time the natural gas or NGLs are delivered or at the time the service is performed. The Partnership generally accrues one month of sales and the related gas purchases and reverses these accruals when the sales and purchases are actually invoiced and recorded in the subsequent months. Actual results could differ from the accrual estimates. The Partnership's purchase and sale arrangements are generally reported in revenues and costs on a gross basis in the consolidated statement of operations in accordance with FASB ASC 605-45-45-1. Except for fee based arrangements, the Partnership acts as the principal in these purchase and sale transactions, has the risk and reward of ownership as evidenced by title transfer, schedules the transportation and assumes credit risk. We conduct "off-system" gas marketing operations as a service to producers on systems that we do not own. We refer to these activities as part of energy trading activities. In some cases, we earn an agency fee from the producer for arranging the marketing of the producer's natural gas. In other cases, we purchase the natural gas from the producer and enter into a sales contract with another party to sell the natural gas. The revenue and cost of sales for these activities are included in revenue on a net basis in the consolidated statement of operations.
The Partnership accounts for taxes collected from customers attributable to revenue transactions and remitted to government authorities on a net basis (excluded from revenues).
(l) Derivatives
The Partnership uses derivatives to hedge against changes in cash flows related to product price, as opposed to their use for trading purposes. FASB ASC 815 requires that all derivatives be recorded on the balance sheet at fair value. We generally determine the fair value of futures contracts and swap contracts based on the difference between the derivative's fixed contract price and the underlying market price at the determination date. The asset or liability related to the derivative instruments is recorded on the balance sheet in fair value of derivative assets or liabilities.
Realized and unrealized gains and losses on commodity related derivatives that are not designated as hedges, as well as the ineffective portion of hedge derivatives, are recorded as gain or loss on derivatives in the consolidated statement of operations. Realized and unrealized gains and losses on interest rate derivatives that are not designated as hedges are included in interest expense in the consolidated statement of operations. Unrealized gains and losses on effective cash flow hedge derivatives are recorded as a component of accumulated other comprehensive income. When the hedged transaction occurs, the realized gain or loss on the hedge derivative is transferred from accumulated other comprehensive income to earnings. Realized gains and losses on commodity hedge
F-14
CROSSTEX ENERGY, L.P.
Notes to Consolidated Financial Statements (Continued)
December 31, 2011 and 2010
(2) Significant Accounting Policies (Continued)
derivatives are recognized in revenues, and realized gains and losses on interest hedge derivatives are recorded as adjustments to interest expense. Settlements of derivatives are included in cash flows from operating activities.
(m) Comprehensive Income (Loss)
Comprehensive income includes net income (loss) and other comprehensive income, which includes unrealized gains and losses on derivative financial instruments. Pursuant to FASB ASC 815, the Partnership records deferred hedge gains and losses on its derivative financial instruments that qualify as cash flow hedges as other comprehensive income.
(n) Legal Costs Expected to be Incurred in Connection with a Loss Contingency
Legal costs incurred in connection with a loss contingency are expensed as incurred.
(o) Concentrations of Credit Risk
Financial instruments, which potentially subject the Partnership to concentrations of credit risk, consist primarily of trade accounts receivable and derivative financial instruments. Management believes the risk is limited since the Partnership's customers represent a broad and diverse group of energy marketers and end users. In addition, the Partnership continually monitors and reviews credit exposure to its marketing counter-parties and letters of credit or other appropriate security are obtained as considered necessary to limit the risk of loss. The Partnership records reserves for uncollectible accounts on a specific identification basis since there is not a large volume of late paying customers. The Partnership had a reserve for uncollectible receivables as of December 31, 2011, 2010 and 2009 of $0.4 million, $0.2 million and $0.4 million, respectively.
During the year ended December 31, 2011, the Partnership had only one customer that represented greater than 10.0% individually of its revenue. The customer is located in the LIG segment and represented 12.3% of the consolidated revenue for the year ended December 31, 2011. During the year ended December 31, 2010, three customers accounted for 14.5%, 10.6%, 10.2% of consolidated revenue. During the year ended December 31, 2009, one customer accounted for 12.2% of the consolidated revenue including discontinued operations. As the Partnership continues to grow and expand, the relationship between individual customer sales and consolidated total sales is expected to continue to change. While these customers represent a significant percentage of revenues, the loss of these customers would not have a material adverse impact on the Partnership's results of operations because the gross operating margin received from transactions with these customers are not material to the Partnership's gross operating margin.
(p) Environmental Costs
Environmental expenditures are expensed or capitalized as appropriate, depending on the nature of the expenditures and their future economic benefit. Expenditures that related to an existing condition caused by past operations that do not contribute to current or future revenue generation are expensed. Liabilities for these expenditures are recorded on an undiscounted basis (or a discounted basis when the obligation can be settled at fixed and determinable amounts) when environmental
F-15
CROSSTEX ENERGY, L.P.
Notes to Consolidated Financial Statements (Continued)
December 31, 2011 and 2010
(2) Significant Accounting Policies (Continued)
assessments or clean-ups are probable and the costs can be reasonably estimated. For the years ended December 31, 2011, 2010 and 2009, such expenditures were not significant.
(q) Share-Based Awards
The Partnership recognizes compensation cost related to all stock-based awards, including stock options, in its consolidated financial statements in accordance with FASB ASC 718. The Partnership and CEI each have similar unit or share-based payment plans for employees, which are described below. Share-based compensation associated with the CEI share-based compensation plans awarded to officers and employees of the Partnership are recorded by the Partnership since CEI has no operating activities other than its interest in the Partnership. Amounts recognized in the consolidated financial statements with respect to these plans are as follows (in thousands):
| |
Years Ended December 31, | |||||||||
|---|---|---|---|---|---|---|---|---|---|---|
| |
2011 | 2010 | 2009 | |||||||
Cost of share-based compensation charged to general and administrative expense |
$ | 6,157 | $ | 7,953 | $ | 7,075 | ||||
Cost of share-based compensation charged to operating expense |
1,151 | 1,323 | 1,667 | |||||||
Total amount charged to income |
$ | 7,308 | $ | 9,276 | $ | 8,742 | ||||
(r) Recent Accounting Pronouncements
We have reviewed recently issued accounting pronouncements that became effective during the year ended December 31, 2011, and have determined that none would have a material impact on our Consolidated Financial Statements.
(3) Discontinued Operations, Impairments and Dispositions
(a) Discontinued Operations
The Partnership sold its midstream assets in Alabama, Mississippi and south Texas for $217.6 million in August 2009. Sales proceeds, net of transaction costs and other obligations associated with the sale, of $212.0 million were used to repay long-term indebtedness and the Partnership recognized a gain on sale of $97.2 million. In October 2009, the Partnership sold its Treating assets for net proceeds of $265.4 million. Sales proceeds, net of transaction costs and other obligations associated with the sale, of $258.1 million were used to repay long-term indebtedness and the Partnership recognized a gain on sale of $86.3 million.
The revenues, operating expenses, general and administrative expenses associated directly with the sold assets, depreciation and amortization expense, Treating inventory impairment of $1.0 million during 2009, allocated Texas margin tax and an allocated interest expense related to the operations of the sold assets have been segregated from continuing operations and reported as discontinued operations for all periods. Interest expense of $34.4 million for the year ended 2009 was allocated to discontinued operations related to the debt repaid from the proceeds from the asset dispositions using
F-16
CROSSTEX ENERGY, L.P.
Notes to Consolidated Financial Statements (Continued)
December 31, 2011 and 2010
(3) Discontinued Operations, Impairments and Dispositions (Continued)
average historical interest rates for each of the three years. The interest allocation for 2009 also included make-whole interest payments and the write-off of unamortized debt issue costs related to the debt repaid. No corporate office general and administrative expenses have been allocated to income from discontinued operations. Following are revenues and income from discontinued operations (in thousands):
| |
Year ended December 31 2009 |
|||
|---|---|---|---|---|
Midstream revenues |
$ | 327,242 | ||
Treating revenues |
$ | 45,534 | ||
Loss from discontinued operations, net of tax |
$ | (1,796 | ) | |
Gain from sale of discontinued operations, net of tax |
$ | 183,747 | ||
(b) Other Disposition
The Partnership disposed of assets that were not considered discontinued operations in the years ended December 31, 2010 and 2009. The 2010 disposition was related to assets in east Texas for a gain of $14.0 million. The 2009 disposition was related to the Arkoma gathering assets in Oklahoma.
(c) Long-Lived Assets Impairments
Impairments of $1.3 million and $2.9 million were recorded in the years ended December 31, 2010 and 2009, respectively, related to long-lived assets. Impairments during 2009 totaling $2.9 million were taken on the Bear Creek processing plant and the Vermillion treating plant to bring the fair value of the plants to a marketable value for these idle assets. The impairment in 2010 primarily relates to the write down of certain excess pipe inventory prior to its sale.
Potential Changes in Sabine Plant during 2012. Currently, our Sabine plant has a contract with a third-party to fractionate the raw-make NGLs produced by the plant. We have been unsuccessful in renewing this contract, which expires on March 1, 2012. We have an interim solution to continue to provide for fractionation of the NGLs produced by the Sabine plant. Ultimately, we plan to connect the Sabine gas supply to our Eunice plant, which can process the gas and fractionate the produced NGLs. If this processing change is made, we will likely cease operating the Sabine plant. Although we do not have specific plans at this time to relocate the Sabine plant once it is idled, we may consider it for utilization elsewhere in our operations. The net book value of the Sabine plant was $34.0 million as of December 31, 2011. If the plant is idled on a long-term basis as contemplated above, an impairment may be recorded to expense the non-recoverable costs associated with the plant's current location, which are estimated to be less than $15.0 million based on the net book value as of December 31, 2011.
F-17
CROSSTEX ENERGY, L.P.
Notes to Consolidated Financial Statements (Continued)
December 31, 2011 and 2010
(4) Long-Term Debt
As of December 31, 2011 and 2010, long-term debt consisted of the following (in thousands):
| |
2011 | 2010 | |||||
|---|---|---|---|---|---|---|---|
Bank credit facility (due 2016), interest based on Prime and/or LIBOR plus an applicable margin, interest rate at December 31, 2011 and December 31, 2010 was 2.9% and 4.0%, respectively |
$ | 85,000 | $ | — | |||
Senior unsecured notes, net of discount of $11.6 million and $13.5 million, respectively, which bear interest at the rate of 8.875% |
713,409 | 711,512 | |||||
Series B secured note assumed in the Eunice transaction, which bore interest at the rate of 9.5% |
— | 7,058 | |||||
|
798,409 | 718,570 | |||||
Less current portion |
— | (7,058 | ) | ||||
Debt classified as long-term |
$ | 798,409 | $ | 711,512 | |||
Maturities. Maturities for the long-term debt as of December 31, 2011 are as follows (in thousands):
2012 |
$ | — | ||
2013 |
— | |||
2014 |
— | |||
2015 |
— | |||
2016 |
85,000 | |||
Thereafter |
725,000 | |||
Subtotal |
810,000 | |||
Less discount |
(11,591 | ) | ||
Total outstanding debt |
$ | 798,409 | ||
Credit Facility. The Partnership made three amendments to its bank credit facility in May 2011, July 2011 and January 2012. The amendments contained the following changes:
F-18
CROSSTEX ENERGY, L.P.
Notes to Consolidated Financial Statements (Continued)
December 31, 2011 and 2010
(4) Long-Term Debt (Continued)
As of December 31, 2011, there was $85.0 million of borrowing and $69.0 million in outstanding letters of credit, under the bank credit facility leaving approximately $331.0 million available for future borrowing based on a borrowing capacity of $485.0 million. Based on the January amendment to increase the credit facility borrowing capacity to $635.0 million and borrowings outstanding as of December 31, 2011, the Partnership's available borrowing would be $481.0 million.
The credit facility is guaranteed by substantially all of the Partnership's subsidiaries and is secured by first priority liens on substantially all of the Partnership's assets and those of the guarantors, including all material pipeline, gas gathering and processing assets, all material working capital assets and a pledge of all of the Partnership's equity interests in substantially all of its subsidiaries.
The Partnership may prepay all loans under the credit facility at any time without premium or penalty (other than customary LIBOR breakage costs), subject to certain notice requirements. The credit facility requires mandatory prepayments of amounts outstanding thereunder with the net proceeds of certain asset sales, extraordinary receipts, equity issuances and debt incurrences, but these mandatory prepayments do not require any reduction of the lenders' commitments under the credit facility.
Under the credit facility, borrowings bear interest at the Partnership's option at the Eurodollar Rate (the British Bankers Association LIBOR Rate) plus an applicable margin or the Base Rate (the highest of the Federal Funds Rate plus 0.50%, the 30-day Eurodollar Rate plus 1.0%, or the administrative agent's prime rate) plus an applicable margin. The Partnership pays a per annum fee on all letters of credit issued under the credit facility and a commitment fee of 0.50% per annum on the unused availability under the credit facility. The letter of credit fee and the applicable margins for the interest rate vary quarterly based on the Partnership's leverage ratio (as defined in the credit facility, being generally computed as the ratio of total funded debt to consolidated earnings before interest, taxes, depreciation, amortization and certain other non-cash charges, or adjusted EBITDA) and are as follows:
Leverage Ratio
|
Base Rate Loans |
Eurodollar Rate Loans |
Letter of Credit Fees |
|||||||
|---|---|---|---|---|---|---|---|---|---|---|
Greater than or equal to 4.50 to 1.00 |
2.00 | % | 3.00 | % | 3.00 | % | ||||
Greater than or equal to 4.00 to 1.00 and less than 4.50 to 1.00 |
1.75 | % | 2.75 | % | 2.75 | % | ||||
Greater than or equal to 3.50 to 1.00 and less than 4.00 to 1.00 |
1.50 | % | 2.50 | % | 2.50 | % | ||||
Greater than or equal to 3.00 to 1.00 and less than 3.50 to 1.00 |
1.25 | % | 2.25 | % | 2.25 | % | ||||
Less than 3.00 to 1.00 |
1.00 | % | 2.00 | % | 2.00 | % | ||||
Based on our forecasted leverage ratio of 4.00 to 1.00 for 2012, we expect the margin for the interest rate and letter of credit fee to be in line with the applicable rates above. The credit facility does not have a floor for the Base Rate or the Eurodollar Rate.
The amended credit facility includes financial covenants that are tested on a quarterly basis, based on the rolling four-quarter period that ends on the last day of each fiscal quarter. The maximum permitted leverage ratio (as defined in the credit facility, but generally computed as the ratio of total secured funded debt to consolidated earnings before interest, taxes, depreciation, amortization and
F-19
CROSSTEX ENERGY, L.P.
Notes to Consolidated Financial Statements (Continued)
December 31, 2011 and 2010
(4) Long-Term Debt (Continued)
certain other non-cash charges) is 5.00 to 1.00. The minimum consolidated interest coverage ratio (as defined in the credit facility, but generally computed as the ratio of consolidated earnings before interest, taxes, depreciation, amortization and certain other non-cash charges to consolidated interest charges) is as follows:
In addition, the credit facility contains various covenants that, among other restrictions, limit our ability to:
The credit facility permits the Partnership to make quarterly distributions to unitholders so long as no default exists under the credit facility.
Each of the following is an event of default under the credit facility:
F-20
CROSSTEX ENERGY, L.P.
Notes to Consolidated Financial Statements (Continued)
December 31, 2011 and 2010
(4) Long-Term Debt (Continued)
If an event of default relating to bankruptcy or other insolvency events occurs, all indebtedness under the credit facility will immediately become due and payable. If any other event of default exists under the credit facility, the lenders may accelerate the maturity of the obligations outstanding under the credit facility and exercise other rights and remedies. In addition, if any event of default exists under the credit facility, the lenders may commence foreclosure or other actions against the collateral.
If any default occurs under the credit facility, or if the Partnership is unable to make any of the representations and warranties in the credit facility, the Partnership will be unable to borrow funds or have letters of credit issued under the credit facility.
The Partnership expects to be in compliance with the covenants in the credit facility for at least the next twelve months.
Series B Secured Note. On October 20, 2009, the Partnership acquired the Eunice natural gas liquids processing plant and fractionation facility which included an $18.1 million series B secured note. We paid $11.0 million of principal on the series B secured note in May 2010 and paid the remaining $7.1 million in May 2011.
Senior Unsecured Notes. On February 10, 2010, we issued $725.0 million in aggregate principal amount of 8.875% senior unsecured notes (the "notes") due on February 15, 2018 at an issue price of 97.907% to yield 9.25% to maturity including the original issue discount (OID). Net proceeds from the sale of the notes of $689.7 million (net of transaction costs and OID), together with borrowings under the credit facility discussed above, were used to repay in full amounts outstanding under the prior bank credit facility and senior secured notes and to pay related fees, costs and expenses, including the settlement of interest rate swaps associated with the prior credit facility. Interest payments on the notes are due semi-annually in arrears in February and August.
The indenture governing the notes contains covenants that, among other things, limit the Partnership's ability and the ability of certain of its subsidiaries to:
F-21
CROSSTEX ENERGY, L.P.
Notes to Consolidated Financial Statements (Continued)
December 31, 2011 and 2010
(4) Long-Term Debt (Continued)
The indenture provides that if the Partnership's fixed charge coverage ratio (the ratio of consolidated cash flow to fixed charges, which generally represents the ratio of adjusted EBITDA to interest charges with further adjustments as defined per the indenture) for the most recently ended four full fiscal quarters is not less than 2.0 to 1.0, the Partnership will be permitted to pay distributions to its unitholders in an amount equal to available cash from operating surplus (each as defined in our partnership agreement) with respect to its preceding fiscal quarter plus a number of items, including the net cash proceeds received by the Partnership as a capital contribution or from the issuance of equity interests since the date of the indenture, to the extent not previously expended. If the Partnership's fixed charge coverage ratio is less than 2.0 to 1.0, the Partnership will be able to pay distributions to its unitholders in an amount equal to an $80.0 million basket (less amounts previously expended pursuant to such basket), plus the same number of items discussed in the preceding sentence to the extent not previously expended. The Partnership was in compliance with this ratio as of December 31, 2011.
If the notes achieve an investment grade rating from each of Moody's Investors Service, Inc. and Standard & Poor's Ratings Services, many of the covenants discussed above will terminate. Our current ratings on our bonds from Moody's Investors Service, Inc. and Standard & Poor's Rating Services are B1 and B+, respectively.
The Partnership may redeem up to 35% of the notes at any time prior to February 15, 2013 with the cash proceeds from equity offerings at a redemption price of 108.875% of the principal amount of the notes (plus accrued and unpaid interest to the redemption date) provided that:
Prior to February 15, 2014, the Partnership may redeem the notes, in whole or in part, at a "make-whole" redemption price. On or after February 15, 2014, the Partnership may redeem all or a part of the notes at redemption prices (expressed as percentages of principal amount) equal to 104.438% for the twelve-month period beginning on February 15, 2014, 102.219% for the twelve-month period beginning February 15, 2015 and 100.00% for the twelve-month period beginning on February 15, 2016 and at any time thereafter, plus accrued and unpaid interest, if any, to the applicable redemption date on the notes.
Each of the following is an event of default under the indenture:
F-22
CROSSTEX ENERGY, L.P.
Notes to Consolidated Financial Statements (Continued)
December 31, 2011 and 2010
(4) Long-Term Debt (Continued)
If an event of default relating to bankruptcy or other insolvency events occurs, the senior unsecured notes will immediately become due and payable. If any other event of default exists under the indenture, the trustee under the indenture or the holders of the senior unsecured notes may accelerate the maturity of the senior unsecured notes and exercise other rights and remedies.
Non Guarantors. The senior unsecured notes are jointly and severally guaranteed by each of the Partnership's current material subsidiaries (the "Guarantors"), with the exception of our regulated Louisiana subsidiaries (which may only guarantee up to $500.0 million of the Partnership's debt), CDC (our joint venture in Denton County, Texas not 100% owned by the Partnership) and Crosstex Energy Finance Corporation (a wholly owned Delaware corporation that was organized for the sole purpose of being a co-issuer of certain of the Partnership's indebtedness, including the senior unsecured notes). Guarantors may not sell or otherwise dispose of all or substantially all of their properties or assets to, or consolidate with or merge into another company if such a sale would cause a default under the terms of the senior unsecured notes. Since certain wholly owned subsidiaries do not guarantee the senior unsecured notes, the condensed consolidating financial statements of the guarantors and non-guarantors as of and for the years ended December 31, 2011 and 2010 are disclosed below in accordance with Rule 3-10 of Regulation S-X.
F-23
CROSSTEX ENERGY, L.P.
Notes to Consolidated Financial Statements (Continued)
December 31, 2011 and 2010
(4) Long-Term Debt (Continued)
Condensed Consolidating Balance Sheets
December 31, 2011
| |
Guarantors | Non Guarantors | Elimination | Consolidated | |||||||||
|---|---|---|---|---|---|---|---|---|---|---|---|---|---|
| |
(in thousands) |
||||||||||||
ASSETS |
|||||||||||||
Total current assets |
$ | 189,410 | $ | 13,346 | $ | — | $ | 202,756 | |||||
Property, plant and equipment, net |
1,026,537 | 215,364 | — | 1,241,901 | |||||||||
Total other assets |
510,671 | 3 | — | 510,674 | |||||||||
Total assets |
$ | 1,726,618 | $ | 228,713 | $ | — | $ | 1,955,331 | |||||
LIABILITIES & PARTNERS' CAPITAL |
|||||||||||||
Total current liabilities |
$ | 220,811 | $ | 4,541 | $ | — | $ | 225,352 | |||||
Long-term debt |
798,409 | — | — | 798,409 | |||||||||
Other long-term liabilities |
31,111 | — | — | 31,111 | |||||||||
Partners' capital |
676,287 | 224,172 | — | 900,459 | |||||||||
Total liabilities & partners' capital |
$ | 1,726,618 | $ | 228,713 | $ | — | $ | 1,955,331 | |||||
| |
Guarantors | Non Guarantors | Elimination | Consolidated | |||||||||
|---|---|---|---|---|---|---|---|---|---|---|---|---|---|
| |
(in thousands) |
||||||||||||
ASSETS |
|||||||||||||
Total current assets |
$ | 229,997 | $ | 12,983 | $ | — | $ | 242,980 | |||||
Property, plant and equipment, net |
987,018 | 228,086 | — | 1,215,104 | |||||||||
Total other assets |
526,853 | 3 | — | 526,856 | |||||||||
Total assets |
$ | 1,743,868 | $ | 241,072 | $ | — | $ | 1,984,940 | |||||
LIABILITIES & PARTNERS' CAPITAL |
|||||||||||||
Total current liabilities |
$ | 254,460 | $ | 6,160 | $ | — | $ | 260,620 | |||||
Long-term debt |
711,512 | — | — | 711,512 | |||||||||
Other long-term liabilities |
35,872 | — | — | 35,872 | |||||||||
Partners' capital |
742,024 | 234,912 | — | 976,936 | |||||||||
Total liabilities & partners' capital |
$ | 1,743,868 | $ | 241,072 | $ | — | $ | 1,984,940 | |||||
F-24
CROSSTEX ENERGY, L.P.
Notes to Consolidated Financial Statements (Continued)
December 31, 2011 and 2010
(4) Long-Term Debt (Continued)
Condensed Consolidating Statements of Operations
For the Year Ended December 31, 2011
| |
Guarantors | Non Guarantors | Elimination | Consolidated | |||||||||
|---|---|---|---|---|---|---|---|---|---|---|---|---|---|
| |
(in thousands) |
||||||||||||
Total revenues |
$ | 1,954,612 | $ | 86,577 | $ | (27,247 | ) | $ | 2,013,942 | ||||
Total operating costs and expenses |
(1,925,234 | ) | (38,693 | ) | 27,247 | (1,936,680 | ) | ||||||
Operating income |
29,378 | 47,884 | — | 77,262 | |||||||||
Interest expense, net |
(79,230 | ) | (3 | ) | — | (79,233 | ) | ||||||
Other income |
707 | — | — | 707 | |||||||||
Income (loss) from continuing operations before non-controlling interest and income taxes |
(49,145 | ) | 47,881 | — | (1,264 | ) | |||||||
Income tax provision |
(1,110 | ) | (16 | ) | — | (1,126 | ) | ||||||
Less: Net loss attributable to non-controlling interest |
— | (48 | ) | — | (48 | ) | |||||||
Net income (loss) attributable to Crosstex Energy, L.P. |
$ | (50,255 | ) | $ | 47,913 | $ | — | $ | (2,342 | ) | |||
For the Year Ended December 31, 2010
| |
Guarantors | Non Guarantors | Elimination | Consolidated | |||||||||
|---|---|---|---|---|---|---|---|---|---|---|---|---|---|
| |
(in thousands) |
||||||||||||
Total revenues |
$ | 1,733,273 | $ | 84,028 | $ | (24,625 | ) | $ | 1,792,676 | ||||
Total operating costs and expenses |
(1,704,250 | ) | (36,306 | ) | 24,625 | (1,715,931 | ) | ||||||
Operating income |
29,023 | 47,722 | — | 76,745 | |||||||||
Interest expense, net |
(87,029 | ) | (6 | ) | — | (87,035 | ) | ||||||
Other loss |
(14,418 | ) | — | — | (14,418 | ) | |||||||
Income (loss) from continuing operations before non-controlling interest and income taxes |
(72,424 | ) | 47,716 | — | (24,708 | ) | |||||||
Income tax provision |
(1,110 | ) | (11 | ) | — | (1,121 | ) | ||||||
Less: Net income attributable to non-controlling interest |
— | 19 | — | 19 | |||||||||
Net income (loss) attributable to Crosstex Energy, L.P. |
$ | (73,534 | ) | $ | 47,686 | $ | — | $ | (25,848 | ) | |||
F-25
CROSSTEX ENERGY, L.P.
Notes to Consolidated Financial Statements (Continued)
December 31, 2011 and 2010
(4) Long-Term Debt (Continued)
For the Year Ended December 31, 2009
| |
Guarantors | Non Guarantors | Elimination | Consolidated | |||||||||
|---|---|---|---|---|---|---|---|---|---|---|---|---|---|
| |
(in thousands) |
||||||||||||
Total revenues |
$ | 1,541,854 | $ | 75,048 | $ | (33,351 | ) | $ | 1,583,551 | ||||
Total operating costs and expenses |
(1,562,084 | ) | (32,166 | ) | 33,351 | (1,560,899 | ) | ||||||
Operating income (loss) |
(20,230 | ) | 42,882 | — | 22,652 | ||||||||
Interest expense, net |
(95,078 | ) | — | — | (95,078 | ) | |||||||
Other loss |
(3,269 | ) | — | — | (3,269 | ) | |||||||
Income (loss) from continuing operations before non-controlling interest and income taxes |
(118,577 | ) | 42,882 | — | (75,695 | ) | |||||||
Income tax provision |
(1,770 | ) | (20 | ) | — | (1,790 | ) | ||||||
Income from discontinued operations, net of tax |
181,951 | — | — | 181,951 | |||||||||
Less: Net income attributable to non-controlling interest |
— | 60 | — | 60 | |||||||||
Net income attributable to Crosstex Energy, L.P. |
$ | 61,604 | $ | 42,802 | $ | — | $ | 104,406 | |||||
Condensed Consolidating Statements of Cash Flow
For the Year Ended December 31, 2011
| |
Guarantors | Non Guarantors | Elimination | Consolidated | |||||||||
|---|---|---|---|---|---|---|---|---|---|---|---|---|---|
| |
(in thousands) |
||||||||||||
Net cash flows provided by operating activities |
$ | 81,883 | $ | 61,689 | $ | — | $ | 143,572 | |||||
Net cash flows used in investing activities |
$ | (129,806 | ) | $ | (2,288 | ) | $ | — | $ | (132,094 | ) | ||
Net cash flows provided by (used in) financing activities |
$ | (5,032 | ) | $ | (58,606 | ) | $ | 58,606 | $ | (5,032 | ) | ||
For the Year Ended December 31, 2010
| |
Guarantors | Non Guarantors | Elimination | Consolidated | |||||||||
|---|---|---|---|---|---|---|---|---|---|---|---|---|---|
| |
(in thousands) |
||||||||||||
Net cash flows provided by operating activities |
$ | 28,208 | $ | 58,979 | $ | — | $ | 87,187 | |||||
Net cash flows provided by (used in) investing activities |
$ | 21,353 | $ | (6,715 | ) | $ | — | $ | 14,638 | ||||
Net cash flows provided by (used in) financing activities |
$ | (84,562 | ) | $ | (52,501 | ) | $ | 52,156 | $ | (84,907 | ) | ||
F-26
CROSSTEX ENERGY, L.P.
Notes to Consolidated Financial Statements (Continued)
December 31, 2011 and 2010
(4) Long-Term Debt (Continued)
For the Year Ended December 31, 2009
| |
Guarantors | Non Guarantors | Elimination | Consolidated | |||||||||
|---|---|---|---|---|---|---|---|---|---|---|---|---|---|
| |
(in thousands) |
||||||||||||
Net cash flows provided by operating activities |
$ | 31,194 | $ | 49,784 | $ | — | $ | 80,978 | |||||
Net cash flows provided by (used in) investing activities |
$ | 402,464 | $ | (22,590 | ) | $ | — | $ | 379,874 | ||||
Net cash flows provided by (used in) financing activities |
$ | (461,372 | ) | $ | (27,194 | ) | $ | 26,857 | $ | (461,709 | ) | ||
(5) Other Long-Term Liabilities
The Partnership entered into 9 and 10-year capital leases for certain compressor equipment. Assets under capital leases are summarized as follows (in thousands):
| |
Years ended December 31, |
||||||
|---|---|---|---|---|---|---|---|
| |
2011 | 2010 | |||||
Compression equipment |
$ | 37,199 | $ | 37,199 | |||
Less: Accumulated amortization |
(10,361 | ) | (6,910 | ) | |||
Net assets under capital lease |
$ | 26,838 | $ | 30,289 | |||
The following are the minimum lease payments to be made in each of the following years indicated for the capital lease in effect as of December 31, 2011 (in thousands):
Fiscal Year
|
|
|||
|---|---|---|---|---|
2012 through 2016 ($4,582 annually) |
$ | 22,910 | ||
Thereafter |
12,100 | |||
Less: Interest |
(6,643 | ) | ||
Net minimum lease payments under capital lease |
28,367 | |||
Less: Current portion of net minimum lease payments |
(4,448 | ) | ||
Long-term portion of net minimum lease payments |
$ | 23,919 | ||
(6) Income Taxes
The Partnership is generally not subject to income taxes, except as discussed below, because its income is taxed directly to its partners. The net tax basis in the Partnership's assets and liabilities is less than the reported amounts on the financial statements by approximately $611.1 million as of December 31, 2011. The Partnership is subject to the margin tax enacted by the state of Texas on May 1, 2006.
The LIG entities the Partnership formed to acquire the stock of LIG Pipeline Company and its subsidiaries, are treated as taxable corporations for income tax purposes. The entity structure was formed to effect the matching of the tax cost to the Partnership of a step-up in the basis of the assets
F-27
CROSSTEX ENERGY, L.P.
Notes to Consolidated Financial Statements (Continued)
December 31, 2011 and 2010
(6) Income Taxes (Continued)
to fair market value with the recognition of benefits of the step-up by the Partnership. A deferred tax liability of $8.2 million was recorded at the acquisition date. The deferred tax liability represents future taxes payable on the difference between the fair value and tax basis of the assets acquired.
The Partnership provides for income taxes using the liability method. Accordingly, deferred taxes are recorded for the differences between the tax and book basis that will reverse in future periods (in thousands).
| |
Years Ended December 31, | |||||||||
|---|---|---|---|---|---|---|---|---|---|---|
| |
2011 | 2010 | 2009 | |||||||
Current tax provision |
$ | 1,771 | $ | 1,517 | $ | 2,258 | ||||
Deferred tax (benefit) |
(645 | ) | (396 | ) | (468 | ) | ||||
Income tax provision on continuing operations |
1,126 | 1,121 | 1,790 | |||||||
Income tax provision on discontinued operations (all current) |
— | — | 1,136 | |||||||
Tax provision |
$ | 1,126 | $ | 1,121 | $ | 2,926 | ||||
A reconciliation of the provision for income taxes is as follows (in thousands):
| |
Years Ended December 31, | |||||||||
|---|---|---|---|---|---|---|---|---|---|---|
| |
2011 | 2010 | 2009 | |||||||
Federal income tax on taxable corporation at statutory rate (35%) |
$ | 199 | $ | 43 | $ | 200 | ||||
State income taxes, net |
927 | 1,078 | 2,726 | |||||||
Income tax provision |
$ | 1,126 | $ | 1,121 | $ | 2,926 | ||||
The principal component of the Partnership's net deferred tax liability is as follows (in thousands):
| |
Years Ended December 31, |
||||||
|---|---|---|---|---|---|---|---|
| |
2011 | 2010 | |||||
Deferred income tax liabilities: |
|||||||
Property, plant, equipment, and intangible assets-current |
$ | (501 | ) | $ | (501 | ) | |
Property, plant, equipment, and intangible assets-long-term |
(7,192 | ) | (7,837 | ) | |||
|
$ | (7,693 | ) | $ | (8,338 | ) | |
Net deferred tax liability |
$ | (7,693 | ) | $ | (8,338 | ) | |
A net current deferred tax liability of $0.5 million is included in other current liabilities.
F-28
CROSSTEX ENERGY, L.P.
Notes to Consolidated Financial Statements (Continued)
December 31, 2011 and 2010
(6) Income Taxes (Continued)
A reconciliation of the beginning and ending amount of the unrecognized tax benefits is as follows (in thousands):
Balance as of December 31, 2009 |
$ | 3,124 | ||
Increases related to prior year tax positions |
110 | |||
Increases related to current year tax positions |
470 | |||
Balance as of December 31, 2010 |
$ | 3,704 | ||
Decreases related to prior year tax positions |
(8 | ) | ||
Increases related to current year tax positions |
517 | |||
Balance as of December 31, 2011 |
$ | 4,213 | ||
Unrecognized tax benefits of $4.2 million, if recognized, would affect the effective tax rate. It is unknown when the uncertain tax position will be resolved.
Per company accounting policy election, $0.1 million of penalties and interest related to prior year tax positions was recorded to income tax expense in 2011. In the event interest or penalties are incurred with respect to income tax matters, our policy will be to include such items in income tax expense. As of December 31, 2011, tax years 2008 through 2011 remain subject to examination by the Internal Revenue Service and tax years 2007 through 2011 remain subject to examination by various state taxing authorities.
(7) Partners' Capital
(a) Sale of Preferred Units
On January 19, 2010, the Partnership issued approximately $125.0 million of Series A Convertible Preferred Units to an affiliate of Blackstone/GSO Capital Solutions for net proceeds of $120.8 million. The general partner of the Partnership made a contribution of $2.6 million in connection with the issuance to maintain its 2% general partner interest. The 14,705,882 preferred units are convertible by the holders thereof at any time into common units on a one-for-one basis, subject to certain adjustments in the event of certain dilutive issuances of common units. The Partnership has the right to force conversion of the preferred units after three years from the issue date if (i) the daily volume-weighted average trading price of the common units is greater than $12.75 per unit for 20 out of the trailing 30 trading days ending on two trading days before the date on which the Partnership delivers notice of such conversion, and (ii) the average daily trading volume of common units must have exceeded 250,000 common units for 20 out of the trailing 30 trading days ending on two trading days before the date on which the Partnership delivers notice of such conversion. The preferred units are not redeemable, but are entitled to a quarterly distribution that will be the greater of $0.2125 per unit or the amount of the quarterly distribution per unit paid to common unitholders, subject to certain adjustments. Such quarterly distribution may be paid in cash, in additional preferred units issued in kind or any combination thereof, provided that the distribution may not be paid in additional preferred units if the Partnership pays cash distribution on common units. During 2011 and 2010, the Partnership paid quarterly distributions on its preferred units of $17.2 million and $9.9 million, respectively. A distribution on the preferred units of $4.7 million has been declared for the three months ended December 31, 2011 and was paid in February 2012.
F-29
CROSSTEX ENERGY, L.P.
Notes to Consolidated Financial Statements (Continued)
December 31, 2011 and 2010
(7) Partners' Capital (Continued)
The preferred units were issued at a discount to the market price of the common units they are convertible into. This discount totaling $22.3 million represents a beneficial conversion feature (BCF) and is reflected as a reduction in common unit equity and an increase in preferred equity to reflect the market value of the preferred units at issuance on the Partnership's consolidated statement of changes in partners' equity for the year ended December 31, 2010. The impact of the BCF is also included in earnings per unit for the year ended December 31, 2010.
(b) Senior Subordinated Series D Units
On March 23, 2007, the Partnership issued an aggregate of 3,875,340 senior subordinated series D units representing limited partner interests of the Partnership in a private offering. These senior subordinated series D units converted into common units representing limited partner interest of the Partnership on March 23, 2009. Since the Partnership did not make distribution of available cash from operating surplus, as defined in the partnership agreement, of at least $0.62 per unit on each outstanding common unit for the quarter ending December 31, 2008, each senior subordinated series D unit converted into 1.05 common units for a total issuance of 4,069,106 common units.
(c) Cash Distributions
Unless restricted by the terms of the Partnership's credit facility and/or senior unsecured note indenture, the Partnership must make distributions of 100% of available cash, as defined in the partnership agreement, within 45 days following the end of each quarter. As described under (a) Sale of Preferred Units above, the preferred units are entitled to a quarterly distribution equal to the greater of $0.2125 per unit or the amount of the quarterly distribution per unit paid to common unitholders, subject to certain adjustments. The general partner is not entitled to a 2% distribution with respect to the quarterly preferred distribution of $0.2125 per unit that is made solely to the preferred unitholders. The general partner is entitled to a 2% distribution with respect to all distributions made to common unitholders. If the distributions are in excess of $0.2125 per unit, distributions are made 98% to the common and preferred unitholders and 2% to the general partner, subject to the payment of incentive distributions as described below to the extent that certain target levels of cash distributions are achieved.
Under the quarterly incentive distribution provisions, generally the Partnership's general partner is entitled to 13% of amounts the Partnership distributes in excess of $0.25 per unit, 23% of the amounts the Partnership distributes in excess of $0.3125 per unit and 48% of amounts the Partnership distributes distribute in excess of $0.375 per unit. Incentive distributions totaling $2.4 million and $0.1 million were earned by our general partner for the years ended December 31, 2011 and 2010, respectively. The Partnership paid annual distributions per common unit of $1.17, $0.25 and $0.25 in the years ended December 31, 2011, 2010 and 2009, respectively.
The Partnership increased its fourth quarter distribution on its common units to $0.32 per unit which was paid February 11, 2012.
F-30
CROSSTEX ENERGY, L.P.
Notes to Consolidated Financial Statements (Continued)
December 31, 2011 and 2010
(7) Partners' Capital (Continued)
(d) Earnings per Unit and Dilution Computations
The Partnership had common units and preferred units outstanding during the year ended December 31, 2011 and December 31, 2010, and common units and senior subordinated series D units outstanding during the year ended December 31, 2009. The senior subordinated series D units, which converted to common units in March 2009, were considered common securities prior to conversion but were presented as a separate class of common equity because they did not participate in cash distributions during their subordination period. The senior subordinated series D units were issued in March 2007 at a discount, referred to as BCF, totaling $34.3 million to the market price of the common units they were convertible into at the end of their subordination period. Since the conversion of the senior subordinated series D units into common units was contingent until the end of their subordination period, the BCF was not recognized until the end of such subordination period when the criteria for conversion was met. The BCFs attributable to both the senior subordinated series D units and the preferred units, discussed under (a) Sale of Preferred Units above, represent non-cash distributions that are treated in the same way as a cash distribution for earnings per unit computations.
The preferred units are entitled to a quarterly distribution equal to the greater of $0.2125 per unit or the amount of the quarterly distribution per unit paid to common unitholders, subject to certain adjustments. Income is allocated to the preferred units in an amount equal to the quarterly distribution with respect to the period earned.
As required under FASB ASC 260-10-45-61A unvested share-based payments that entitle employees to receive non-forfeitable distributions are considered participating securities, as defined in FASB ASC 260-10-20, for earnings per unit calculations. The following table reflects the computation
F-31
CROSSTEX ENERGY, L.P.
Notes to Consolidated Financial Statements (Continued)
December 31, 2011 and 2010
(7) Partners' Capital (Continued)
of basic earnings per limited partner units for the periods presented (in thousands except per unit amounts):
| |
Years Ended December 31, | |||||||||
|---|---|---|---|---|---|---|---|---|---|---|
| |
2011 | 2010 | 2009 | |||||||
Limited partners' interest in net income (loss) |
$ | (19,698 | ) | $ | (57,506 | ) | $ | 105,225 | ||
Distributed earnings allocated to: |
||||||||||
Common units(1) |
$ | 62,238 | $ | 25,606 | $ | 11,234 | ||||
Unvested restricted units |
1,187 | 545 | 134 | |||||||
Senior subordinated series D units(2) |
— | — | 34,297 | |||||||
Total distributed earnings |
$ | 63,425 | $ | 26,151 | $ | 45,665 | ||||
Undistributed earnings allocated to: |
||||||||||
Common units(3) |
$ | (81,616 | ) | $ | (81,703 | ) | $ | 58,220 | ||
Unvested restricted units(3) |
(1,507 | ) | (1,954 | ) | 1,340 | |||||
Total undistributed earnings (loss) |
$ | (83,123 | ) | $ | (83,657 | ) | $ | 59,560 | ||
Net income (loss) allocated to: |
||||||||||
Common units |
$ | (19,377 | ) | $ | (56,097 | ) | $ | 69,454 | ||
Unvested restricted units |
(321 | ) | (1,409 | ) | 1,474 | |||||
Senior subordinated series D units |
— | — | 34,297 | |||||||
Total limited partners' interest in net income (loss) |
$ | (19,698 | ) | $ | (57,506 | ) | $ | 105,225 | ||
Limited Partners' interest in income from discontinued operations: |
||||||||||
Common units |
$ | — | $ | — | $ | 174,278 | ||||
Unvested restricted units |
— | — | 4,034 | |||||||
Total income from discontinued operation(4) |
$ | — | $ | — | $ | 178,312 | ||||
Basic and diluted net income (loss) per unit from continuing operations: |
||||||||||
Common units |
$ | (0.38 | ) | $ | (1.12 | ) | $ | (2.18 | ) | |
Senior subordinated series D units |
$ | — | $ | — | $ | 8.85 | ||||
Basic and diluted net income per unit from discontinuing operations: |
||||||||||
Basic common unit |
$ | — | $ | — | $ | 3.62 | ||||
Diluted common units |
$ | — | $ | — | $ | 3.52 | ||||
Total basic and diluted net income (loss) per unit: |
||||||||||
Basic common unit |
$ | (0.38 | ) | $ | (1.12 | ) | $ | 1.44 | ||
Diluted common units |
$ | (0.38 | ) | $ | (1.12 | ) | $ | 1.40 | ||
Senior subordinated series D units |
$ | — | $ | — | $ | 8.85 | ||||
F-32
CROSSTEX ENERGY, L.P.
Notes to Consolidated Financial Statements (Continued)
December 31, 2011 and 2010
(7) Partners' Capital (Continued)
The following are the unit amounts used to compute the basic and diluted earnings per limited partner unit for the years ended December 31, 2011, 2010 and 2009 (in thousands):
| |
Years Ended December 31, | |||||||||
|---|---|---|---|---|---|---|---|---|---|---|
| |
2011 | 2010 | 2009 | |||||||
Basic and diluted earnings per unit: |
||||||||||
Weighted average limited partner common units outstanding |
50,590 | 49,960 | 48,161 | |||||||
Diluted earnings per unit: |
||||||||||
Weighted average limited partner units outstanding |
50,590 | 49,960 | 48,161 | |||||||
Dilutive effect of restricted units issued |
— | — | 433 | |||||||
Dilutive effect of senior subordinated units |
— | — | 871 | |||||||
Dilutive effect of exercise of options outstanding |
— | — | 2 | |||||||
Dilutive weighted average limited partner common units outstanding |
50,590 | 49,960 | 49,467 | |||||||
Weighted average diluted senior subordinated Series D units outstanding |
— | — | 3,875 | |||||||
All outstanding units were included in the computation of diluted earnings per unit and weighted based on the number of days such units were outstanding during the period presented. All common unit equivalents were antidilutive for the years ended December 31, 2011 and 2010 because the limited partners were allocated a net loss in these periods.
F-33
CROSSTEX ENERGY, L.P.
Notes to Consolidated Financial Statements (Continued)
December 31, 2011 and 2010
(7) Partners' Capital (Continued)
When quarterly distributions are made pro-rata to common and preferred unitholders, net income for the general partner consists of incentive distributions to the extent earned, a deduction for stock-based compensation attributable to CEI's stock options and restricted shares and 2% of the original Partnership's net income (loss) adjusted for the CEI stock-based compensation specifically allocated to the general partner. When quarterly distributions are made solely to the preferred unitholders, the net income for the general partner consists of the CEI stock-based compensation deduction and 2% of the Partnership's net income (loss) after the allocation of income to the preferred unitholders with respect to their preferred distribution adjusted for the CEI stock-based compensation specifically allocated to the general partner. The net income (loss) allocated to the general partner is as follows (in thousands):
| |
Years Ended December 31, | |||||||||
|---|---|---|---|---|---|---|---|---|---|---|
| |
2011 | 2010 | 2009 | |||||||
Income allocation for incentive distributions |
$ | 2,372 | $ | 99 | $ | — | ||||
Stock-based compensation attributable to CEI's stock options and restricted shares |
(3,119 | ) | (3,906 | ) | (2,966 | ) | ||||
2% general partner interest in net income (loss) |
15 | (564 | ) | 2,147 | ||||||
General partner share of net income (loss) |
$ | (732 | ) | $ | (4,371 | ) | $ | (819 | ) | |
(8) Retirement Plans
The Partnership sponsors a single employer 401(k) plan for employees who become eligible upon the date of hire. The plan allows for contributions to be made at each compensation calculation period based on the annual discretionary contribution rate. Contributions of $2.5 million, $2.3 million, and $3.1 million were made to the plan for the years ended December 31, 2011, 2010 and 2009, respectively.
(9) Employee Incentive Plans
(a) Long-Term Incentive Plans
The Partnership's managing general partner has a long-term incentive plan for its employees, directors, and affiliates who perform services for the Partnership. The plan currently permits the grant of awards covering an aggregate of 5,600,000 common unit options and restricted units. The plan is administered by the compensation committee of the Partnership's managing general partner's board of directors. The units issued upon exercise or vesting are newly issued units.
(b) Restricted Units
A restricted unit is a "phantom" unit that entitles the grantee to receive a common unit upon the vesting of the phantom unit, or in the discretion of the compensation committee, cash equivalent to the value of a common unit. In addition, the restricted units will become exercisable upon a change of control of the Partnership, its general partner.
The restricted units are intended to serve as a means of incentive compensation for performance and not primarily as an opportunity to participate in the equity appreciation of the common units.
F-34
CROSSTEX ENERGY, L.P.
Notes to Consolidated Financial Statements (Continued)
December 31, 2011 and 2010
(9) Employee Incentive Plans (Continued)
Therefore, plan participants will not pay any consideration for the common units they receive and the Partnership will receive no remuneration for the units. The restricted units include a tandem award that entitles the participant to receive cash payments equal to the cash distributions made by the Partnership with respect to its outstanding common units until the restriction period is terminated or the restricted units are forfeited. The restricted units granted in 2011, 2010 and 2009 generally cliff vest after three years of service.
The restricted units are valued at their fair value at the date of grant which is equal to the market value of common units on such date. A summary of the restricted unit activity for the year ended December 31, 2011 is provided below:
Crosstex Energy, L.P. Restricted Units:
|
Number of Units |
Weighted Average Grant-Date Fair Value |
|||||
|---|---|---|---|---|---|---|---|
Non-vested, beginning of period |
1,047,374 | $ | 10.30 | ||||
Granted |
385,571 | 15.39 | |||||
Vested* |
(410,418 | ) | 14.48 | ||||
Forfeited |
(72,683 | ) | 11.72 | ||||
Non-vested, end of period |
949,844 | $ | 10.45 | ||||
Aggregate intrinsic value, end of period (in thousands) |
$ | 15,406 | |||||
A summary of the restricted units' aggregate intrinsic value (market value at vesting date) and fair value of units vested (market value at date of grant) during the years ended December 31, 2011, 2010 and 2009 are provided below (in thousands):
| |
Years Ended December 31, | |||||||||
|---|---|---|---|---|---|---|---|---|---|---|
Crosstex Energy, L.P. Restricted Units:
|
2011 | 2010 | 2009 | |||||||
Aggregate intrinsic value of units vested |
$ | 6,438 | $ | 11,076 | $ | 1,023 | ||||
Fair value of units vested |
$ | 5,945 | $ | 5,785 | $ | 4,158 | ||||
As of December 31, 2011, there was $5.6 million of unrecognized compensation cost related to non-vested restricted units. That cost is expected to be recognized over a weighted-average period of 1.8 years.
(c) Unit Options
Unit options will have an exercise price that is not less than the fair market value of the units on the date of grant. In general, unit options granted will become exercisable over a period determined by the compensation committee. In addition, unit options will become exercisable upon a change in control of the Partnership or its general partner.
The fair value of each unit option award is estimated at the date of grant using the Black-Scholes-Merton model. This model is based on the assumptions summarized below. Expected volatilities are
F-35
CROSSTEX ENERGY, L.P.
Notes to Consolidated Financial Statements (Continued)
December 31, 2011 and 2010
(9) Employee Incentive Plans (Continued)
based on historical volatilities of the Partnership's traded common units. The Partnership has used historical data to estimate share option exercise and employee departure behavior to estimate expected forfeiture rates. The expected life of unit options represents the period of time that unit options granted are expected to be outstanding. The risk-free interest rate for periods within the expected term of the unit option is based on the U.S. Treasury yield curve in effect at the time of the grant. The Partnership used the simplified method to calculate the expected term.
Unit options are generally awarded with an exercise price equal to the market price of the Partnership's common units at the date of grant. The unit options granted in 2009 generally vest based on 3 years of service (one-third after each year of service). There were no options granted in 2011 or 2010. The following weighted average assumptions were used for the Black-Scholes-Merton option-pricing model for grants in 2009:
Crosstex Energy, L.P. Unit Options Granted:
|
Years ended December 31, 2009 |
||
|---|---|---|---|
Weighted average distribution yield |
— | % | |
Weighted average expected volatility |
76.2 | % | |
Weighted average risk free interest rate |
2.34 | % | |
Weighted average expected life |
6 years | ||
Weighted average contractual life |
10 years | ||
Weighted average of fair value of unit options granted |
$2.89 |
F-36
CROSSTEX ENERGY, L.P.
Notes to Consolidated Financial Statements (Continued)
December 31, 2011 and 2010
(9) Employee Incentive Plans (Continued)
A summary of the unit option activity for the years ended December 31, 2011, 2010 and 2009 is provided below:
| |
Years Ended December 31, | ||||||||||||||||||
|---|---|---|---|---|---|---|---|---|---|---|---|---|---|---|---|---|---|---|---|
| |
2011 | 2010 | 2009 | ||||||||||||||||
| |
Number of Units |
Weighted Average Exercise Price |
Number of Units |
Weighted Average Exercise Price |
Number of Units |
Weighted Average Exercise Price |
|||||||||||||
Outstanding, beginning of period |
611,311 | $ | 6.77 | 882,836 | $ | 6.43 | 1,304,194 | $ | 30.64 | ||||||||||
Granted(a) |
— | — | — | — | 636,122 | 4.46 | |||||||||||||
Issued in Exchange |
— | — | — | — | 344,319 | 4.80 | |||||||||||||
Rendered in Exchange |
— | — | — | — | (1,032,403 | ) | 31.34 | ||||||||||||
Exercised |
(128,477 | ) | 4.61 | (198,725 | ) | 4.48 | (2,013 | ) | 4.08 | ||||||||||
Forfeited |
(31,260 | ) | 12.83 | (67,183 | ) | 9.27 | (328,295 | ) | 27.51 | ||||||||||
Expired |
— | — | (5,617 | ) | 5.37 | (39,088 | ) | 30.30 | |||||||||||
Outstanding, end of period |
451,574 | $ | 6.99 | 611,311 | $ | 6.77 | 882,836 | $ | 6.43 | ||||||||||
Options exercisable at end of period |
315,742 | $ | 7.42 | 278,214 | $ | 7.78 | 159,929 | $ | 12.51 | ||||||||||
Weighted average contractual term (years) end of period: |
|||||||||||||||||||
Options outstanding |
7.2 | — | 8.2 | — | 8.7 | — | |||||||||||||
Options exercisable |
6.9 | — | 7.6 | — | 4.5 | — | |||||||||||||
Aggregate intrinsic value end of period (in thousands): |
|||||||||||||||||||
Options outstanding |
$ | 4,648 | — | $ | 5,350 | — | $ | 3,143 | — | ||||||||||
Options exercisable |
$ | 3,260 | — | $ | 2,463 | — | $ | 336 | — | ||||||||||
In May 2009, the Partnership's unitholders approved an amendment to the Partnership's long-term incentive plan to allow an option exchange program. This option exchange program was offered to all eligible employees excluding executive officers and directors because options held by employees were "underwater," meaning the exercise price of the options were higher than the current market price of the common units. The terms of the offer included an exchange ratio of 3 old options for 1 replacement option with an exercise price of $4.80 per common unit (120% of the average closing sales price for five trading days prior to the date of grant) which will vest over 2 years (50% after year 1 and 50% after year 2). In June 2009, a total of 453 employees elected to exchange 1,032,403 old options for 344,319 replacement options pursuant to this option exchange program. There was no incremental compensation cost resulting from the modifications under this option exchange program.
A summary of the unit options intrinsic value exercised (market value in excess of exercise price at date of exercise) and fair value of units vested (value per Black-Scholes-Merton option pricing model at
F-37
CROSSTEX ENERGY, L.P.
Notes to Consolidated Financial Statements (Continued)
December 31, 2011 and 2010
(9) Employee Incentive Plans (Continued)
date of grant) during the years ended December 31, 2011, 2010 and 2009 is provided below (in thousands):
| |
Years Ended December 31, | |||||||||
|---|---|---|---|---|---|---|---|---|---|---|
Crosstex Energy, L.P. Unit Options:
|
2011 | 2010 | 2009 | |||||||
Intrinsic value of units options exercised |
$ | 1,527 | $ | 1,470 | $ | 5 | ||||
Fair value of unit options vested |
$ | 563 | $ | 764 | $ | 1,675 | ||||
As of December 31, 2011, there was $0.3 million of unrecognized compensation cost related to non-vested unit options. That cost is expected to be recognized over a weighted average period of 1 year.
(d) Crosstex Energy, Inc.'s Restricted Stock
The Crosstex Energy, Inc. long-term incentive plan provides for the award of restricted stock (collectively, "Awards") for up to 7,190,000 shares of Crosstex Energy, Inc.'s common stock. As of January 1, 2012, approximately 1,642,396 shares remained available under the long-term incentive plans for future issuance to participants. The maximum number of shares set forth above are subject to appropriate adjustment in the event of a recapitalization of the capital structure of Crosstex Energy, Inc. or reorganization of Crosstex Energy, Inc. Awards that are forfeited, terminated or expire unexercised become immediately available for additional awards under the long-term incentive plan.
CEI's restricted shares are included at their fair value at the date of grant which is equal to the market value of the common stock on such date. CEI's restricted stock granted in 2011, 2010 and 2009 generally cliff vest after three years of service. A summary of the restricted stock activity which includes officers and employees of the Partnership and directors of CELP for the year ended December 31, 2011, is provided below:
Crosstex Energy, Inc. Restricted Shares:
|
Number of Shares |
Weighted Average Grant-Date Fair Value |
|||||
|---|---|---|---|---|---|---|---|
Non-vested, beginning of period |
1,108,998 | $ | 8.64 | ||||
Granted |
617,347 | 9.44 | |||||
Vested* |
(412,185 | ) | 13.64 | ||||
Forfeited |
(92,809 | ) | 8.01 | ||||
Non-vested, end of period |
1,221,351 | $ | 7.40 | ||||
Aggregate intrinsic value, end of period (in thousands) |
$ | 15,438 | |||||
F-38
CROSSTEX ENERGY, L.P.
Notes to Consolidated Financial Statements (Continued)
December 31, 2011 and 2010
(9) Employee Incentive Plans (Continued)
A summary of the restricted shares' aggregate intrinsic value (market value at vesting date) and fair value of shares vested (market value at date of grant) during the years ended December 31, 2011, 2010 and 2009 is provided below (in thousands):
| |
Years Ended December 31, | |||||||||
|---|---|---|---|---|---|---|---|---|---|---|
Crosstex Energy, Inc. Restricted Shares:
|
2011 | 2010 | 2009 | |||||||
Aggregate intrinsic value of shares vested |
$ | 3,915 | $ | 3,163 | $ | 1,038 | ||||
Fair value of shares vested |
$ | 5,623 | $ | 4,388 | $ | 4,382 | ||||
As of December 31, 2011 there was $5.2 million of unrecognized compensation costs related to CEI restricted shares for directors, officers and employees. The cost is expected to be recognized over a weighted average period of 1.9 years.
(e) Crosstex Energy, Inc.'s Stock Options
CEI stock options have not been granted since 2005. A summary of the stock option activity includes officers and employees of the Partnership and directors of CEI for the years ended December 31, 2011, 2010 and 2009 is provided below:
| |
Years Ended December 31, | ||||||||||||||||||
|---|---|---|---|---|---|---|---|---|---|---|---|---|---|---|---|---|---|---|---|
| |
2011 | 2010 | 2009 | ||||||||||||||||
| |
Number of Units |
Weighted Average Exercise Price |
Number of Units |
Weighted Average Exercise Price |
Number of Units |
Weighted Average Exercise Price |
|||||||||||||
Outstanding, beginning of period |
37,500 | $ | 6.50 | 67,500 | $ | 9.54 | 67,500 | $ | 9.54 | ||||||||||
Forfeited |
— | — | (30,000 | ) | 13.33 | — | — | ||||||||||||
Outstanding, end of period |
37,500 | $ | 6.50 | 37,500 | $ | 6.50 | 67,500 | $ | 9.54 | ||||||||||
Options exercisable at end of period |
37,500 | $ | 6.50 | 37,500 | $ | 6.50 | 67,500 | $ | 9.54 | ||||||||||
A summary of the share options' intrinsic value (market value in excess of exercise price at date of exercise) exercised and fair value of units vested (value per Black-Scholes-Merton option pricing model at date of grant) during the years ended December 31, 2011, 2010 and 2009 is provided below (in thousands):
| |
Years Ended December 31, | |||||||||
|---|---|---|---|---|---|---|---|---|---|---|
Crosstex Energy, Inc. Stock Options:
|
2011 | 2010 | 2009 | |||||||
Fair value of units vested |
$ | — | $ | — | $ | 49 | ||||
F-39
CROSSTEX ENERGY, L.P.
Notes to Consolidated Financial Statements (Continued)
December 31, 2011 and 2010
(10) Derivatives
Interest Rate Swaps
The Partnership did have any interest rate swaps during the year ended December 31, 2011.
The impact of the interest rate swaps on net income is included in other income (expense) in the consolidated statements of operations as part of interest expense, net, as follows (in thousands):
| |
Years Ended December 31, |
||||||
|---|---|---|---|---|---|---|---|
| |
2010 | 2009 | |||||
Change in fair value of derivatives that do not qualify for hedge accounting |
$ | 22,405 | $ | 797 | |||
Realized losses on derivatives |
(26,542 | ) | (19,044 | ) | |||
Loss on interest rate swaps included in continuing operations |
$ | (4,137 | ) | $ | (18,247 | ) | |
Commodity Swaps
The Partnership manages its exposure to fluctuations in commodity prices by hedging the impact of market fluctuations. Swaps are used to manage and hedge prices and location risk related to these market exposures. Swaps are also used to manage margins on offsetting fixed-price purchase or sale commitments for physical quantities of natural gas and NGLs.
The Partnership commonly enters into various derivative financial transactions which it does not designate as hedges. These transactions include "swing swaps," "third party on-system financial swaps," "storage swaps," "basis swaps," "processing margin swaps" and "put options". Swing swaps are generally short-term in nature (one month), and are usually entered into to protect against changes in the volume of daily versus first-of-month index priced gas supplies or markets. Third party on-system financial swaps are hedges that the Partnership enters into on behalf of its customers who are connected to its systems, wherein the Partnership fixes a supply or market price for a period of time for its customers, and simultaneously enters into the derivative transaction. Storage swap transactions protect against changes in the value of gas that the Partnership has stored to serve various operational requirements. Basis swaps are used to hedge basis location price risk due to buying gas into one of our systems on one index and selling gas off that same system on a different index. Processing margin financial swaps are used to hedge fractionation spread risk at our processing plants relating to the option to process versus bypassing our equity gas. Put options are purchased to hedge against declines in pricing and as such represent options, not obligations, to sell the related underlying volumes at a fixed price.
F-40
CROSSTEX ENERGY, L.P.
Notes to Consolidated Financial Statements (Continued)
December 31, 2011 and 2010
(10) Derivatives (Continued)
The components of (gain) loss on derivatives in the consolidated statements of operations relating to commodity swaps are (in thousands):
| |
Years Ended December 31, | |||||||||
|---|---|---|---|---|---|---|---|---|---|---|
| |
2011 | 2010 | 2009 | |||||||
Change in fair value of derivatives that do not qualify for hedge accounting |
$ | 726 | $ | 1,003 | $ | 2,816 | ||||
Realized (gains) losses on derivatives |
7,015 | 7,955 | (6,139 | ) | ||||||
Ineffective portion of derivatives qualifying for hedge accounting |
(158 | ) | 142 | 65 | ||||||
Net (gains) losses related to commodity swaps |
$ | 7,583 | $ | 9,100 | $ | (3,258 | ) | |||
Put option premium mark to market |
193 | — | — | |||||||
Net losses included in income from discontinued operations |
— | — | 264 | |||||||
(Gains) losses on derivatives included in continuing operations |
$ | 7,776 | $ | 9,100 | $ | (2,994 | ) | |||
The fair value of derivative assets and liabilities relating to commodity swaps are as follows (in thousands):
| |
Years Ended December 31, |
||||||
|---|---|---|---|---|---|---|---|
| |
2011 | 2010 | |||||
Fair value of derivative assets—current, designated |
$ | 151 | $ | 1 | |||
Fair value of derivative assets—current, non-designated |
2,716 | 5,522 | |||||
Fair value of derivative assets—long term, non-designated |
— | 1,169 | |||||
Fair value of derivative liabilities—current, designated |
(702 | ) | (1,066 | ) | |||
Fair value of derivative liabilities—current, non-designated |
(4,885 | ) | (6,914 | ) | |||
Fair value of derivative liabilities—long term, non-designated |
— | (1,156 | ) | ||||
Net fair value of derivatives |
$ | (2,720 | ) | $ | (2,444 | ) | |
Set forth below is the summarized notional volumes and fair value of all instruments held for price risk management purposes and related physical offsets at December 31, 2011 (all gas volumes are expressed in MMBtu's and liquids volumes are expressed in gallons). The remaining term of the contracts extend no later than December 2012. Changes in the fair value of the Partnership's mark to market derivatives are recorded in earnings in the period the transaction is entered into. The effective portion of changes in the fair value of cash flow hedges is recorded in accumulated other
F-41
CROSSTEX ENERGY, L.P.
Notes to Consolidated Financial Statements (Continued)
December 31, 2011 and 2010
(10) Derivatives (Continued)
comprehensive income until the related anticipated future cash flow is recognized in earnings. The ineffective portion is recorded in earnings immediately.
| |
December 31, 2011 | ||||||
|---|---|---|---|---|---|---|---|
Transaction Type
|
Volume | Fair Value | |||||
| |
(In thousands) |
||||||
Cash Flow Hedges:* |
|||||||
Liquids swaps (short contracts) |
(7,876 | ) | $ | (551 | ) | ||
Total swaps designated as cash flow hedges |
$ | (551 | ) | ||||
Mark to Market Derivatives:* |
|||||||
Swing swaps (short contracts) |
(1,600 | ) | $ | (1 | ) | ||
Physical offsets to swing swap transactions (long contracts) |
1,600 | (6 | ) | ||||
Basis swaps (long contracts) |
5,635 |
1,341 |
|||||
Physical offsets to basis swap transactions (short contracts) |
(1,116 | ) | 3,102 | ||||
Basis swaps (short contracts) |
(5,635 | ) | (1,348 | ) | |||
Physical offsets to basis swap transactions (long contracts) |
1,085 | (3,282 | ) | ||||
Processing margin hedges—liquids (short contracts) |
(14,338 |
) |
(294 |
) |
|||
Processing margin hedges—gas (long contracts) |
1,620 | (2,301 | ) | ||||
Processing margin hedges—gas (short contracts) |
(187 | ) | 163 | ||||
Storage swap transactions (long contracts) |
70 |
(5 |
) |
||||
Storage swap transactions (short contracts) |
(360 | ) | 462 | ||||
Total mark to market derivatives |
$ | (2,169 | ) | ||||
On all transactions where the Partnership is exposed to counterparty risk, the Partnership analyzes the counterparty's financial condition prior to entering into an agreement, establishes limits and monitors the appropriateness of these limits on an ongoing basis. The Partnership primarily deals with two types of counterparties, financial institutions and other energy companies, when entering into financial derivatives on commodities. The Partnership has entered into Master International Swaps and Derivatives Association Agreements that allow for netting of swap contract receivables and payables in the event of default by either party. If the Partnership's counterparties failed to perform under existing swap contracts, the Partnership's maximum loss as of December 31, 2011 of $5.9 million would be reduced to $3.9 million due to the netting feature.
F-42
CROSSTEX ENERGY, L.P.
Notes to Consolidated Financial Statements (Continued)
December 31, 2011 and 2010
(10) Derivatives (Continued)
Impact of Cash Flow Hedges
The impact of realized gains or losses from derivatives designated as cash flow hedge contracts in the consolidated statements of operations is summarized below (in thousands):
| |
Years Ended December 31, | |||||||||
|---|---|---|---|---|---|---|---|---|---|---|
Increase (decrease) in Midstream revenue
|
2011 | 2010 | 2009 | |||||||
Natural gas |
$ | — | $ | — | $ | 2,156 | ||||
Liquids |
(2,772 | ) | (1,733 | ) | 9,707 | |||||
Realized (gain) loss included in income from discontinued operations |
— | — | (759 | ) | ||||||
|
$ | (2,772 | ) | $ | (1,733 | ) | $ | 11,104 | ||
Natural Gas
As of December 31, 2011, the Partnership has no balances in accumulated other comprehensive income related to natural gas.
Liquids
As of December 31, 2011, an unrealized derivative fair value net loss of $0.5 million related to cash flow hedges of liquids price risk was recorded in accumulated other comprehensive income (loss). Of this net amount, a $0.5 million loss is expected to be reclassified into earnings through December 2012. The actual reclassification to earnings will be based on mark to market prices at the contract settlement date, along with the realization of the gain or loss on the related physical volume, which amount is not reflected above.
Derivatives Other Than Cash Flow Hedges
Assets and liabilities related to third party derivative contracts, swing swaps, basis swaps, storage swaps and processing margin swaps are included in the fair value of derivative assets and liabilities and the profit and loss on the mark to market value of these contracts are recorded net as (gain) loss on derivatives in the consolidated statement of operations. The Partnership estimates the fair value of all of its energy trading contracts using actively quoted prices. The estimated fair value of energy trading contracts by maturity date was as follows (in thousands):
| |
Maturity Periods | ||||||||||||
|---|---|---|---|---|---|---|---|---|---|---|---|---|---|
| |
Less than one year |
One to two years |
More than two years |
Total fair value |
|||||||||
December 31, 2011. |
$ | (2,169 | ) | $ | — | $ | — | $ | (2,169 | ) | |||
F-43
CROSSTEX ENERGY, L.P.
Notes to Consolidated Financial Statements (Continued)
December 31, 2011 and 2010
(11) Fair Value Measurements
FASB ASC 820 sets forth a framework for measuring fair value and required disclosures about fair value measurements of assets and liabilities. Fair value under FASB ASC 820 is defined as the price at which an asset could be exchanged in a current transaction between knowledgeable, willing parties. A liability's fair value is defined as the amount that would be paid to transfer the liability to a new obligor, not the amount that would be paid to settle the liability with the creditor. Where available, fair value is based on observable market prices or parameters or derived from such prices or parameters. Where observable prices or inputs are not available, use of unobservable prices or inputs are used to estimate the current fair value, often using an internal valuation model. These valuation techniques involve some level of management estimation and judgment, the degree of which is dependent on the item being valued.
FASB ASC 820 established a three-tier fair value hierarchy, which prioritizes the inputs used in measuring fair value. These tiers include: Level 1, defined as observable inputs such as quoted prices in active markets; Level 2, defined as inputs other than quoted prices in active markets that are either directly or indirectly observable; and Level 3, defined as unobservable inputs in which little or no market data exists, therefore requiring an entity to develop its own assumptions.
The Partnership's derivative contracts primarily consist of commodity swap contracts which are not traded on a public exchange. The fair values of commodity swap contracts are determined using discounted cash flow techniques. The techniques incorporate Level 1 and Level 2 inputs for future commodity prices that are readily available in public markets or can be derived from information available in publicly quoted markets. These market inputs are utilized in the discounted cash flow calculation considering the instrument's term, notional amount, discount rate and credit risk and are classified as Level 2 in hierarchy.
Net assets (liabilities) measured at fair value on a recurring basis are summarized below (in thousands):
| |
Years Ended December 31, |
||||||
|---|---|---|---|---|---|---|---|
| |
2011 | 2010 | |||||
| |
Level 2 | Level 2 | |||||
Interest Rate Swaps |
$ | — | $ | — | |||
Commodity Swaps* |
(2,720 | ) | (2,444 | ) | |||
Total |
$ | (2,720 | ) | $ | (2,444 | ) | |
Fair Value of Financial Instruments
The estimated fair value of the Partnership's financial instruments has been determined by the Partnership using available market information and valuation methodologies. Considerable judgment is required to develop the estimates of fair value, thus, the estimates provided below are not necessarily
F-44
CROSSTEX ENERGY, L.P.
Notes to Consolidated Financial Statements (Continued)
December 31, 2011 and 2010
(11) Fair Value Measurements (Continued)
indicative of the amount the Partnership could realize upon the sale or refinancing of such financial instruments (in thousands).
| |
December 31, 2011 | December 31, 2010 | |||||||||||
|---|---|---|---|---|---|---|---|---|---|---|---|---|---|
| |
Carrying Value |
Fair Value |
Carrying Value |
Fair Value |
|||||||||
Long-term debt |
$ | 798,409 | $ | 882,500 | $ | 718,570 | $ | 768,308 | |||||
Obligations under capital lease |
28,367 | 27,637 | 31,327 | 28,807 | |||||||||
The carrying amounts of the Partnership's cash and cash equivalents, accounts receivable, and accounts payable approximate fair value due to the short-term maturities of these assets and liabilities.
The Partnership had $85.0 million in borrowings under its revolving credit facility included in long-term debt as of December 31, 2011 and no borrowings under this credit facility as of December 31, 2010. Borrowings under the credit facility accrue interest under a floating interest rate structure so the carrying value of such indebtedness approximates fair value for the amounts outstanding under the credit facility. As of December 31, 2011 and December 31, 2010, the Partnership also had borrowings totaling $713.4 million and $711.5 million, net of discount, respectively, under senior unsecured notes with a fixed rate of 8.875% and a series B secured note with a principal amount of $7.1 million as of December 31, 2010 with a fixed rate of 9.5%. The fair value of the senior unsecured notes as of December 31, 2011 and December 31, 2010 was based on third party market quotations. The fair values of the series B secured note as of December 31, 2010 was adjusted to reflect current market interest rates for such borrowings on that date.
(12) Transactions with Related Parties
CEI paid the Partnership $0.8 million, $0.8 million and $0.8 million during the years ended December 31, 2011, 2010 and 2009, respectively, to cover its portion of administrative and compensation costs for officers and employees that perform services for CEI. This reimbursement is evaluated on an annual basis. Officers and employees that perform services for CEI provide an estimate of the portion of their time devoted to such services. A portion of their annual compensation (including bonuses, payroll taxes and other benefit costs) is allocated to CEI for reimbursement based on these estimates. In addition, an administrative burden is added to such costs to reimburse us for additional support costs, including, but not limited to, consideration for rent, office support and information service support.
F-45
CROSSTEX ENERGY, L.P.
Notes to Consolidated Financial Statements (Continued)
December 31, 2011 and 2010
(13) Commitments and Contingencies
(a) Leases—Lessee
The Partnership has operating leases for office space, office and field equipment.
The following table summarizes the Partnership remaining non-cancelable future payments under operating leases with initial or remaining non-cancelable lease terms in excess of one year (in thousands):
2012 |
$ | 13,191 | ||
2013 |
7,649 | |||
2014 |
5,941 | |||
2015 |
4,535 | |||
2016 |
4,469 | |||
Thereafter |
5,528 | |||
|
$ | 41,313 | ||
Operating lease rental expense in the years ended December 31, 2011, 2010 and 2009, was approximately $21.9 million, $21.9 million and $30.7 million, respectively.
(b) Employment and Severance Agreements
Certain members of management of the Partnership are parties to employment and/or severance agreements with the general partner. The employment and severance agreements provide those managers with severance payments in certain circumstances and, in the case of employment agreements, prohibit each such person from competing with the general partner or its affiliates for a certain period of time following the termination of such person's employment.
(c) Environmental Issues
The Partnership acquired LIG Pipeline Company and its subsidiaries on April 1, 2004. Contamination from historical operations was identified during due diligence at a number of sites owned by the acquired companies. The seller, AEP, has indemnified the Partnership for these identified sites. Moreover, AEP has entered into an agreement with a third-party company pursuant to which the remediation costs associated with these sites have been assumed by this third party company that specializes in remediation work. The Partnership does not expect to incur any material liability with these sites; however, there can be no assurance that the third parties who have assumed responsibility for remediation of site conditions will fulfill their obligations.
(d) Other
The Partnership is involved in various litigation and administrative proceedings arising in the normal course of business. In the opinion of management, any liabilities that may result from these claims would not individually or in the aggregate have a material adverse effect on its financial position or results of operations.
F-46
CROSSTEX ENERGY, L.P.
Notes to Consolidated Financial Statements (Continued)
December 31, 2011 and 2010
(13) Commitments and Contingencies (Continued)
On June 7, 2010, Formosa Plastics Corporation, Texas, Formosa Plastics Corporation America, Formosa Utility Venture, Ltd., and Nan Ya Plastics Corporation, America filed a lawsuit against Crosstex Energy, Inc., Crosstex Energy, L.P., Crosstex Energy GP, L.P., Crosstex Energy GP, LLC, Crosstex Energy Services, L.P., and Crosstex Gulf Coast Marketing, Ltd. in the 24th Judicial District Court of Calhoun County, Texas, asserting claims for negligence, res ipsa loquitor, products liability and strict liability relating to the alleged receipt by the plaintiffs of natural gas liquids into their facilities from facilities operated by the Partnership. The amended petition alleges that the plaintiffs have incurred approximately $35.0 million in damages, including damage to equipment and lost profits. The Partnership has submitted the claim to its insurance carriers and intends to vigorously defend the lawsuit. The Partnership believes that any recovery would be within applicable policy limits. Although it is not possible to predict the ultimate outcome of this matter, the Partnership does not expect that an award in this matter will have a material adverse impact on its consolidated results of operations or financial condition.
At times, the Partnership's gas-utility subsidiaries acquire pipeline easements and other property rights by exercising rights of eminent domain provided under state law. As a result, the Partnership (or its subsidiaries) is a party to a number of lawsuits under which a court will determine the value of pipeline easements or other property interests obtained by the Partnership's gas utility subsidiaries by condemnation. Damage awards in these suits should reflect the value of the property interest acquired and the diminution in the value of the remaining property owned by the landowner. However, some landowners have alleged unique damage theories to inflate their damage claims or assert valuation methodologies that could result in damage awards in excess of the amounts anticipated. Although it is not possible to predict the ultimate outcomes of these matters, the Partnership does not expect that awards in these matters will have a material adverse impact on its consolidated results of operations or financial condition.
The Partnership (or its subsidiaries) is defending a number of lawsuits filed by owners of property located near processing facilities or compression facilities constructed by the Partnership as part of its systems. The suits generally allege that the facilities create a private nuisance and have damaged the value of surrounding property. Claims of this nature have arisen as a result of the industrial development of natural gas gathering, processing and treating facilities in urban and occupied rural areas. In January 2012, a plaintiff in one of these lawsuits was awarded a judgment of $2.0 million. The Partnership intends to appeal the matter and will post a bond to secure the judgment pending its resolution. The Partnership has accrued $2.0 million related to this matter as of December 31, 2011 and reflected the related expense in operating expenses in the fourth quarter of 2011. Although it is not possible to predict the ultimate outcomes of these matters, the Partnership does not expect that awards in these matters will have a material adverse impact on its consolidated results of operations or financial condition.
(14) Segment Information
Identification of operating segments is based principally upon regions served. The Partnership's reportable segments consist of the natural gas gathering, processing and transmission operations located in north Texas and in the Permian Basin in west Texas (NTX), the pipelines and processing plants located in Louisiana (LIG) and the south Louisiana processing and NGL assets (PNGL). Segment data
F-47
CROSSTEX ENERGY, L.P.
Notes to Consolidated Financial Statements (Continued)
December 31, 2011 and 2010
(14) Segment Information (Continued)
for the years ended December 31, 2011, 2010 and 2009 do not include assets held for sale. The Partnership's sales are derived from external domestic customers.
The Partnership evaluates the performance of its operating segments based on operating revenues and segment profits. Corporate expenses include general partnership expenses associated with managing all reportable operating segments. Corporate assets consist principally of property and equipment, including software, for general corporate support, working capital, debt financing costs and its investment in HEP. Profit in the corporate segment for the years ended 2010 and 2009 includes the operating activity of assets sold but not considered discontinued operations as well as intersegment eliminations.
F-48
CROSSTEX ENERGY, L.P.
Notes to Consolidated Financial Statements (Continued)
December 31, 2011 and 2010
(14) Segment Information (Continued)
Summarized financial information concerning the Partnership's reportable segments is shown in the following table.
| |
LIG | NTX | PNGL | Corporate | Totals | |||||||||||
|---|---|---|---|---|---|---|---|---|---|---|---|---|---|---|---|---|
| |
(In thousands) |
|||||||||||||||
Year Ended December 31, 2011: |
||||||||||||||||
Sales to external customers |
$ | 811,216 | $ | 332,026 | $ | 870,700 | $ | — | $ | 2,013,942 | ||||||
Sales to affiliates |
128,130 | 100,527 | 40,185 | (268,842 | ) | — | ||||||||||
Purchased gas and NGLs |
(809,471 | ) | (262,708 | ) | (835,440 | ) | 268,842 | (1,638,777 | ) | |||||||
Operating expenses |
(35,434 | ) | (48,807 | ) | (27,537 | ) | — | (111,778 | ) | |||||||
Segment profit |
$ | 94,441 | $ | 121,038 | $ | 47,908 | $ | — | $ | 263,387 | ||||||
Gain (loss) on derivatives |
$ | (6,145 | ) | $ | (1,896 | ) | $ | 265 | $ | — | $ | (7,776 | ) | |||
Depreciation, amortization and impairments |
$ | (13,602 | ) | $ | (76,535 | ) | $ | (31,271 | ) | $ | (3,876 | ) | $ | (125,284 | ) | |
Capital expenditures |
$ | 2,820 | $ | 73,069 | $ | 25,618 | $ | 2,629 | $ | 104,136 | ||||||
Identifiable assets |
$ | 304,372 | $ | 1,113,431 | $ | 460,865 | $ | 76,663 | $ | 1,955,331 | ||||||
Year Ended December 31, 2010: |
||||||||||||||||
Sales to external customers |
$ | 880,336 | $ | 309,771 | $ | 602,569 | $ | — | $ | 1,792,676 | ||||||
Sales to affiliates |
82,688 | 89,752 | — | (172,440 | ) | — | ||||||||||
Purchased gas and NGLs |
(845,627 | ) | (240,085 | ) | (541,104 | ) | 172,440 | (1,454,376 | ) | |||||||
Operating expenses |
(33,188 | ) | (46,384 | ) | (25,488 | ) | — | (105,060 | ) | |||||||
Segment profit |
$ | 84,209 | $ | 113,054 | $ | 35,977 | $ | — | $ | 233,240 | ||||||
Loss on derivatives |
$ | (3,664 | ) | $ | (5,352 | ) | $ | (84 | ) | $ | — | $ | (9,100 | ) | ||
Depreciation, amortization and impairments |
$ | (12,308 | ) | $ | (64,458 | ) | $ | (31,661 | ) | $ | (4,435 | ) | $ | (112,862 | ) | |
Capital expenditures |
$ | 9,930 | $ | 31,678 | $ | 5,871 | $ | 1,907 | $ | 49,386 | ||||||
Identifiable assets |
$ | 330,199 | $ | 1,107,279 | $ | 493,143 | $ | 54,319 | $ | 1,984,940 | ||||||
Year Ended December 31, 2009 |
||||||||||||||||
Sales to external customers |
$ | 830,248 | $ | 439,265 | $ | 297,872 | $ | 16,166 | $ | 1,583,551 | ||||||
Sales to affiliates |
63,581 | 70,141 | — | (133,722 | ) | — | ||||||||||
Purchased gas and NGLs |
(792,991 | ) | (352,762 | ) | (250,060 | ) | 123,484 | (1,272,329 | ) | |||||||
Operating expenses |
(27,550 | ) | (49,379 | ) | (30,991 | ) | (2,474 | ) | (110,394 | ) | ||||||
Segment profit |
$ | 73,288 | $ | 107,265 | $ | 16,821 | $ | 3,454 | $ | 200,828 | ||||||
Gain (loss) on derivatives |
$ | (467 | ) | $ | 2,289 | $ | 1,172 | $ | — | $ | 2,994 | |||||
Depreciation, amortization and impairments |
$ | (12,996 | ) | $ | (65,956 | ) | $ | (35,284 | ) | $ | (7,746 | ) | $ | (121,982 | ) | |
Capital expenditures |
$ | 30,992 | $ | 43,289 | $ | 7,973 | $ | 1,153 | $ | 83,407 | ||||||
Identifiable assets |
$ | 341,495 | $ | 1,168,182 | $ | 505,155 | $ | 54,349 | $ | 2,069,181 | ||||||
F-49
CROSSTEX ENERGY, L.P.
Notes to Consolidated Financial Statements (Continued)
December 31, 2011 and 2010
(14) Segment Information (Continued)
The following table reconciles the segment profits reported above to the operating income as reported in the consolidated statements of operations (in thousands):
| |
Years ended December 31, | |||||||||
|---|---|---|---|---|---|---|---|---|---|---|
| |
2011 | 2010 | 2009 | |||||||
Segment profits |
$ | 263,387 | $ | 233,240 | $ | 200,828 | ||||
General and administrative expenses |
(52,801 | ) | (48,414 | ) | (59,854 | ) | ||||
Gain (loss) on derivatives |
(7,776 | ) | (9,100 | ) | 2,994 | |||||
Gain (loss) on sale of property |
(264 | ) | 13,881 | 666 | ||||||
Depreciation, amortization and impairments |
(125,284 | ) | (112,862 | ) | (121,982 | ) | ||||
Operating income |
$ | 77,262 | $ | 76,745 | $ | 22,652 | ||||
F-50
CROSSTEX ENERGY, L.P.
Notes to Consolidated Financial Statements (Continued)
December 31, 2011 and 2010
(15) Quarterly Financial Data (Unaudited)
Summarized unaudited quarterly financial data is presented below.
| |
First | Second | Third | Fourth | Total | |||||||||||
|---|---|---|---|---|---|---|---|---|---|---|---|---|---|---|---|---|
| |
(In thousands, except per unit data) |
|||||||||||||||
2011: |
||||||||||||||||
Revenues(1) |
$ | 489,770 | $ | 525,735 | $ | 517,498 | $ | 480,939 | $ | 2,013,942 | ||||||
Operating income |
$ | 19,983 | $ | 22,890 | $ | 16,249 | $ | 18,140 | $ | 77,262 | ||||||
Net income (loss) attributable to the non-controlling interest |
$ | (54 | ) | $ | (52 | ) | $ | (23 | ) | $ | 81 | $ | (48 | ) | ||
Net income (loss) attributable to the Crosstex Energy, L.P. |
$ | 128 | $ | 1,667 | $ | (2,736 | ) | $ | (1,401 | ) | $ | (2,342 | ) | |||
Preferred interest in net income (loss) attributable to Crosstex Energy, L.P. |
$ | 4,265 | $ | 4,559 | $ | 4,558 | $ | 4,706 | $ | 18,088 | ||||||
General partner interest in net income (loss) |
$ | (522 | ) | $ | (111 | ) | $ | (76 | ) | $ | (23 | ) | $ | (732 | ) | |
Limited partners' interest in net income (loss) attributable to Crosstex Energy, L.P. |
$ | (3,615 | ) | $ | (2,781 | ) | $ | (7,218 | ) | $ | (6,084 | ) | $ | (19,698 | ) | |
Loss per limited partner unit-basic |
$ | (0.07 | ) | $ | (0.05 | ) | $ | (0.14 | ) | $ | (0.12 | ) | $ | (0.38 | ) | |
Loss per limited partner unit-diluted |
$ | (0.07 | ) | $ | (0.05 | ) | $ | (0.14 | ) | $ | (0.12 | ) | $ | (0.38 | ) | |
2010: |
||||||||||||||||
Revenues |
$ | 468,658 | $ | 442,048 | $ | 454,735 | $ | 427,235 | $ | 1,792,676 | ||||||
Operating income |
$ | 24,598 | $ | 17,591 | $ | 16,731 | $ | 17,825 | $ | 76,745 | ||||||
Net income (loss) attributable to the non-controlling interest |
$ | (35 | ) | $ | 10 | $ | 13 | $ | 31 | $ | 19 | |||||
Net loss attributable to the Crosstex Energy, L.P. |
$ | (17,328 | ) | $ | (2,468 | ) | $ | (3,668 | ) | $ | (2,384 | ) | $ | (25,848 | ) | |
Preferred interest in net loss attributable to Crosstex Energy, L.P. |
$ | 3,125 | $ | 3,125 | $ | 3,676 | $ | 3,824 | $ | 13,750 | ||||||
Beneficial conversion feature attributable to preferred units |
$ | 22,279 | $ | — | $ | — | $ | — | $ | 22,279 | ||||||
General partner interest in net loss |
$ | (1,496 | ) | $ | (1,279 | ) | $ | (820 | ) | $ | (776 | ) | $ | (4,371 | ) | |
Limited partners' interest in net loss attributable to Crosstex Energy, L.P. |
$ | (41,236 | ) | $ | (4,314 | ) | $ | (6,524 | ) | $ | (5,432 | ) | $ | (57,506 | ) | |
Loss per limited partner unit-basic |
$ | (0.81 | ) | $ | (0.08 | ) | $ | (0.13 | ) | $ | (0.11 | ) | $ | (1.12 | ) | |
Loss per limited partner unit-diluted |
$ | (0.81 | ) | $ | (0.08 | ) | $ | (0.13 | ) | $ | (0.11 | ) | $ | (1.12 | ) | |
F-51
CROSSTEX ENERGY, L.P.
VALUATION AND QUALIFYING ACCOUNTS
| |
Balance at Beginning of Period |
Charged to Costs and Expenses |
Deductions | Balance at End of Period |
|||||||||
|---|---|---|---|---|---|---|---|---|---|---|---|---|---|
| |
(In thousands) |
||||||||||||
Year ended December 31, 2011 Allowance for doubtful accounts |
$ | 163 | $ | 1,346 | $ | 1,104 | $ | 405 | |||||
Year ended December 31, 2010 Allowance for doubtful accounts |
$ | 410 | $ | 395 | $ | 642 | $ | 163 | |||||
Year ended December 31, 2009 Allowance for doubtful accounts |
$ | 3,655 | $ | 1,070 | $ | 4,315 | $ | 410 | |||||
F-52